1,903
Views
19
CrossRef citations to date
0
Altmetric
Research Paper

Successful treatment of asymptomatic or clinically terminal bovine Mycobacterium avium subspecies paratuberculosis infection (Johne's disease) with the bacterium Dietzia used as a probiotic alone or in combination with dexamethasone

Adaption to chronic human diarrheal diseases

Pages 131-143 | Received 30 Jan 2011, Accepted 29 Mar 2011, Published online: 01 Mar 2011

Figures & data

Figure 1 Photographs of Stage IV, end-stage, diseased cow, Green-4, before and after Dietzia treatment. Photo on the left is prior to treatment and photo on the right is four months post-treatment: note increase in body mass and improved coat appearance.
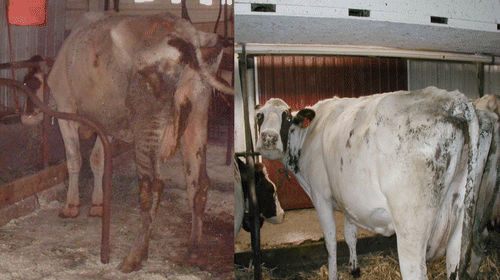
Figure 1 Photographs of Stage IV, end-stage, diseased cow, Green-4, before and after Dietzia treatment. Photo on the left is prior to treatment and photo on the right is four months post-treatment: note increase in body mass and improved coat appearance.

Figure 2 Longitudinal changes in body weight, milk production, ELISA values and fecal MAP for Stage IV cow, Green-4. (A) Dashed line is body weight and solid line is official DHIA weight of milk produced/day. (B) Solid line is ELISA OD405 nm values and dashed line is fecal MAP. Symbol (+) signifies a positive AGID. (C) Dose (viable colony forming units, cfu) of Dietzia.
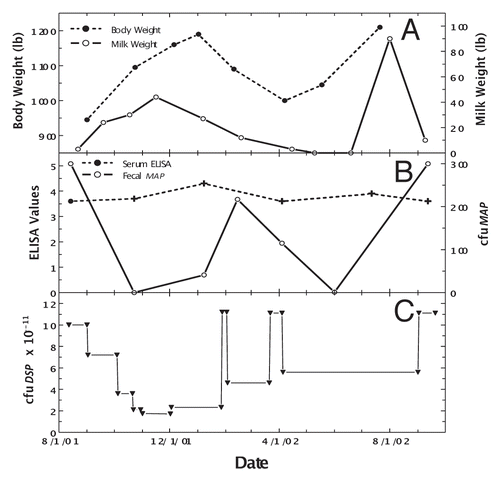
Figure 2 Longitudinal changes in body weight, milk production, ELISA values and fecal MAP for Stage IV cow, Green-4. (A) Dashed line is body weight and solid line is official DHIA weight of milk produced/day. (B) Solid line is ELISA OD405 nm values and dashed line is fecal MAP. Symbol (+) signifies a positive AGID. (C) Dose (viable colony forming units, cfu) of Dietzia.

Figure 3 Longitudinal ELISA values for seven individual Stage II or III cows considered cured after Dietzia treatment. Vertical lines with animal's identification number indicate the time at which Dietzia treatment was terminated. Thin dashed lines denote best-fit of ELISA OD405 nm values. BL is 1.4 ELISA-positive/negative cutoff. As discussed in the text, during the initial months of treatment, the best-linear-fit curves declined to negative values (<1.4), suggesting the absence of systemic MAP (animal was cured)
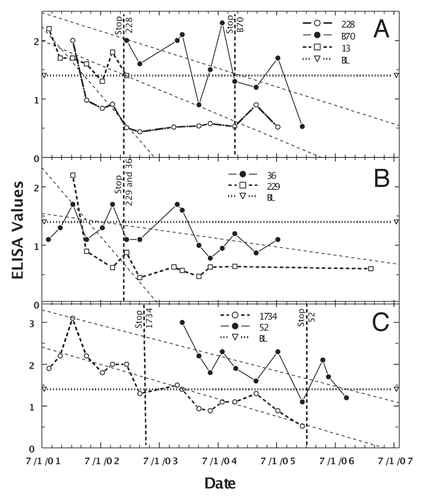
Figure 3 Longitudinal ELISA values for seven individual Stage II or III cows considered cured after Dietzia treatment. Vertical lines with animal's identification number indicate the time at which Dietzia treatment was terminated. Thin dashed lines denote best-fit of ELISA OD405 nm values. BL is 1.4 ELISA-positive/negative cutoff. As discussed in the text, during the initial months of treatment, the best-linear-fit curves declined to negative values (<1.4), suggesting the absence of systemic MAP (animal was cured)

Figure 4 Longitudinal ELISA values for cow with Stage II, then Stage I and finally Stage IV disease (biphasic ELISA changes) at different doses of Dietzia. Thin dashed lines are best-fit for ELISA OD405 nm values. BL is 1.4 ELISA-positive/negative cutoff.
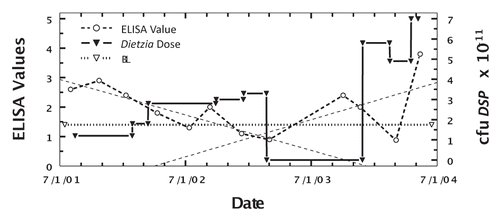
Figure 4 Longitudinal ELISA values for cow with Stage II, then Stage I and finally Stage IV disease (biphasic ELISA changes) at different doses of Dietzia. Thin dashed lines are best-fit for ELISA OD405 nm values. BL is 1.4 ELISA-positive/negative cutoff.

Figure 5 Longitudinal ELISA and fecal values for cow, April, with Stage II or IV disease at different doses of Dietzia and dexamethasone. Upper panel. Solid line is ELISA OD405 nm values and dashed line is fecal MAP. Symbol (+) signifies a positive AGID. BL is 1.4 ELISA-positive/negative cutoff. Lower panel. Dose of Dietzia and dexamethasone.
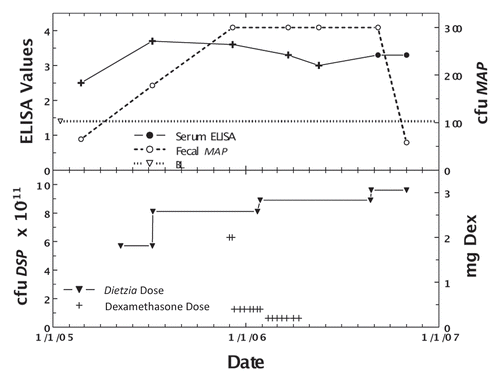
Figure 5 Longitudinal ELISA and fecal values for cow, April, with Stage II or IV disease at different doses of Dietzia and dexamethasone. Upper panel. Solid line is ELISA OD405 nm values and dashed line is fecal MAP. Symbol (+) signifies a positive AGID. BL is 1.4 ELISA-positive/negative cutoff. Lower panel. Dose of Dietzia and dexamethasone.

Figure 6 Longitudinal ELISA and fecal values for cow, 232, with initial Stage II and then Stage III disease at different doses of Dietzia and dexamethasone. Upper panel, solid line is ELISA OD405 nm values and dashed line is fecal MAP. Symbol (+) signifies a positive AGID. Thin dashed lines denote best-fit of ELISA values. BL is 1.4 ELISA-positive/negative cutoff. Lower panel, dose of Dietzia and dexamethasone.
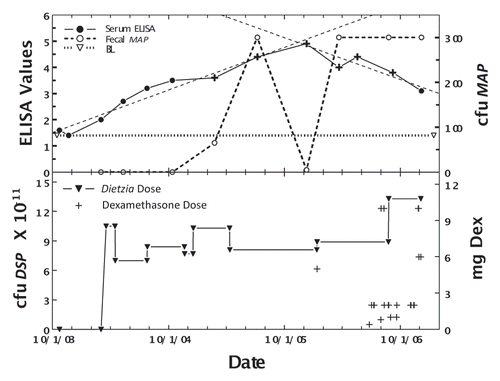
Figure 6 Longitudinal ELISA and fecal values for cow, 232, with initial Stage II and then Stage III disease at different doses of Dietzia and dexamethasone. Upper panel, solid line is ELISA OD405 nm values and dashed line is fecal MAP. Symbol (+) signifies a positive AGID. Thin dashed lines denote best-fit of ELISA values. BL is 1.4 ELISA-positive/negative cutoff. Lower panel, dose of Dietzia and dexamethasone.

Figure 7 Longitudinal ELISA and fecal values for cow, Trixie, with lifetime intermittent Stage II or III disease at different doses of Dietzia and dexamethasone. Upper panel. Solid line is ELISA OD405 nm values and dashed line is fecal MAP. Symbol (+) signifies a positive AGID. Thin dashed lines denote best-fit of ELISA values. BL is 1.4 ELISA-positive/negative cutoff. Lower panel. Dose of Dietzia and dexamethasone.
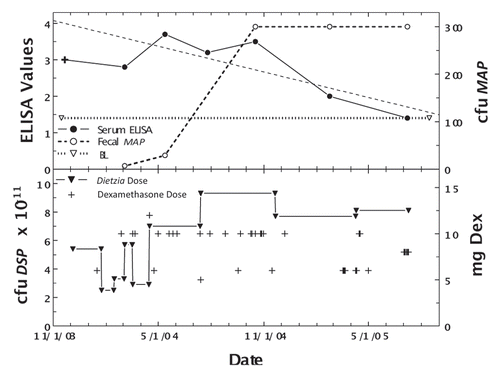
Figure 7 Longitudinal ELISA and fecal values for cow, Trixie, with lifetime intermittent Stage II or III disease at different doses of Dietzia and dexamethasone. Upper panel. Solid line is ELISA OD405 nm values and dashed line is fecal MAP. Symbol (+) signifies a positive AGID. Thin dashed lines denote best-fit of ELISA values. BL is 1.4 ELISA-positive/negative cutoff. Lower panel. Dose of Dietzia and dexamethasone.

Figure 8 Longitudinal ELISA and fecal values for cow, 255, with initial Stage III disease at different doses of Dietzia and dexamethasone. Solid line is ELISA OD405 nm values and dashed line is fecal MAP. Symbol (+) signifies a positive AGID. BL is 1.4 ELISA-positive/negative cutoff. Start and stop Dietzia shown by vertical lines.
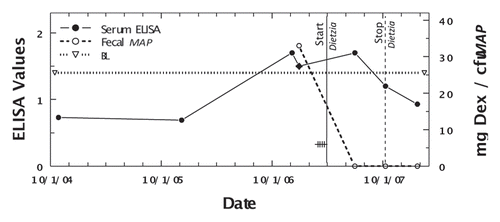
Figure 8 Longitudinal ELISA and fecal values for cow, 255, with initial Stage III disease at different doses of Dietzia and dexamethasone. Solid line is ELISA OD405 nm values and dashed line is fecal MAP. Symbol (+) signifies a positive AGID. BL is 1.4 ELISA-positive/negative cutoff. Start and stop Dietzia shown by vertical lines.

Table 1 Parameters of Dietzia-treated and non-treated Stage II or III paratuberculosis cows

Table 2 Dietzia plus dexamethasone treatment of Stage III or IV paratuberculosis cows