652
Views
17
CrossRef citations to date
0
Altmetric
Research Paper

Replication and spread of CJD, kuru and scrapie agents in vivo and in cell culture

, &
Pages 188-199 | Received 24 Mar 2011, Accepted 19 Apr 2011, Published online: 01 May 2011

Figures & data

Figure 1 Infectivity assays of FU-infected brain homogenates. (A) Western blots of GT1 indicator cells exposed to serial FU-CJD brain dilutions (3e5 to 3 CE) at p5; with dilution decreasing amounts of PrP-res are induced. Proteinase K treatment (PK) and relative protein load indicated in each lane are indicated, as well as the %PrP-res (of total PrP) beneath the +PK lanes. Note the FU-CJD diagnostic 13 kDa PrP-res band (arrow). (B) With further passages, PrP-res signals are detectable with an input of only 3CE as shown at p13. Since additional passages did not show a PrP-res signal with lower input CE, FU-CJD homogenates have 1 TCID per 3 brain cells. (C). Graph of %PrP-res induced by each serial CE dilution at progressive passages. Note that the incubation time curves are roughly parallel for each dilution, i.e., the PrP-res rate of increase is similar for each input dilution. PrP-res in FU-CJD cells became maximal at ∼25%, and minor PrP-res variations between 25–31% were due to variable breakdown during cell collections; when cellular lysosomal enzymes digest PrP during collection, total PrP will be reduced, and thus the %PrP-res falsely increased. (D) Plots the log agent TCID to the linear accumulation of %PrP-res at different passages. More extensive passages with 3 CE input (p15) confirmed a 4 log discrimination of the FU-CJD agent by this assay. This as well as other western blots shown here revealed no additional small bands of <12 kd as previously depicted in references Citation3 and Citation4.
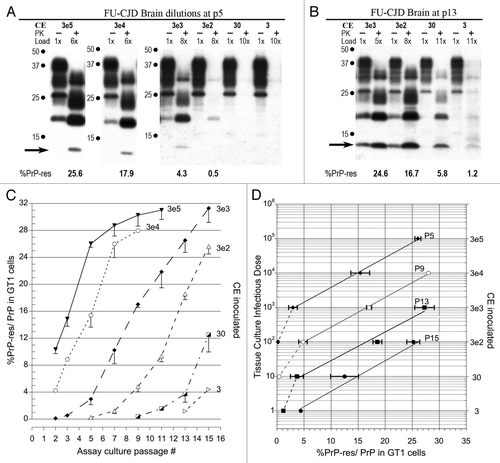
Figure 1 Infectivity assays of FU-infected brain homogenates. (A) Western blots of GT1 indicator cells exposed to serial FU-CJD brain dilutions (3e5 to 3 CE) at p5; with dilution decreasing amounts of PrP-res are induced. Proteinase K treatment (PK) and relative protein load indicated in each lane are indicated, as well as the %PrP-res (of total PrP) beneath the +PK lanes. Note the FU-CJD diagnostic 13 kDa PrP-res band (arrow). (B) With further passages, PrP-res signals are detectable with an input of only 3CE as shown at p13. Since additional passages did not show a PrP-res signal with lower input CE, FU-CJD homogenates have 1 TCID per 3 brain cells. (C). Graph of %PrP-res induced by each serial CE dilution at progressive passages. Note that the incubation time curves are roughly parallel for each dilution, i.e., the PrP-res rate of increase is similar for each input dilution. PrP-res in FU-CJD cells became maximal at ∼25%, and minor PrP-res variations between 25–31% were due to variable breakdown during cell collections; when cellular lysosomal enzymes digest PrP during collection, total PrP will be reduced, and thus the %PrP-res falsely increased. (D) Plots the log agent TCID to the linear accumulation of %PrP-res at different passages. More extensive passages with 3 CE input (p15) confirmed a 4 log discrimination of the FU-CJD agent by this assay. This as well as other western blots shown here revealed no additional small bands of <12 kd as previously depicted in references Citation3 and Citation4.

Figure 2 Infectivity of GT1 cells chronically infected with FU-CJD. (A) Representative western blots of GT1 homogenate dilutions at p7 and p13. Progressive passages show infectivity in as little as 0.3 CE by p13. This is a 10 fold higher TCID than FU-CJD brain (). PK treatment, CE applied, %PrP-res induced with each serial dilution, and the diagnostic 13 kDa band are indicated. Note the GT1 cells exposed to FU-infected cell homogenate dilutions accumulate PrP-res more rapidly than those exposed to FU-infected brain homogenates. (B) Graph of progressive PrP-res accumulation at each input CE dilution. (C) Standard plots of log TCID to %PrP-res shows the same slope in FU-CJD infected cells and brain; the only difference is that fewer infected cells were required to induce the same %PrP-res, i.e., the cells were consistently more infectious.
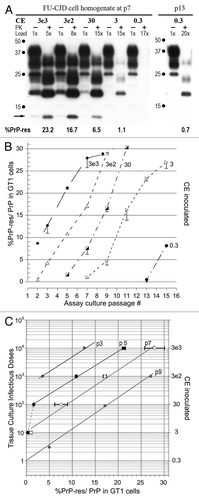
Figure 2 Infectivity of GT1 cells chronically infected with FU-CJD. (A) Representative western blots of GT1 homogenate dilutions at p7 and p13. Progressive passages show infectivity in as little as 0.3 CE by p13. This is a 10 fold higher TCID than FU-CJD brain (Fig. 1). PK treatment, CE applied, %PrP-res induced with each serial dilution, and the diagnostic 13 kDa band are indicated. Note the GT1 cells exposed to FU-infected cell homogenate dilutions accumulate PrP-res more rapidly than those exposed to FU-infected brain homogenates. (B) Graph of progressive PrP-res accumulation at each input CE dilution. (C) Standard plots of log TCID to %PrP-res shows the same slope in FU-CJD infected cells and brain; the only difference is that fewer infected cells were required to induce the same %PrP-res, i.e., the cells were consistently more infectious.

Figure 3 Western blot TCID assays of kCJD-infected brain. (A) Passage number, input cell equivalents (CE) and relative protein loads applied to each lane are indicated. The reference brain-specific PrP-res band pattern loaded with 3e5 brain homogenate CE is not visible in the GT1 indicator cells exposed to kCJD brain. Instead, a de novo GT1-specific PrP-res pattern is already seen at p1. A series of input dilutions, including lower CE are shown for p7 and p13 after kCJD brain infection. Note at p1 and p7 the %PrP-res is the same and does not rise, e.g., compare 3e4 and 3e3 CE inputs at p1 and p7. The %PrP-res in GT1 cells exposed to 300 CE was detectable on only very dark films at p7 but was clearly positive at p13 with a 17× load. Thus kCJD brain contained maximally 1 TCID per 300 cells, a 1,000-fold lower titer than FU-CJD-infected cells. The mouse brain PrP-res pattern was the same for kCJD and FU-CJD as shown previously in references Citation3 and Citation4 and in those transmissions, no bands of <15 kd were seen in kCJD infected GT1 cells. (B) Plot of %PrP-res exposed to CE dilutions at sequential passages confirms the lack of increase in %PrP-res with time. Nevertheless, the different levels of %PrP-res accurately discriminate different input CE s (and titer). There is a significant difference in the %PrP-res from 300 to 3e5 CE at p7, yielding a 3 log TCID span for kCJD. (C) Standard kCJD plot for %PrP-res to infectious titer. Note that only the same slope, but the same line is seen with different inputs at p5 and p7.

Figure 3 Western blot TCID assays of kCJD-infected brain. (A) Passage number, input cell equivalents (CE) and relative protein loads applied to each lane are indicated. The reference brain-specific PrP-res band pattern loaded with 3e5 brain homogenate CE is not visible in the GT1 indicator cells exposed to kCJD brain. Instead, a de novo GT1-specific PrP-res pattern is already seen at p1. A series of input dilutions, including lower CE are shown for p7 and p13 after kCJD brain infection. Note at p1 and p7 the %PrP-res is the same and does not rise, e.g., compare 3e4 and 3e3 CE inputs at p1 and p7. The %PrP-res in GT1 cells exposed to 300 CE was detectable on only very dark films at p7 but was clearly positive at p13 with a 17× load. Thus kCJD brain contained maximally 1 TCID per 300 cells, a 1,000-fold lower titer than FU-CJD-infected cells. The mouse brain PrP-res pattern was the same for kCJD and FU-CJD as shown previously in references Citation3 and Citation4 and in those transmissions, no bands of <15 kd were seen in kCJD infected GT1 cells. (B) Plot of %PrP-res exposed to CE dilutions at sequential passages confirms the lack of increase in %PrP-res with time. Nevertheless, the different levels of %PrP-res accurately discriminate different input CE s (and titer). There is a significant difference in the %PrP-res from 300 to 3e5 CE at p7, yielding a 3 log TCID span for kCJD. (C) Standard kCJD plot for %PrP-res to infectious titer. Note that only the same slope, but the same line is seen with different inputs at p5 and p7.

Table 1 TSE agents display very divergent replication “clocks” when studied in the same host background as seen in the above numbers