1,321
Views
27
CrossRef citations to date
0
Altmetric
Research Paper

Functional characterization of exopolyphosphatase/guanosine pentaphosphate phosphohydrolase (PPX/GPPA) of Campylobacter jejuni

, , , , &
Pages 521-533 | Received 20 Dec 2013, Accepted 20 Feb 2014, Published online: 25 Feb 2014

Figures & data

Figure 1. Intracellular poly-P levels in C. jejunippx mutants. Poly-P was extracted using glass milk and quantified by toluidine blue O method. Each data point represents the mean ± SE of 3 independent experiments with duplicate samples. *P ≤ 0.05 and **P ≤ 0.001.
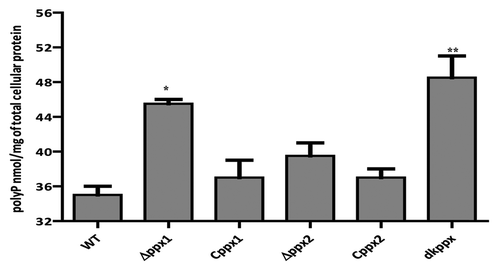
Figure 1. Intracellular poly-P levels in C. jejuni ∆ppx mutants. Poly-P was extracted using glass milk and quantified by toluidine blue O method. Each data point represents the mean ± SE of 3 independent experiments with duplicate samples. *P ≤ 0.05 and **P ≤ 0.001.

Figure 2. Intracellular ppGpp levels in the C. jejunippx mutants. The amount of ppGpp accumulation was assessed in MOPS using early log phase culture labeled with 32P. The nucleotides were resolved by TLC and quantified using densitometry. The graph shows the percentage decrease/increase in the levels of ppGpp in mutants at 24 h. The complemented strains (Cppx1 and Cppx2) did not show a significant change in the intracellular ppGpp pool compared with wild type as chloramphenicol has been shown to inhibit ppGpp synthesis (data not shown). Each bar represents the average from 2 independent experiments performed using duplicate samples in each experiment.
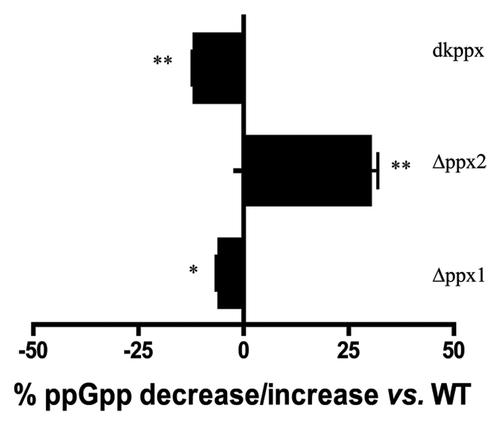
Figure 2. Intracellular ppGpp levels in the C. jejuni ∆ppx mutants. The amount of ppGpp accumulation was assessed in MOPS using early log phase culture labeled with 32P. The nucleotides were resolved by TLC and quantified using densitometry. The graph shows the percentage decrease/increase in the levels of ppGpp in mutants at 24 h. The complemented strains (Cppx1 and Cppx2) did not show a significant change in the intracellular ppGpp pool compared with wild type as chloramphenicol has been shown to inhibit ppGpp synthesis (data not shown). Each bar represents the average from 2 independent experiments performed using duplicate samples in each experiment.

Figure 3. Nutrient stress survival of ∆ppx mutants in minimum essential media: (A–C) Sensitivity of C. jejuni ∆ppx mutants to nutrient starvation was assessed by monitoring their survival in chemically defined media (MEM without glutamine) at different time points. All the ∆ppx mutants showed stress survival defect at t 36 h onwards and complemention partially rescued the defect. (D) Nutrient stress survival of ∆ppx mutants in stringent basal media (MEM-α) in presence or absence of specific amino acids. The specific amino acids (l-aspartate, l-glutamate, l-serine and l-proline) were added to basal media at the concentration of 20 mM. CFU/mL value represents mean ± SD of two independent experiments with duplicate samples in each experiment. The dotted line across the bar graph indicates the limit of detection (10 CFU/mL). *P ≤ 0.05. n.s denotes not significant.
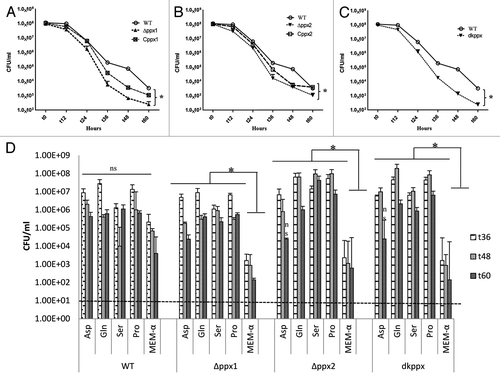
Figure 3. Nutrient stress survival of ∆ppx mutants in minimum essential media: (A–C) Sensitivity of C. jejuni ∆ppx mutants to nutrient starvation was assessed by monitoring their survival in chemically defined media (MEM without glutamine) at different time points. All the ∆ppx mutants showed stress survival defect at t 36 h onwards and complemention partially rescued the defect. (D) Nutrient stress survival of ∆ppx mutants in stringent basal media (MEM-α) in presence or absence of specific amino acids. The specific amino acids (l-aspartate, l-glutamate, l-serine and l-proline) were added to basal media at the concentration of 20 mM. CFU/mL value represents mean ± SD of two independent experiments with duplicate samples in each experiment. The dotted line across the bar graph indicates the limit of detection (10 CFU/mL). *P ≤ 0.05. n.s denotes not significant.

Figure 4. Motility and biofilm formation of C. jejuni ∆ppx mutants. (A) Motility was assessed on 0.4% soft agar at 42 °C for 24 h. (B) Motility was quantified by measuring the swarming zone (diameter in cm) surrounding the stabbed area. Each bar represents the average from 3 independent experiments with duplicate samples. *P ≤ 0.05 **P ≤ 0.001. (C) The biofilm formation was visualized by staining with 1% crystal violet for 15 min. (D) The amount of biofilm was quantified by measuring the absorbance at 570 nm after dissolving in 3 mL DMSO for 48 h. Each bar represents the mean ± SE of 3 independent experiments with triplicate samples in each experiment. **P ≤ 0.001.
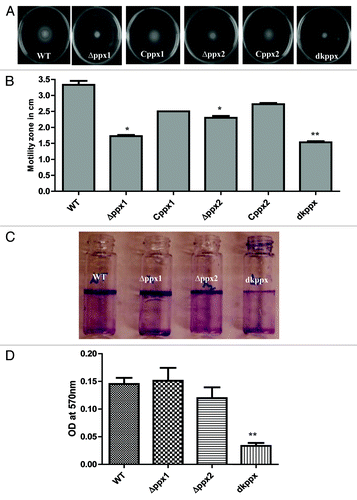
Figure 4. Motility and biofilm formation of C. jejuni ∆ppx mutants. (A) Motility was assessed on 0.4% soft agar at 42 °C for 24 h. (B) Motility was quantified by measuring the swarming zone (diameter in cm) surrounding the stabbed area. Each bar represents the average from 3 independent experiments with duplicate samples. *P ≤ 0.05 **P ≤ 0.001. (C) The biofilm formation was visualized by staining with 1% crystal violet for 15 min. (D) The amount of biofilm was quantified by measuring the absorbance at 570 nm after dissolving in 3 mL DMSO for 48 h. Each bar represents the mean ± SE of 3 independent experiments with triplicate samples in each experiment. **P ≤ 0.001.

Figure 5. Osmotic stress responses of C. jejuni ∆ppx mutants. The dkppx mutant shows decreased osmotic stress tolerance on solid media (A) as well as liquid media (B). In liquid media osmotic stress was determined by monitoring cells survival at different time points. Each bar represents the mean ± SE from 3 independent experiments with duplicate samples in each experiment. *P ≤ 0.05.
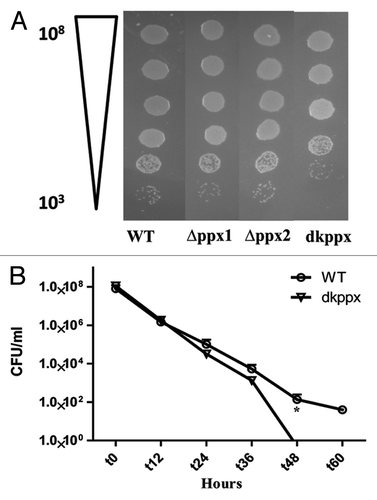
Figure 5. Osmotic stress responses of C. jejuni ∆ppx mutants. The dkppx mutant shows decreased osmotic stress tolerance on solid media (A) as well as liquid media (B). In liquid media osmotic stress was determined by monitoring cells survival at different time points. Each bar represents the mean ± SE from 3 independent experiments with duplicate samples in each experiment. *P ≤ 0.05.

Figure 6. The ppx mutants display defect in invasion and intracellular survival in INT 407 human intestinal epithelial cells. (A) Invasion assay and (B) Intracellular survival assay. The dotted line across the bar graph indicates the limit of detection (10 CFU/mL). Each bar represents the mean ± SE from 2 independent experiments with duplicate samples in each experiment. *P ≤ 0.05 **P ≤ 0.001.
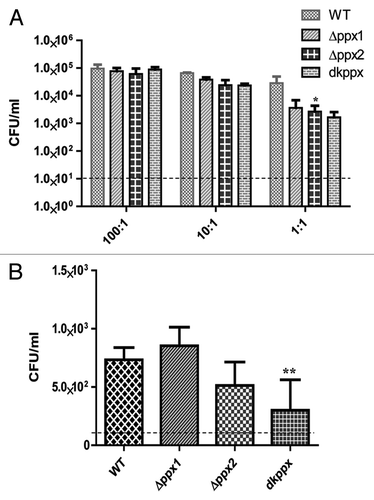
Figure 6. The ppx mutants display defect in invasion and intracellular survival in INT 407 human intestinal epithelial cells. (A) Invasion assay and (B) Intracellular survival assay. The dotted line across the bar graph indicates the limit of detection (10 CFU/mL). Each bar represents the mean ± SE from 2 independent experiments with duplicate samples in each experiment. *P ≤ 0.05 **P ≤ 0.001.

Figure 7. Complement dependent killing of C. jejuni ∆ppx mutants. (A) ∆ppx mutants killing by human serum. (B) ∆ppx mutants killing by human serum in the presence of MgCl2 and EGTA (C) ∆ppx mutants killing by chicken serum. Log10 killing was determined by subtracting the difference between number of CFU determined in heat inactivated human or chicken serum (HINHS or HINCS) to normal serum (NHS or NCS). Bars represent the mean ± SE of 3 independent experiments performed in duplicates each time. *P ≤ 0.05.
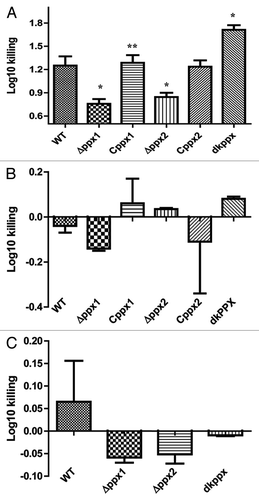
Figure 7. Complement dependent killing of C. jejuni ∆ppx mutants. (A) ∆ppx mutants killing by human serum. (B) ∆ppx mutants killing by human serum in the presence of MgCl2 and EGTA (C) ∆ppx mutants killing by chicken serum. Log10 killing was determined by subtracting the difference between number of CFU determined in heat inactivated human or chicken serum (HINHS or HINCS) to normal serum (NHS or NCS). Bars represent the mean ± SE of 3 independent experiments performed in duplicates each time. *P ≤ 0.05.

Figure 8. qRT-PCR analysis of C. jejuni ∆ppx mutants for genes involved in poly-P and ppGpp homeostasis. Fold difference in transcript levels was assessed by ∆∆CT method. The expression of target genes was normalized to the 16s-rRNA expression levels from the same strain and then the relative expression of target genes were determined by comparing to expression in wild type strain. Each bar represents the mean ± SE of the relative fold change in expression from 4 independent experiments performed in duplicates each time. *P ≤ 0.05.
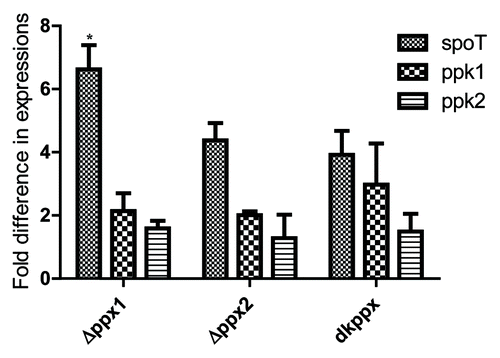
Figure 8. qRT-PCR analysis of C. jejuni ∆ppx mutants for genes involved in poly-P and ppGpp homeostasis. Fold difference in transcript levels was assessed by ∆∆CT method. The expression of target genes was normalized to the 16s-rRNA expression levels from the same strain and then the relative expression of target genes were determined by comparing to expression in wild type strain. Each bar represents the mean ± SE of the relative fold change in expression from 4 independent experiments performed in duplicates each time. *P ≤ 0.05.

Table 1. Bacterial strains and plasmids used in this study

Supplemental material

Additional material

Download Zip (1.6 MB)

Reprints and Corporate Permissions

Please note: Selecting permissions does not provide access to the full text of the article, please see our help page How do I view content?

To request a reprint or corporate permissions for this article, please click on the relevant link below:

Academic Permissions

Please note: Selecting permissions does not provide access to the full text of the article, please see our help page How do I view content?

Obtain permissions instantly via Rightslink by clicking on the button below:

If you are unable to obtain permissions via Rightslink, please complete and submit this Permissions form. For more information, please visit our Permissions help page.