Figures & data
Figure 1. Immunity-related activities in the hemolymph of final-instar G. mellonella larvae (A) General antibacterial activity measured as the diameter of the lytic zone on agar plates and converted into lysozyme equivalents (μg/mL). Results represent medians with quartiles. (B) Phenoloxidase activity (slope at Vmax) measured from hemolymph samples. Results represent medians with quartiles.
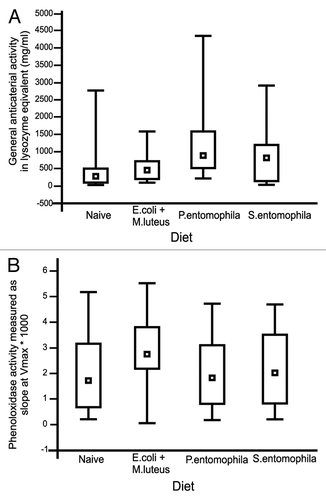
Figure 2. RT-qPCR results of differentially-expressed immunity-related genes in G. mellonella. PPO, prophenoloxidase; PRP, peptidoglycan recognition protein; GST, glutathione-S-transferase; LPS-binding, lipopolysaccharide binding protein. (A) Gene expression in the midgut tissue of larvae fed on bacterial diets compared with larvae grown on naïve (bacteria-free) diets. (B) Gene expression in the eggs laid by parents fed on bacterial diets compared with naïve (bacteria-free) diets. Relative fold changes for each gene were set to 1 for the control treatment. Results represent the mean values of 3 independent biological replicates ± SE.
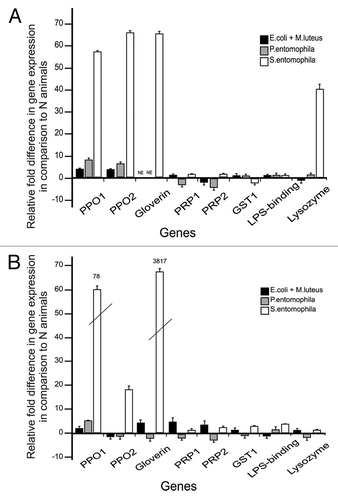
Figure 3. Proteomic analysis of G. mellonella eggs by 2DGE. (A) Eggs laid by naïve parents fed on an uncontaminated diet as larvae. (B) Eggs laid by parents fed on a diet supplemented with a mixture of E. coli and M. luteus. (C) Eggs laid by parents fed on a diet supplemented with P. entomophila. (D) Eggs laid by parents fed on a diet supplemented with S. entomophila. Circles highlight the differences in protein expression in the lower acidic part of the gel. Protein spots identified by peptide mass fingerprinting are marked with an asterisk and labeled accordingly.
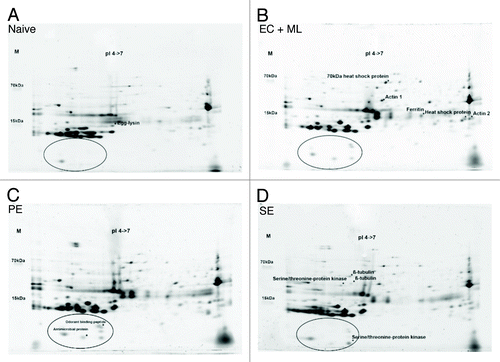
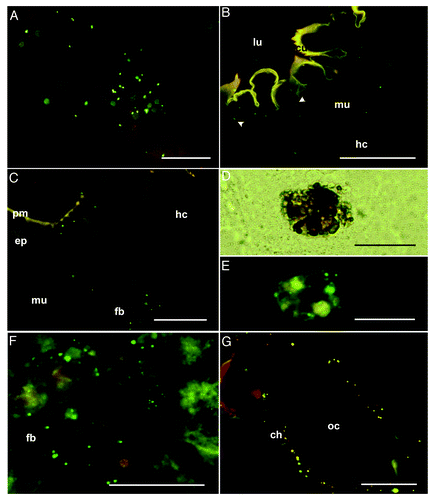
Figure 4. Analysis of the maternal transfer of bacteria in G. mellonella by fluorescence microscopy (A) Artificial diet mixed with fluorescently-labeled E. coli (green spots), cryo-section, scale bar = 50 μm. (B–C) Final-larval instar (stage V) fed with bacteria-contaminated diet. (B) Higher magnification of the foregut epithelium to show fluorescent E. coli beneath the cuticle. Ingested bacteria (green spots) are scattered in the epithelium (arrowhead), in the intercellular space between the epithelium and muscular tissue, and in the musculature and hemocoel, cryo-section, scale bar = 100 μm. (C) Fluorescence images of the midgut region showing translocated labeled bacterial probes (green spots) in association with the midgut epithelium as well as the fat body cells in the hemocoel, cryo-section, scale bar = 100 μm. (D–F) Pupal stage injected with labeled bacterial probes. (D) Higher magnification shows additional distributed nodule formations of circulating hemocytes in the pupal hemocoel, cryo-section, scale bar = 50 μm. (E) Nodules include bacterial probes (green spots), cryo-section, scale bar = 50 μm. (F) Bacteria attached to the fat body of pupae, cryo-section, scale bar = 100 μm. (G) Oviposited eggs of females injected with fluorescent bacteria during final-instar stage. The oocyte is lined with a chorion containing fluorescent E. coli (green spots), cryo-section, scale bar = 100 μm. Fluorescent photomicrographs were acquired with overlays of DSR and GFP2 fluorescence filters to optimize fluorescence visualization. Abbreviations: ch, chorion; cu, cuticle; ep, epithelium; fb, fat body; hc, hemocoel; lu, gut lumen; mu, musculature; oc, oocyte; pm, peritrophic membrane.