Abstract
Many studies have evaluated the effects of nitrogen-fertilizer rates on Fusarium head blight (FHB) and mycotoxin contamination of wheat (Triticum aestivum) in both conventional and organic systems. Results are often conflicting while underlying mechanisms remain illusive. This study aimed to provide insights into these conflicting results. Spring wheat was grown at two sites in the Netherlands in 2006 and 2007 using compost-, slurry-, or farmyard manure-based organic fertilizing systems, each with five total-nitrogen rates. In 2006, overall Fusarium infection levels and deoxynivalenol (DON) contents of the grain were low, and the data suggested a positive, multivariate relation between DON content and grain-nitrogen content. Higher DON contents were also accompanied by more vegetative growth (straw biomass). In 2007, plant density of the crop was relatively low while overall FHB infection levels and DON contents were relatively high. In this year, no clear correlations between straw dry matter production or grain-nitrogen content and DON content were found, while weed infestation increased with higher nitrogen levels. Practical implications of the multivariate relations between N-rates, N-contents, DON, microclimate and the presence of weeds are discussed.
1 Introduction
Fusarium head blight (FHB) poses a serious problem to wheat production. It is caused by one or more Fusarium species, including F. graminearum (Schwabe), F. culmorum (W.G. Smith) Sacc., F. avenaceum (Fries) Sacc., and F. poae (Peck) Wollenw., and by Microdochium nivale (Fries) Samuels and Hallett. FHB infections can reduce grain quality by producing a variety of mycotoxins, of which the trichothecene deoxynivalenol (DON) appears to be the one most commonly encountered [Citation1]. This mycotoxin is a protein synthesis disruptor and can cause serious health problems for both animals and humans [Citation2,Citation3]. Therefore, the European Commission recently set a legal limit for DON contents of unprocessed wheat at 1250 μg kg−1 [Citation4].
The DON content of harvested wheat shows high year-to-year variation as it is highly influenced by weather conditions [Citation5]. Moist and warm weather, especially around anthesis but also a prolonged wet period around harvesting may increase DON levels. Furthermore, DON content is related to the virulence of fungal isolates [Citation6,Citation7] and influenced by the resistance of the host, i.e., more resistant wheat cultivars usually have lower DON levels than highly susceptible varieties [Citation7–Citation9].
Also nitrogen application rates can be of influence. Lemmens et al. [Citation10] showed that at a nitrogen application rate in the range of 0–80 kg N ha−1 the FHB infection and the DON contamination of wheat grain significantly increased with increasing nitrogen rate. Also Milev et al. [Citation11] reported FHB being promoted by addition of inorganic fertilizer (120 kg N and P ha−1) compared with non-fertilized controls. However, Subedi et al. [Citation12] using rates 0, 60 and 100 kg N ha−1 (with 40 kg N being applied at anthesis for the highest N rate) found inconsistent effects. Others studies [Citation13–Citation15] did not reveal any significant effects of N application on FHB or DON. In summary, inconsistent results have been found concerning nitrogen rates and DON contents: if present, trends indicated lower DON levels only at low nitrogen fertilization rates as described above.
For conventional wheat growers in north-western Europe reducing nitrogen fertilization to levels below 80 or 100 kg N ha−1 is not a sound crop management option as it would make wheat production economically unattractive. To organic wheat growers knowledge about the relationship between soil-nitrogen availability and DON content may be relevant as nitrogen availability is usually lower in comparison with conventional farming. The resulting lower yields are compensated by a higher premium price, especially for baking-quality wheat. The premium price for baking-quality wheat usually increases with grain protein content. Therefore, in the Netherlands during the last decade also organic farmers are increasing nitrogen fertilization, mainly by split applications with organic amendments at tillering and at the flowering stage. This increase in nitrogen fertilization would be counterproductive if this would increase DON content and consequently reduce nutritional quality.
The research presented in this paper was set up to study the effect of different types and doses of organic fertilizers on DON content. Specific research aims were: (1) to understand the origin of the conflicting relations between nitrogen application rate and DON content, and (2) to investigate the relevance and magnitude of influence of various nitrogen regimes used in organic farming on the variation in DON content.
2 Materials and methods
Field experiments were conducted in 2006 and 2007 at two sites using the spring wheat variety Lavett, which is commonly grown by Dutch organic farmers. The first site was located in Colijnsplaat (51°35′N, 3°51′E) and featured a clay soil (Fluvisol, 17% clay, 2% soil organic matter; potential rooting depth >0.8 m). At this experimental farm, which has been managed organically since 2002, a trial was laid out with two treatments of a long-term comparison of different soil fertility management strategies: yearly fertilization with cattle slurry (S) or compost (C). Where cattle slurry was used, it was applied during spring at a rate of 20–35 t ha−1, containing 92–161 kg total-N ha−1. Alternatively, compost was applied during fall at a rate of 30–35 t ha−1 and supplemented with spring-applied molasses. So the total basal application of N was 246–287 kg N ha−1 in the compost-based system, most of it in an organic form. In both years the preceding crop was onion.
The second site was situated near Zeewolde (52°19′N, 5°25′E) featuring a farmyard manure based system (F) on a heavy clay soil (Fluvisol, >30% clay, 4% soil organic matter; potential rooting depth >0.8 m). This site was a commercial farm that had been managed organically since 1996 with farmyard manure applied in fall at a rate of 10–15 t ha−1 (45–67 kg total-N ha−1). In 2006, wheat was preceded by sweet corn and in 2007 by French beans.
For each of these three historic soil amendment systems we studied the effect of two different supplemental (top-dressed) N sources (molasses and feather-meal pellets). These were applied at different rates at anthesis, resulting in totals of 0 kg N ha−1 (control), 65 and 105 kg N ha−1 (pellets) and 108 and 175 kg N ha−1 (molasses) (for details see ). The highest N application rate was split into two doses applied at an interval of two weeks. Lemmens et al. [Citation10] indicated that a response to added nitrogen could be expected at low nitrogen levels. Therefore, it was decided to reduce the basal fertilization level in 2007 by skipping the spring application of slurry (system S) and the early spring application of molasses in the compost-based plots (system C). The topdressing treatments of supplemental organic pellets and molasses at anthesis were not modified (). To obtain an impression of the amount of nitrogen available for plant uptake in the various treatments, the plant available nitrogen (PAN) for each treatment was calculated using the NDICEA 5.4 model [Citation16]. Inorganic N in the topsoil (0–30 cm) layer of all plots was measured four to five times during the season and used for model validation. Subsequently, NDICEA was used to calculate PAN.
Table 1 Treatments at the two experimental sites including the soil amendments used for basal dressing, top-dressing materials, N-dose(s) applied at anthesis and NDICEA-calculated plant available nitrogen (PAN) values for each treatment.
The experiment was of a complete randomized block design with four replications. Plot size was 12 m × 2 m for all systems in 2006 and for the F system in 2007. In 2007, plot size for the S and C systems was 12 m × 3 m because of practical reasons related to the harvest. The net harvested areas were 15.75 m2 (F, 2006 and 2007), 18.9 m2 (S and C, 2006) and 24.1 m2 (S and C, 2007). Temperature and evapotranspiration were recorded at nearby weather stations: Wilhelminaoord (S, C) and Zeewolde (F). Precipitation was recorded at the farm (S, C) and at a nearby farm (F).
In 2006 the wheat was sown on 17 March (S and C) and 5 February (F); harvesting took place on 3 August (S and C) and 23 August (F). In 2007, sowing dates were 4 April (S and C) and 29 March (F), and the crops were harvested on 3 September (S and C) and 28 August (F). In 2006, the additional fertilizer was applied on 12 May (S and C) and 20 May (F); in 2007 the corresponding application dates were 15 June (S and C) and 31 May (F). The additional split application for the highest N rate treatments took place two weeks after the initial application. The molasses, a liquid fertilizer, was spread by hand, immediately followed by rinsing the crop with pure water to prevent crop damage and to improve soil incorporation of the fertilizer. Due to the ammonium content of the molasses, part of the nitrogen is likely to have been lost due to volatilization. The amount lost was estimated and was taken into account when calculating PAN values.
To enhance the Fusarium infection, 0.2 kg m−2 of chopped maize stems and leaves were spread in each plot shortly before anthesis [Citation17]. In the absence of rain in the following week, crops were sprinkled at night (after 8 p.m.) with 1 mm of water three times a week to promote fungal development.
During 2007 the wheat crop in Zeewolde (systems S and C) was severely infested with weeds. The presence of weeds at this site was recorded visually on 7 August using a 10-point score (0: no weeds present; 10: more than 90% of the total leaf area index of crops and weeds was weed). This date coincided with the early–late milk crop development stage (BBCH stage 73–77). For each plot, soil weed coverage was estimated for both sides of the plots and the average of the two estimates was used for the overall plot score.
Grain yield and straw dry weight were recorded at harvest time. Representative samples of both grain and straw were analysed for nitrogen content using a FOSS NIT Infralyzer (FOSS NIRSystems, Laurel, MD, USA) calibrated on the Kjeldahl analysis. The grain was dried to 15% moisture content and stored at 18 °C. The level of Fusarium infection in the seeds was determined using a blotter test (four lots of 50 seeds placed on wet filter paper were incubated for 3 days at 10 °C, followed by 3 days at 20 °C, no light). The amount of DON contamination was measured in both years using the Neogen Elisa Test (Neogen Europe Ltd., Ayr, Scotland, UK).
Statistical analysis was done with GenStat 9.1.0.147 (Lawes Agricultural Trust, Hertfordshire, UK). To normalize their distribution DON contents were log10 transformed before statistical analysis. To visualize the relation between grain-N and DON contents, the two sites (Colijnsplaat with treatments S and C and Zeewolde with treatment F) as well as the two years (2006 and 2007) were analysed separately.
3 Results
3.1 Weather conditions
Average daily temperatures at the Zeewolde location during the growing seasons of 2006 and 2007 were 11.2 and 11.5 °C, respectively, while total rainfall during the growing season was 744 and 790 mm, respectively. Corresponding temperatures for Colijnsplaat were 10.6 and 11.4 °C and rainfall 656 and 857 mm. Spring 2007 at both locations was characterized by a severe drought period that lasted for almost eight weeks. In F, the number of seedlings that emerged was reduced; in S and C germination was interrupted and resumed seven weeks later. As a result, the 2007 plant densities were low, especially in treatments S and C.
3.2 Nitrogen rates, yields and plant available N
Average grain yields in 2006 were 7853, 7575 and 4697 kg ha−1 for the S, C and F systems, respectively (). In 2007, corresponding values were 2731, 2834 and 3266 kg ha−1. The low yields at Zeewolde (F) in 2006 compared with the systems at Colijnsplaat (S and C) coincided with relatively low calculated plant available N (PAN) values (). This was also reflected by differences in calculated PAN values among soil amendment systems (). Overall, calculated PAN values were lowest in the F system, intermediate in the S system and highest in the C system. Overall calculated PAN values in F were higher in 2007 than in 2006 whereas for systems C and S the reverse was found.
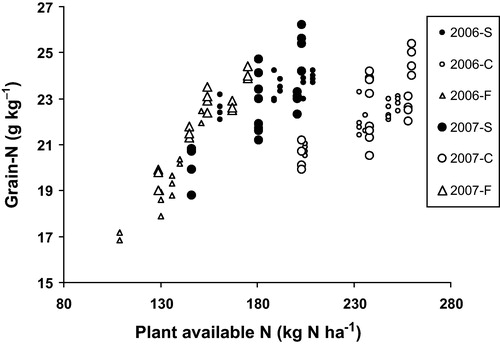
Table 2 Effect of experimental treatments on grain yield and straw dry matter accumulation during the 2006 and 2007 growing season for the three different soil amendment systems. Means in the same column, followed by a different lower cast letter are statistically different (p < 0.05).
3.3 Fusarium head blight infection and deoxynivalenol
In 2006, the overall percentage Fusarium head blight (FHB) infected seeds and the deoxynivalenol (DON) contents were much lower than in 2007 (), the differences between the two years being highly significant (). The basal fertilizer systems (S, C, and F) did not have any significant effect on the percentage FHB infected seeds. The top-dressing treatment, however, did (p = 0.002). For the control treatment, with no additional fertilizer applied at anthesis, the percentage FHB infected seeds was lowest. It tended to increase with increasing fertilizer application rate at anthesis, and was highest for the molasses application of 175 kg N ha−1.
Table 3 Summary statistics (mean, median, minimum and maximum) of the FHB infected seeds (% of all seeds) measured in a blotter test, and the DON contents in the years 2006 and 2007.
Table 4 Results of the ANOVA on the percentage of FHB infected seeds. No statistically significant interactions were found, but between years and between the top-dressing treatments differences were statistically significant as indicated by different lower cast letters following the means (p < 0.05).
The log10 transformed DON contents also show that the difference between years was statistically significant (). Furthermore, the differences in DON content among the basal fertilizer treatments were statistically different (p = 0.004): DON content was higher in the S treatment than in both C and F. The year × topdressing interaction was statistically significant (p = 0.023): topdressing had a significant effect on DON content in 2006 but not in 2007. In comparison, this interaction was not significant for the percentage FHB infected seeds (p = 0.355). In 2006, the control treatment had the lowest DON content (1.999 log10 μg kg−1 or 99.8 μg kg−1), and DON content increased to 2.284 log10 μg kg−1 or 192.8 μg kg−1 for the molasses application of 175 kg ha−1. In 2007, all DON levels were higher.
Table 5 Results of the ANOVA on log10DON contents. There was a statistically significant interaction between top-dressing treatment and year, and there were statistically significant differences between years and between basal fertilizer dressings. The other interactions were not statistically significant. Means within the main factors, followed by a different lower cast letter are statistically different (p < 0.05).
3.4 Deoxynivalenol contents and their correlation with grain-N and straw dry matter production
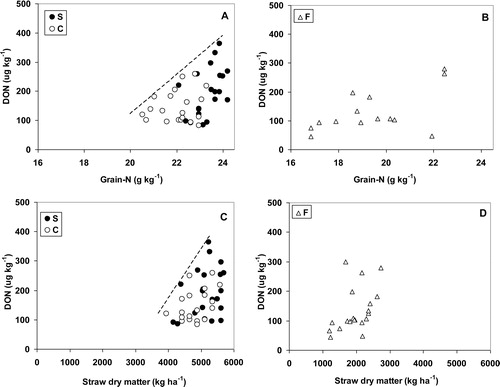
In 2006, positive, but multivariate correlations were found between the nitrogen and DON contents of the grain (A and B). The correlation was most pronounced for the site with systems S and C, partly because of the larger number of observations. If the correlation was divided up into three classes (grain-N <22, 22–23, >23 g kg−1) a Kruskal–Wallis one-way analysis of variance comparing medians showed significant differences (p = 0.024), indicating an increase in DON with increasing grain-N class. Dividing the data into smaller classes (grain-N <21, 21–21.5, 21.5–22, 22–22.5, 22.5–23, 23–23.5, 23.5–24, >24 g kg−1) and calculating the variance per class gave a significant increase (p = 0.017, r2 = 0.59) in variance with increasing grain-N class. A comparable correlation, at least in the systems S and C, was found when DON contents were plotted against straw dry matter production (C and D).
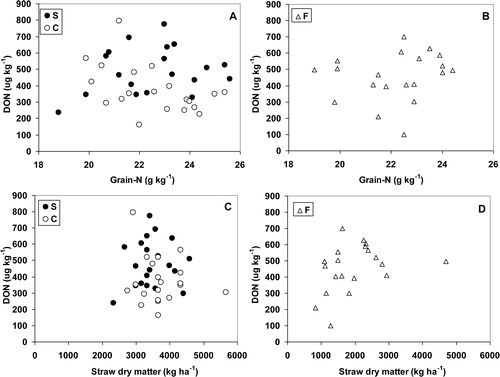
In 2007, the level of Fusarium infection was much higher and resulted in higher levels of DON. Furthermore, the variation in grain-nitrogen content and straw dry matter production was also greater though overall straw weights were lower than in 2006. In 2007, no clear correlations were found between grain-N contents and DON contents in the systems S and C, or in system F (A and B). There was no clear correlation either between straw dry matter production and DON content in the grain in the systems S and C, or in system F (C and D).
3.5 Weed infestation, grain-N and plant available N
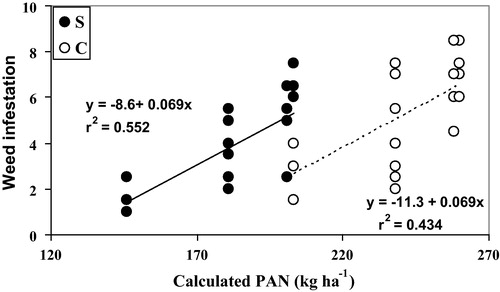
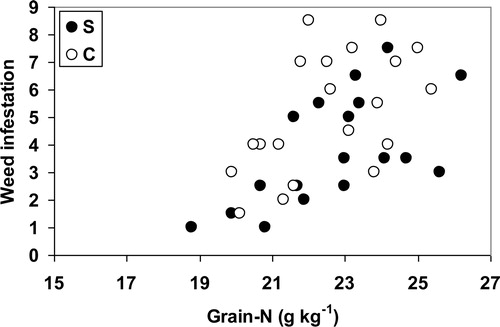
There was severe weed infestation in systems S and C. In both systems, significant correlations between calculated plant available N (PAN) and weed infestation were found (S: r2 = 0.55, p < 0.001; C: r2 = 0.44, p = 0.0015,). Overall, the slopes were comparable among systems resulting in parallel lines with weed infestation becoming approximately 1 unit higher per 15 kg additional calculated PAN, and intercepts of 124 kg N ha−1 vs. 163 kg N ha−1 for the S and C system, resepectively (). If weed infestation is plotted against grain-N content (), again a positive but multivariate correlation was found, indicating that while grain-N content increases with higher N rates, weed infestation increases concurrently, thus indicating that both the crop and the weed plants profited from the increase in PAN.
4 Discussion
In this study, the targeted modification of the basal fertilization regime to reduce PAN values for the S and C systems appears to have been effective. Moreover, the top-dressing treatments that were applied altered the calculated PAN successfully within each system. However, we found inconsistent effects of nitrogen application rates on Fusarium head blight (FHB) and deoxynivalenol (DON) contents in the grain. Although FHB increased slightly in both years with increasing nitrogen application rate at anthesis, DON contents only increased significantly with nitrogen application rate in 2006. Effects seemed independent of the type of nitrogen source used.
Looking in more detail at these results it appeared that in 2006, increases in grain-N content at the S and C sites could be accompanied by an increase in DON content, indicated by a higher but multivariate correlation with higher variance at higher levels of grain-N. Although the number of data points at the F site was limited, here a similarly shaped correlation seems apparent. The mechanism underlying the correlations in 2006 seems, at least partly, to be a more favourable microclimate within the crop, as was also suggested by Lemmens et al. [Citation10]. A comparable multivariate correlation was shown between straw dry matter production and DON content, suggesting that a denser canopy results in a more humid microclimate favouring fungal growth [Citation18].
An explanation for the difference between years can be that the general DON levels in 2007 were much higher than in 2006. This may suggest a general higher infection level in 2007. Possible causes include different fungal species in the two years, but also microclimatic differences during the flowering stage when infection occurs [Citation18] may have played a role, as was also reported by Mesterházi [Citation7]. If weather conditions are very humid, and hence favourable for Fusarium development, even an open crop canopy will not dry sufficiently to slow down Fusarium development. We therefore also expect that such conditions would not show clear effects of nitrogen application rates and canopies differing in density.
The weed infestation at sites S and C in 2007 provides a second explanation for the inconsistent results. Unfortunately, weed dry matter was not measured and therefore the effects of weeds on the uptake of PAN and their effect on the crop microclimate could not been taken into account. So the shape of the correlation between grain-N content and DON content in 2007 has been obscured by weed infestation.
Moreover, the shape of the correlation in 2006 itself tended to reduce the differences among means of the various nitrogen applications, as its variation increased with increasing DON levels. This may be a third explanation for inconsistent results concerning the effects of nitrogen application rates on DON contents described in the past [Citation10–Citation15].
The reason why we correlated DON content with grain-N is because farmers in the Netherlands fertilize their wheat with nitrogen aiming at increasing grain-N content. However, it seems that in some years there is a cost attached to this strategy. The significant differences in DON content of the grain among nitrogen application rates almost reached a factor of two (99.8–192.8 μg kg−1) but such differences were only found in the year with overall low DON contents. As mentioned above it is questionable whether effects of nitrogen application rate on DON content would be present under more favourable conditions for fungal growth. Farmers would benefit directly from strategies that could lower very high DON contents. In our experiments, none of the DON contents exceeded the maximum level set in legislation by the EU commission (1250 μg kg−1 [Citation4]). However, literature data show that our DON levels were not extremely low. Results of a large survey in the UK [Citation19] showed that 83% of the samples had less than 100 μg kg−1 DON, and another survey [Citation5] in which a large number of wheat samples was collected over a period of 5 successive years showed that only 0.4–5.5% of the samples exceeded 1250 μg kg−1. So it appears that DON levels higher than 1250 μg kg−1 occur only in extreme situations. The EU legislation on maximum DON contents is based on toxicological experiments with various animals, and it has been suggested that such results are difficult to extrapolate to other animals or humans, and that maximum levels may be too high [Citation20]. In some animals, small effects also seem to occur at low levels of DON [Citation21], and therefore a strategy to avoid high DON contents seems desirable. Other arguments supporting this view are that higher FHB infection levels influence the viability of the wheat seeds [Citation22] and should be avoided in wheat that is grown for its seed, for which protein content is clearly not important. The finding that top-dressing treatments only had small effects on yield provides some room for reducing FHB infection.
The larger variation in the correlation between DON content and grain-N content at higher DON levels was to be expected. Part of it was probably caused by variation in subsampling: the DON and grain-N contents themselves will tend to vary, and have done so in separate subsamples of the wheat harvested from each plot. Microclimatic differences and uneven inoculum densities within fields also may have been a factor although we tried to decrease this by using chopped maize stems and leaves as an inoculum source [Citation17]. Additionally, there is naturally occurring variation in seedling emergence: spatial variations in crop density will have resulted in spatial variations in microclimate. Temporal variation in emergence will have resulted in temporal variation in flowering, and hence in different weather conditions during the infection process. Unless selection by seed size is applied [Citation23], this source of variation seems inevitable, especially in organic agriculture where additional variation is present because seeds cannot be chemically disinfected. In conclusion, correlations between grain-N and DON contents will therefore always tend towards multivariate relations.
5 Conclusions and perspectives for crop management
In years with moderate levels of Fusarium head blight, topdressing nitrogen in wheat increases grain-N contents, but simultaneously increases deoxynivalenol contents, decreases seed viability and in crops with relatively open canopies promotes weed growth [Citation22,Citation24]. So nitrogen topdressing means a risk, and is not advised in wheat crops.
Acknowledgement
The authors gratefully acknowledge funding from the European Community financial participation under the Sixth Framework Programme for Research, Technological Development and Demonstration Activities, for the Integrated Project QUALITYLOWINPUTFOOD, FP6-FOOD-CT-2003-506358.
Related Research Data
References
- D.W.ParryP.JenkinsonL.McLeodFusarium ear blight (scab) in small grain cereals: a reviewPlant Pathol.441995207238
- J.P.F.D’MelloC.M.PlacintaA.M.C.MacdonaldFusarium mycotoxins: a review of global implications for animal health, welfare and productivityAnim. Feed Sci. Technol.801999183205
- M.PeraicaB.RadićA.LucićM.PavlovićToxic effects if mycotoxins in humansBull. World Health Org.771999754766
- Commission Regulation (EC) No. 1881/2006 setting maximum levels of certain contaminants in foodstuffsOff. J. Eur. UnionL3642006524
- S.G.EdwardsFusarium mycotoxin content of UK organic and conventional wheatFood Add. Contam.262009496506
- H.HestbjergG.FeldingS.ElmholtFusarium culmorum infection of barley seedlings: correlation between aggressiveness and deoxynivalenol contentJ. Phytopathol.15020022002308312
- A.MesterháziRole of deoxynivalenol in aggressiveness of Fusarium graminearum and F. culmorum and in resistance to Fusarium head blightEur. J. Plant Pathol.1082002675684
- T.MiedanerB.SchneiderH.H.GeigerDeoxynivalenol (DON) content and Fusarium head blight resistance in segregating populations of winter rye and winter wheatCrop Sci.432003519526
- F.WildeT.MiedanerSelection for Fusarium head blight resistance in early generations reduces the deoxynivalenol (DON) content in grain of winter and spring wheatPlant Breed.12520069698
- M.LemmensK.HaimH.LewP.RuckenbauerThe effect of fertilization on Fusarium head blight development and deoxinivalenol contamination in wheatJ. Phytopathol.152200418
- G.MilevT.K.TonevV.KiryakovaInfluence of some agronomy factors on spike components after rare incidence of Fusarium head blight epiphytoty of winter wheat. II. Effect of post-harvest residue incorporation,Bulg. J. Agric. Sci.142008410416
- K.D.SubediB.L.MaA.G.XuePlanting date and nitrogen effects on FHB and leaf spotting diseases in spring wheatAgron. J.992007113121
- D.PageauJ.LafondJ.LajeunesseM.E.SavardImpact du précédent cultural et de la ferilization azotée sur la teneur on dèsoxynivalénol chez l’orgeCan. J. Plant Pathol.302008397403
- M.VáňováK.KlemP.MíšaP.MatušinskyJ.HajšlováK.LancováThe content of Fusarium mycotoxins, grain yield and quality of winter wheat cultivars under organic and conventional cropping systemsPlant Soil Environ.542008395402
- M.YoshidaT.NakajimaT.TonookaEffect of nitrogen application at anthesis on FHB and mycotoxin accumulation in breadmaking wheat in the western part of JapanJ. Gen. Plant Pathol.742008355363
- G.J.H.M.van der BurgtG.J.M.OomenA.S.J.HabetsW.A.H.RossingThe NDICEA model: a tool to improve nitrogen use efficiency in cropping systemsNutr. Cycl. Agroecosyst.742006275294
- A.MesterháziA comparitive analysis of artificial inoculation methods with Fusarium spp. on winter wheat varietiesPhytopathol. Z.9319781225
- L.E.OsborneJ.M.SteinEpidemiology of Fusarium head blight on small grain cerealsInt. J. Food Microbiol.1192007103108
- S.MacDonaldT.J.PrickettK.B.WildeyD.ChanSurvey of ochratoxin A and deoxynivalenol in stored grains from the 1999 harvest in the UKFood Add. Contam.212004172181
- E.E.CreppyUpdate of survey, regulation and toxic effects of mycotoxins in Europe,Toxicol. Lett.12720021928
- J.J.PestkaA.T.SmolinskiDeoxynivalenol: toxicology and potential effects on humansJ. Toxicol. Environ. Health820053969
- B.G.H.TimmermansA.M.OsmanG.J.H.M.van der BurgtDifferences between spring wheat cultivar s in tolerance to Fusarium seedling blight under organic field conditionsEur. J. Plant Pathol.12532009377386
- G.P.LafondR.J.BakerEffects of genotype and seed size on speed of emergence and seedling vigour in nine spring wheat cultivarsCrop Sci.261986341346
- J.WeinerH.W.GriepentrogL.KristensenSuppression of weeds by spring wheat Triticum aestivum increases with crop density and spatial uniformityJ. Appl. Ecol.382001784790