
 ?Mathematical formulae have been encoded as MathML and are displayed in this HTML version using MathJax in order to improve their display. Uncheck the box to turn MathJax off. This feature requires Javascript. Click on a formula to zoom.
Abstract
Designing
a food supply chain for a completely new product involves many stakeholders and knowledge from disciplines in natural and social sciences. This paper describes how Multi Criteria Decision Making (MCDM) facilitated designing a food supply chain in a case of Novel Protein Foods. It made the procedure transparent and aided the evaluation of alternatives. Two models, namely the Multi Attribute Value Theory (MAVT) and the Analytic Hierarchy Process (AHP), were used, due to the ease with which they handle a mix of quantitative and qualitative information, quantify the qualitative information and generate an overall value for each alternative. The resulting preference order differed mainly due to the manner in which criteria weights were elicited, alternatives scored and the use of scales in MAVT versus the pairwise comparison in AHP. However, the preference order of the top criteria with both methods was the same and weights were similar.
1 Introduction
Introducing a new product and designing its potential supply chain (SC) involve information from various fields and several stakeholders and experts. Most literature on food supply chain design aims at improving existing supply chains and not at the complete design of a new supply network. The background of our research is a large study on the introduction of a non-meat protein source to partially replace meat products in the diets of the Dutch consumers [Citation1]. The study was confronted with a gap in literature on designing a completely new food supply chain. This paper introduces and investigates a methodology to approach this issue. The methodology is first embedded in the literature on supply chain design in general and Multi Criteria Decision Making (MCDM) in particular. This is followed by elaborating the approach for the new non-meat protein food.
Traditionally, SC management refers to managing a SC to meet end-customer needs through product availability and responsiveness, on-time delivery etc. [2–6Citation[2] Citation[3] Citation[4] Citation[5] Citation[6]]. The SC starts at the supplier and ends at the retailer or the consumer and costs are minimised over links of the chain. However, when a food supply chain (FSC) is considered, the chain starts a few links earlier, i.e. at the primary production of the raw ingredients and goes all the way through to the consumer [Citation7,Citation8]. Another characteristic of a FSC is that the attributes of the product important to the consumer (e.g., taste, texture, nutritional level), are a result of the SC decisions in each link. These attributes influence the success of the product. FSC design should focus on product attributes by looking at the FSC backwards, from consumer through to primary production [Citation7,Citation9].
Systematic design of a FSC involves many aspects including potential chain design and evaluation, selection of attributes and identification of variables. The problem has qualitative and quantitative elements; the decision space is discrete and conflicting criteria have to be considered simultaneously. The criteria are hybrid in nature [10–12Citation[10] Citation[11] Citation[12]], the number of alternatives is large and there are multiple stakeholders. Thus a decision making aid like MCDM is ideal for a problem of this genre. MCDM models handle qualitative data well. These models do not try to compute an optimal solution. Instead, many alternatives are proposed or generated and the decision maker (DM) ranks them with respect to the criteria (attributes). There is no objective statement and therefore there are no trade-offs in the traditional sense as each criterion is ranked according to its importance to the DM [Citation11]. An inherent property about decision making is subjectivity. MCDM does not dispel this but makes the process of making such decisions transparent [Citation10].
The question is how MCDM can be an aid in a large multidisciplinary research project that includes researchers from various disciplines and stakeholders from industry. To respond to this question, we go over the various steps that have been taken and report on the lessons learned. Numerous models are proposed for valuating alternatives in MCDM. Of them we investigated the Multi Attribute Value Theory (MAVT) and the so-called Analytic Hierarchy Process (AHP). These methods mainly differ in the way criteria are treated and in the use of partial value functions in the former and pairwise comparisons in the latter. Other methods are, for instance, goal programming and ELECTRE [Citation10]. Goal programming relies on quantitative data only and was therefore not applicable in this case. ELECTRE requires more interaction with stakeholders and DMs than was possible in this case.
Below we first sketch what the theory of MCDM teaches us to do, after which it is reported how this was elaborated for the specific case of designing a FCS. Next the results of the two models used, namely AHP and MAVT, are compared followed by the evaluation of the robustness of the conclusions with respect to varying circumstances in a sensitivity analysis. Finally, lessons learnt from this experiment on applying MCDM in a large supply chain design case are presented.
2 The MCDM approach
Some basic steps are common to all MCDM approaches [Citation10,Citation12] and can be divided into three phases, namely (a) identification of the problem, (b) building the model and (c) developing action plans ().
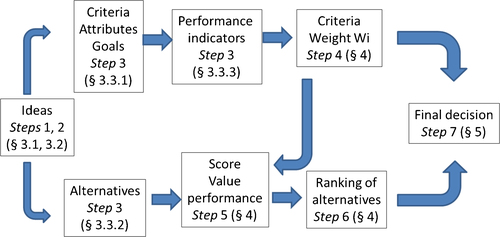
The general terminology in MCDM includes the following concepts:
| • | Options/alternatives: choices to be made, e.g. where to buy a house. | ||||
| • | Criteria: goals, attributes or objectives that the DM wants to achieve. They are what the DM uses to evaluate the alternatives. These can be directly measurable e.g. cost of the house, or indirectly measurable, e.g. the location of the property. In the latter case, a criterion needs to be formulated to measure performance. | ||||
| • | Criteria weights: represent the relative importance of each criterion. | ||||
| • | Scores/value: alternatives are evaluated with respect to each criterion and scores are assigned to each alternative. Usually the scores have no units; the evaluation method depends on the MCDM model being used. | ||||
| • | Ranking: after weights and scores are obtained, the alternatives are graded with respect to all criteria simultaneously. | ||||
This paper assesses the application of the MAVT and the AHP approach to evaluate alternatives.
3 The novel protein food case
This section describes how the MCDM approach () was elaborated for the novel protein food case. The case material was collected in the framework of PROFETAS [Citation1]. This project concerned the conversion towards non-meat protein sources in the daily meal in The Netherlands and ran during the years 1999-2006. One of the tenets of the PROFETAS project was that non-meat protein products currently on the market do not meet expectations of most consumers and cannot yet be considered realistic substitutes to meat. Hence, the prospects for replacing meat-derived ingredients by non-meat ingredients, so-called Novel Protein Foods (NPF), was investigated.
3.1 Identification of the problem
The DMs in this project were food technologists, environmental scientists and economists; in total about 50 researchers. When we use the term stakeholders, this also includes representatives from industry who showed their interest in the outcomes of the study. Issues that arose during brainstorming sessions with the participants were:
| • | Current food production and consumption patterns have a huge impact on the environment and natural resources | ||||
| • | Meat production is not appealing from an environmental point of view because of, e.g., the inefficient conversion of protein in feed into protein in slaughtered animals, manure generation and amount of water use | ||||
| • | A shift to a completely vegetarian diet is not a sensible suggestion | ||||
| • | Pork meat is popular in the Netherlands | ||||
| • | A possible vegetable source to partially replace pork is dry green peas; peas are popular in the Netherlands, grown locally and expertise is readily available | ||||
| • | Non-meat protein products presently on the market do not meet expectations of most consumers and thus cannot be considered realistic substitutes to meat; there are problems with texture and taste of products and they are expensive compared to pork | ||||
3.2 Idea generation
The main outcomes of the idea generation process were:
| • | A feasibility study should be conducted and target a replacement of 20% of processed pork products by the year 2020 [Citation1,Citation13] | ||||
| • | Developing a new product with good texture has priority | ||||
| • | The new product must be more environmentally friendly than pork meat | ||||
| • | The entire supply chain has to be taken into account | ||||
3.3 Model building - determining relevant criteria and alternatives
3.3.1 The model values
The overall goal was to make a ‘good’ meat substitute, thereby focussing on a good taste and texture, competitive pricing and environmental impact. The chain study concentrated on product attributes rather than on delivery of the product. This implied that goals/criteria of good quality, environmental and economic sustainability [Citation7] should be taken into account while designing the chain. According to the requirements in Belton and Stewart [Citation9], these criteria were found to be relevant, understandable and independent of each other. However, they were not directly measurable. Goals were further defined and criteria chosen as follows:
| • | Economic sustainability: cost to manufacture the product [Citation7] | ||||
| • | Environmental sustainability: exergy input required [Citation14] | ||||
| • | Product quality: texture, absence of undesirable flavours, nutritional level | ||||
3.3.2 Generation of alternatives
The generation of alternatives requires a complete understanding of the problem at hand and its surrounding situation as well as a great deal of creativity and imagination [Citation15]. Alternatives represent different choices available to the DMs. In our case, alternatives were potential chain designs, i.e. combinations of links and transport modes. Two factors have to be taken into account when designing FCSs:
| • | A consumer-oriented approach, so starting from the consumer demands and going back, in case of a food product, to the production of raw materials [Citation16] | ||||
| • | A proper demarcation of the boundaries of the system, i.e. defining what constitutes the primary chain and what inputs will be considered | ||||
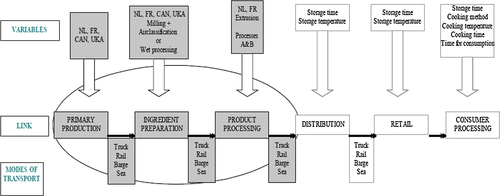
Brainstorming sessions with the food designers and logistics researchers in the project resulted in an overview of variables and links in a FSC for NPFs. Alternatives for the SC design are combinations of choices for the control variables, i.e. transport modes, locations for production, preparation and processing plants, processing methods, storage time and temperature and aspects of consumer processing. The variables in are the result of brainstorming sessions with the food designers and logistics researchers in the project. The variables depicted in grey were selected after screening. This screening process is described in the following section.
3.3.3 The screening process
Results of further sessions to screen variables are presented in . Strategies used to discard variables were:
| • | A variable will be discarded if it does not affect one of the three criteria, i.e. cost, environmental sustainability and product quality | ||||
| • | Commonly used farming and industrial practices are considered, e.g. peas are almost always harvested at 11% moisture | ||||
| • | If a variable cannot differentiate between alternatives, it is discarded | ||||
Table 1 Results of screening strategies: effect of variables on criteria.
Choice of location is the only variable with respect to primary production to affect cost and environmental impact (). The choice for a certain pea variety and inoculation do not significantly change the cost of the end product. Maturity of the pea is not a variable as it was decided to use peas harvested at 11% moisture. Solar energy and application of fertilizers depend on location, so are not included separately. Quality, as specified earlier, refers only to texture, absence of components that cause undesirable flavours and nutritional composition of the end product.
Work done by O’Kane [Citation17] shows that gelation of pure pea protein solutions is affected by the ratio of proteins, legumin and vicilin present in pea. The texture of gels obtained and rate of formation would therefore also be affected. However, the effect of the ratio of proteins on texture and gelation of real food systems is not known yet. Therefore, influence of varieties and breeding was not considered.
Location alternatives for distribution and retail were not considered since the project was aimed at the Dutch market. Therefore, after the NPF is made, all products that enter the distribution channel are handled in a similar manner. The quantity of the product was estimated at about 30,000 MT per annum, which is not sufficient to warrant a separate distribution network. The product therefore will be incorporated into existing networks of retail companies. So, variables with respect to the distribution of the NPF affect the criteria, but all products are influenced to the same extent.
3.3.4 Final selection of alternatives
After careful deliberation 11 alternative FSC designs were selected ().
| • | The following locations for primary production were chosen:
| ||||||||||||||||||||||||||||
| • | The processing locations are the same as those for primary production | ||||||||||||||||||||||||||||
| • | Ingredient preparation. The main processing step is the concentration of pea flour. The industry uses two methods, air classification and wet extraction, to make pea concentrates and pea isolates. Both methods have been included. | ||||||||||||||||||||||||||||
| • | Product processing. Three methods were evaluated, (1) air classification + extrusion, (2) specialised processing A and (3) specialised processing B (for details see the underlying PhD thesis [Citation19]). | ||||||||||||||||||||||||||||
Table 2 The alternative FSCs after screening.
4 Evaluation of alternatives by the MAVT and the AHP method
The next steps of the selection of the best alternative depend on the type of MCDM model. The Multi Attribute Value theory (MAVT) and Analytic Hierarchy Process (AHP) models were applied to this case. We first discuss how the next steps have been elaborated for the MAVT method and then for the AHP method. This is followed by a comparison of results in Section 5.
4.1 MAVT method
4.1.1 Determining relative importance of criteria
As in most multi-criteria decision problems, the considered criteria are not of equal importance to DMs- i.e. they do not have the same weight. Therefore the relative importance of criteria must be set. Three top-level criteria of cost, quality and environmental impact were weighted according to the so-called swing method [Citation10] by a panel consisting of food technologists, social scientists, environmentalists and engineers. The outcomes for the three criteria were as follows:
| • | Costs for the manufacture of the NPF were taken from an earlier study [Citation13] and ranged from €215 - €610 per MT over 11 alternatives. | ||||
| • | Data on environmental impact were available from an exergy study [Citation14] providing the exergy input for each alternative, which ranged from approximately 14,000 MJ/MT (mega joule per metric ton) to 34,000 MJ/MT over the 11 alternatives. Raw data of costs and exergy input for each alternative were converted to partial value scales; a score of 100 represents the cheapest cost alternative and lowest exergy requiring alternative. | ||||
| • | Quality of the end product was defined by consumer research and brainstorming sessions with the food scientists of the project to be nutritional value, texture and absence of undesirable flavours (sub-attributes/criteria). Nutritional value was further subdivided into the following: amino acid availability, anti-nutritional factor (ANF) level and natural fibre content.
| ||||||||||||||||||||||
In the MAVT, panellists were asked to consider how the so-called swing from 0 to 100 on one preference scale compared to the 0 to 100 swing on another scale. Panellists first ordered criteria and then assigned weights (). Data on weights and orders were used to calculate the normalised weights and the average. shows that panellists 1, 2 and 3 have similar preferences with regard to the order of the criteria, but differ greatly on the relative importance of criteria. Panellist 4 ranked environmental impact as the most important criterion, but the relative difference between criteria is small in his case. This highlights that opinions and bias of DMs can exist and possibly influence the final ranking of alternatives.
Table 3 Top criteria weights for NPF elicited via swing method.
The swing method was also used to elicit weights for quality sub-criteria. gives normalised weights calculated from responses elicited from experts (similar to ). Three of four experts ranked texture as the most significant sub-criterion. The fourth expert ranked texture and absence of off flavours at the same level.
Table 4 Quality sub-criteria weights for NPF elicited via the swing method.
4.1.2 Determining the impact of alternatives on criteria (scoring)
4.1.2.1 Scoring alternatives for quality
The quality of the end product from each alternative was the result of the processing method used to make it. A qualitative scale was used to score product quality. Each sub-attribute was scored by experts from various areas of food science (the same as those used in ) as: good (10 points), acceptable (5 points), and bad (zero points), see . The weighted score was calculated by multiplying the numerical score elicited from panellists with criteria weights (). The weighted score thus takes the relative importance of quality sub-attributes into account.
Table 5 Weighted scores of alternatives for quality with the MAVT method.
4.1.2.2 Scoring alternatives for cost
To ensure economies of scale, 30,744 MT per annum was estimated by the PROFETAS project as the demand for the NPF in the Netherlands. Cost of manufacture (ex-factory) of NPFs was calculated for each alternative (). The bisection method [Citation10] was used to scale this cost data onto a partial value scale where the value of the cost is non-linearly related to the hard data (). This function decreases monotonically and is non-linear. A global and local scale were used to present two different viewpoints and study how different scales would affect the final ranking of alternatives.
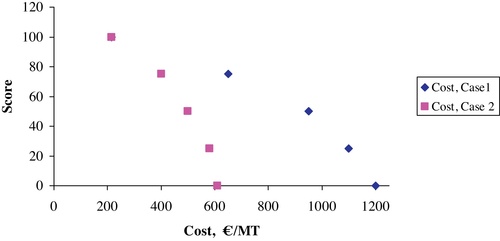
Table 6 Score for cost in €/MT (C score) for global and local scale and environmental impact in Exergy input (EI) in MJ/MT with the MAVT method.
The global scale uses the end points as worst and best possibility. The NPF should ultimately replace pork meat; therefore the worst cost option is a cost of manufacture more than that of pork mincemeat. ‘0′ represents this worst cost option, i.e. €1200 per MT. The ‘100′ on the scale represents the ‘best’ price that was achieved in this exercise. The partial value function in , case 1 was derived with the bisection method and used to calculate scores for all alternatives. A score of 50 represents a cost of €950, 75 represents €650 and 25 represents €1100. In the local scale, the ‘0′ represents the worst cost option- i.e. the cost of manufacture of the most expensive alternative, €609 per MT and the ‘100′ represents the ‘best’ price that is achievable i.e. the cheapest alternative. Bisection provides the partial value function(1)
(1)
(, case 2); a score of 50 represents a cost of €500, 75 represents €400 and 25 represents €580. gives the scores for both cases.
4.1.2.3 Scoring of alternatives for environmental impact (exergy input)
Environmental impact was measured as exergy input required to produce an alternative according to [Citation14]. The requirement per ton is shown in and is converted to a partial value scale using a partial value function. The linear partial value function(2)
(2) decreases monotonically providing the partial value scores ().
4.1.3 Processing values to arrive at a ranking for alternatives
The additive model was used to calculate the total score value V(A) of alternative A.(3)
(3) where w
i
is the weight of criterion i and v
i
(A) is the partial value of alternative A for criterion i. Used criteria weights are averages from . Cost was scored using two different scales (global and local) to investigate how scale affects the final ranking of alternatives. shows the resulting scores, criteria weights and the value V(A) of each alternative.
Table 7 Valuing alternatives via MAVT using the global and local scale.
ranks the alternatives; the highest value gets rank ‘1’and the same value V is ranked the same. The preference order in the two cases is not the same because of different scales that were used. Alternative 4 is expensive (€570/MT) compared to other alternatives, but is cheap compared to cost of pork mincemeat (€1200/MT). Therefore, with the global scale, this alternative scores 87 for cost giving it an overall value of 81, whereas on the local scale, it scores only 17 for cost, resulting in an overall value of 57. Alternative 4 therefore goes from rank 1 in the first case to rank 5 in the second case. Similarly, alternative 8 falls from rank 3 to rank 7. This large difference in ranking emphasises the importance of the selection of the scale and fixing end points. Notice that alternative 11 also loses score on cost, but remains the best alternative.
4.2 AHP method
4.2.1 Determining relative importance of criteria
The AHP method applies a so-called pair-wise comparison method. In the NPF case, the three top-level criteria were evaluated by the same panel as in the swing method. Normalised weights of pair-wise comparison were derived according to that method. shows the elicited weights. The same panel was used to compare the 5 sub-criteria. It is interesting that the comparisons of panellists 4 and 5 appeared inconsistent such that they could not be used in the determination of weights. Inconsistency can occur even when experts in the field give their preferences, as people are not always able to convert opinions into numbers easily. shows the hierarchy of criteria and elicited weights.
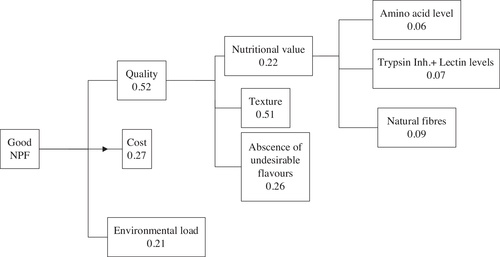
Table 8 Normalised top criteria weights for NPF via the AHP method.
4.2.2 Determining impact of alternatives on criteria (scoring)
4.2.2.1 Scoring of alternatives for quality
The score for quality of the alternatives follows from multiplying the weight of quality attributes by the score (obtained by pair-wise comparison). The quality of the NPF for each of the three processing methods was scored. Alternatives 1, 2, 3, 5, 6 and 9 follow the same process and score 17, alternatives 4 and 8 follow another process and score 51 and finally alternatives 7, 10 and 11 score 32.
4.2.2.2 Scoring of alternatives for cost
To work in a practical way with the pairwise comparison, the cost of manufacture was divided into ranges i.e. 200-300, 300-400, ….>600, where 200-300 implies a cost from € 200 to € 300. The result of the pair-wise comparison and derived weights is given in . The final scores of the alternatives are provided in .
Table 9 Preferences for cost ranges.
Table 10 AHP cost and environmental impact scores.
4.2.2.3 Scoring of alternatives for environmental impact (exergy input)
Instead of applying the pairwise comparison of ranges of the requirement per ton (), a linear scale was used in this case to score the environmental impact; due to the low weight on environmental impact, we do not expect that pairwise comparison would provide another ranking of alternatives.
4.2.3 Processing values to arrive at a ranking for alternatives
The additive model (Equation 1) is used to calculate overall values V(A) using the criteria weights from . summarises the scores, criteria weights and the value, V(A) of each alternative. Alternatives 4 and 8 are ranked the highest, because they give an end product with a very good quality and quality has a high weight. The weight and score of quality are high enough to compensate for a low score for cost (0.07). Alternative 1 has a high score for cost and a medium score for environmental impact, but the poor quality pulls it down in the ranking. The importance of criteria weights can easily be seen here.
Table 11 Value of alternatives via the AHP method.
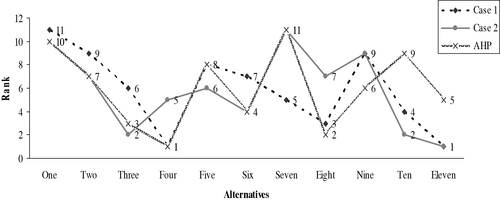
5 Discussion
The final ranking of alternatives with the two methods is not the same (). Even using the MAVT method with a global or local scale leads to another ranking of alternatives; different scaling and scoring methods result in different criteria weights and scores. This can be seen clearly in the scores for quality. The MAVT method uses a qualitative scale; processes A and B had almost similar scores of 71 and 70. In contrast, the pairwise comparison method of the AHP differentiates the end product quality from process A and B much more (scores of 51 and 32, respectively).
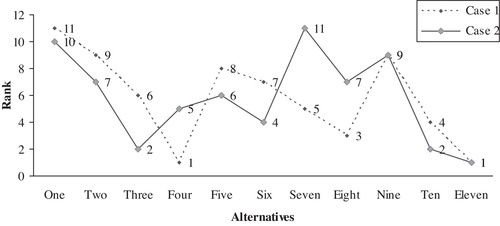
The data from MAVT using the local scale was analysed to examine sensitivity of the overall preference order to criteria weights and preferences of panellists. Criteria weights were varied from 0 to 1 to observe changes. This analysis was carried out with Microsoft Excel and web hipre [Citation20]. More results can be found in the PhD thesis by Apaiah [Citation21]. Here we focus on sensitivity to panellist preferences. Ranking of alternatives for both scales was done with average criteria weights, like the ones in . However, weights or preferences of individual panellists vary. If individual weights are used instead of the average, preference orders change. We are interested in the difference in preference ordering. shows alternatives ordered from best to worst using average values and compares preference orders from each panellist to this. In our study the number of panellists was restricted, and therefore their opinions have a strong impact on the results. This is okay as long as the interviewed panellists properly represent the stakeholders. Assuring adequate stakeholder representation is therefore a critical step in the proper execution of this research approach.
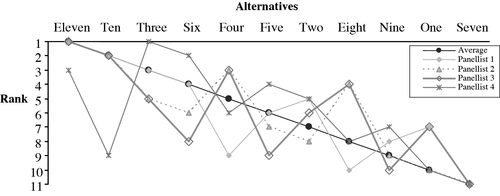
Results from this graph correspond to those of the sensitivity analysis performed earlier. Panellist 4 weighted quality at 0.27. According to earlier sensitivity analysis of preference order to quality weight, any weight more than 0.4 results in alternative 11 being the best. Below this value, alternative 3 gets rank 1.
MCDM gives recommendations to the DMs (). It is then up to them to look at the preference orders and make their final choice. Using a global cost scale in the MAVT method, alternatives 4 and 11 have the same overall value.
Table 12 The three highest ranked alternatives Table Footnote a
However, each alternative scored differently on the three criteria. The quality of alternative 4 was better than of alternative 11, but alternative 4 was more expensive and exergy intensive compared to alternative 11. The picture is clear and therefore the DMs can choose which supply chain (alternative 4 or 11) they would like to implement or they can opt to study the two alternatives in greater detail.
For the MAVT method, the local scale differentiated the alternatives to a greater extent and therefore the overall value of each alternative changed. As alternative 4 was more expensive compared to alternative 11, it scored lower and alternative 11 was ranked the highest. The AHP model ranked alternative 4 as the highest followed by alternative 8.
6 Conclusions
The aim of this paper was to investigate how the general model of MCDM may help in the design of a FSC with a multi-disciplinary team. We feel that the stepwise procedure made the method transparent for the DMs and the analysts, and aided in evaluation of screened alternatives. Generation of ideas helped to make goals concrete. Whereas the overall goal was to make an NPF that consumers want to buy, structuring of ideas gave a concrete list of attributes for the product by which the goal could be reached. The whole chain of the product, from primary production of ingredients to distribution and retailing of the product, was studied in detail [Citation7]. The SC consisted of five links. Each of these links contained variables that influenced the attribute values of the end product. Potential SCs (alternatives) to achieve a desired end product were a combination of values for these variables. An infinite number of possibilities existed at this stage. Screening strategies were developed to narrow possibilities. An important strategy was that if a variable or link did not differentiate between alternatives, it had to be discarded.
For the ranking of alternatives, the methods MAVT and AHP were chosen due to their ease to handle a mix of quantitative and qualitative information, quantify the qualitative information and generate an overall value for each alternative. The preference order generated with the two models was very different. The main reason for this difference is the manner in which criteria weights were elicited and alternatives scored, as well as the use of scales in MAVT versus the pairwise comparison in the AHP model. It is interesting to note though, that the preference order of the top criteria with both methods was the same and the weights were also similar.
Overall, the methodology was successful in focussing DMs attention on the issues at hand. The ideas generated were made concrete and the path to final choices was clear. The stepwise process made the decision making process transparent and easy to review and audit.
Acknowledgements
This research was supported by the Dutch Technology Foundation STW, applied science division of NWO, and the technology programme of the Ministry of Economic Affairs. This paper has been supported by the Spanish state, project TIN2012-37483-C03-01.
Related Research Data
References
- http://www.profetas.nl/
- B.M. Beamon Supply chain design and analysis: models and methods International Journal of Production Economics 55 1998 281 294
- J.G.A.G. van der Vorst A.J.M. Beulens P. van Beek Modelling and simulating multi-echelon food systems European Journal of Operational Research 122 1999 354 366
- G. Wang S.H. Huang J.P. Dismukes Product-driven supply chain selection using integrated multi-criteria decision making methodology International Journal of Production Economics 91 2004 1 15
- S. Chopra P. Meindl Supply Chain Management: Strategy, Planning, and Operation 5th edition 2012 Pearson Education, Inc New Jersey 528
- C. Cordón K. Sundtoft Hald R.W. Seifert Strategic Supply Chain Management 2012 Routledge New York 278
- R.K. Apaiah E.M.T. Hendrix G. Meerdink A.R. Linnemann Qualitative methodology for efficient food chain design Trends in Food Science and Technology 16 2005 204 214
- J.K. Gigler E.M.T. Hendrix R.A. Heesen V.G.W. van den Hazelkamp G. Meerdink On optimization of agricultural supply chains by dynamic programming European Journal of Operational Research 139 2002 613 625
- V. Belton T.J. Stewart Multiple Criteria Decision Analysis - An Integrated Approach 2002 Kluwer Academic Publishers Dordrecht 372
- J. Zak, H., Wlodarczak, M. Kicinski, The mcdm based redesign of the distribution system, Proceedings of The 13th Mini-EURO Conference and the 9th Meeting of the EURO Working Group on Transportation, 2002. Available at: <http://www.iasi.cnr.it/ewgt/13conferencePROC.html, paper 120>.
- M. Grunow J.G.A.J. van der Vorst Food production and supply chain management OR Spectrum 32 2010 861 862
- E. Triantaphyllou Multi-Criteria Decision Making Methods - A comparative study 2000 Kluwer Academic Publishers Dordrecht 288
- R.K. Apaiah E.M.T. Hendrix Design of a supply chain network for pea-based novel protein foods Journal of Food Engineering 70 2005 383 391
- K.R. Apaiah A.R. Linnemann H.J. van der Kooi Exergy analysis: a tool to study the sustainability of food supply chains Food Research International 39 2006 1 11
- W.E. Walker Generating and screening alternatives H.J. Miser E.S. Quade Handbook of systems analysis - craft issues and procedural choices 1998 Wiley New York 215 244
- A.R. Linnemann M. Benner R. Verkerk M.A.J.S. van Boekel Consumer-driven food product development Trends in Food Science and Technology 17 2006 184 190
- F.E. O’Kane, Molecular characterisation and heat-induced gelation of pea vicilin and legumin, PhD thesis, Wageningen University, Wageningen, 2004. Available at: http://edepot.wur.nl/40538.
- http://www.researchandmarkets.com/
- http://www.cerc.gouv.fr/
- http://www.hipre.hut.fi/
- K.R. Apaiah Designing food supply chains- a structured methodology: A case on Novel Protein Foods, PhD thesis, Wageningen University, Wageningen, 2006. Available at: http://edepot.wur.nl/121798.