
Abstract
The “New Statistics” emphasizes effect sizes, confidence intervals, meta-analysis, and the use of Open Science practices. We present three specific ways in which a New Statistics approach can help improve scientific practice: by reducing overconfidence in small samples, by reducing confirmation bias, and by fostering more cautious judgments of consistency. We illustrate these points through consideration of the literature on oxytocin and human trust, a research area that typifies some of the endemic problems that arise with poor statistical practice.
Scientists try to discern general laws from limited data. A key tool in this effort is inferential statistics—the techniques that help leverage the information obtained from a sample to make reasonable conclusions about the world at large. Surprisingly, many scientists are not using this critical tool well. In some fields, inferential statistics are frequently misunderstood and misused, leading to erroneous conclusions, unreplicable research, and tremendous waste.
Solving this problem is difficult. The statistical issues faced by scientists are complex and domain-specific, so even though there are some clearly wrong practices being used, there is no one” right” way that can cure all statistical ills. Still, we can and must do more to develop practices that will less frequently lead to error.
In this spirit, we advocate use of a “New Statistics”—a simple and fairly generalizable set of principles for making inferences from data that we think can have a positive impact across many disciplines. Specifically, we think that scientists analyzing data should:
Ask quantitative questions and give quantitative answers.
Countenance uncertainty in all statistical conclusions, seeking ways to quantify, visualize, and interpret the potential for error (there are multiple ways to do this, including frequentist confidence intervals and Bayesian credible intervals).
Seek replication, and use quantitative methods to synthesize across data sets as a matter of course (there are multiple ways to do this, including meta-analysis and the use of informed priors for Bayesian analyses).
Use Open Science practices to enhance the trustworthiness of research results.
There is nothing new about these recommendations (e.g. Maxwell et al. Citation2008; Smithson Citation2002); we have dubbed this a “New Statistics” approach because widespread adoption would be novel for many fields of inquiry. Another good name is the “Estimation Approach”.
Currently, many scientists approach inference very differently (Chavalarias et al. Citation2016); they are trained in what is called null-hypothesis significance testing (NHST). In this tradition, complex studies are summarized primarily by a series of p-values, and these are then used to make categorical judgments (e.g. “This drug works” or “This drug doesn’t work”), usually with little to no attention to the magnitude of the effect (to what extent does the drug work?) or to uncertainty in generalizing from the sample (how misleading might these results be?).
In this article, we illustrate ways in which the New Statistics approach is better than the dominant NHST tradition. The fault, we argue, is not in p-values, but in ourselves1. Human cognition is subject to many biases and shortcomings. We believe the NHST approach exacerbates some of these failings, making it more likely that researchers will make overconfident and biased conclusions from data. The New Statistics approach, on the other hand, focuses the researcher’s attention on uncertainty to help push back against these tendencies; we believe this helps foster more cautious and even-handed conclusions. In this paper, we illustrate three specific ways in which we think the New Statistics approach can be beneficial: by reducing overconfidence in small samples, by reducing confirmation bias, and by fostering more cautious judgments of consistency. We then consider some common objections to this approach and some of the important cautions in moving forward with reforms toward better inference.
To help illustrate the benefits of the New Statistics approach, we review literature that has examined the effect of the neurohormone oxytocin on human trust. Like many other areas of preclinical research, there has been a growing awareness that the literature on oxytocin and human trust may be unreliable. We choose to focus on this literature because it provides a particularly clear case of problems that are endemic across many research domains that depend on NHST.
1 The New Statistics Approach Can Help Reduce Overconfidence in Small Samples
Samples can provide useful information about the world at large. Mathematically speaking, we know that larger samples provide more certain information, whereas smaller samples provide less certain information (assuming all else is equal). In practice, though, humans often show undue confidence in conclusions drawn from small samples (e.g. Tversky and Kahneman Citation1971; this has been ironically dubbed the “law” of small numbers, but a better name is the fallacy of hasty generalization). The New Statistics seeks to mitigate this problem by making uncertainty salient. The use of p-values, on the other hand, seems to exacerbate overconfidence in small samples.
As an example, consider a study by Kosfeld et al. (Citation2005) examining the influence of the neurohormone oxytocin on social behavior in humans. In this experiment, 58 participants were assigned to receive an intranasal dose of either oxytocin or placebo. Next, all participants played an economic trust game. Kosfeld et al. (Citation2005) used the NHST approach to analyze the data, reporting that oxytocin had a statistically significant effect on trust (Mann–Whitney U = 301, p = 0.029 one-sided, ). From this (and the fact that oxytocin did not seem to influence performance on a control task) the researchers made a categorical and unequivocal claim: “Oxytocin increases trust in humans”. This claim was perceived by other scientists as well-founded: Kosfeld et al. (Citation2005) was published in Nature and has now been cited over 3000 times (according to Google Scholar).
Fig. 1 Two ways of looking at the same data. This figure compares the NHST approach (A) and the New Statistics approach to visualizing the same data (B). The data is from Kosfeld et al. (Citation2005) on the effect of intranasal oxytocin on dollars invested in a trust game. In A, a bar graph is used to show median trust and standard error for each group. The * indicates a statistically significant difference in a one-tailed test (p = .029). In B, all the individual data is shown (circles). Each circle with an error bar represents the group median along with the 95% CI for the median. The plot emphasizes the effect size, which is the difference between the two groups (marked by a triangle, which is an increase of $1 in median trust). The error bar represents the uncertainty about that estimate; it is the 90% CI of the difference, which is [0.00001, 2.99]. The confidence interval is not symmetrical around the point estimate. See the last section of the paper for technical details on how this data was summarized.
![Fig. 1 Two ways of looking at the same data. This figure compares the NHST approach (A) and the New Statistics approach to visualizing the same data (B). The data is from Kosfeld et al. (Citation2005) on the effect of intranasal oxytocin on dollars invested in a trust game. In A, a bar graph is used to show median trust and standard error for each group. The * indicates a statistically significant difference in a one-tailed test (p = .029). In B, all the individual data is shown (circles). Each circle with an error bar represents the group median along with the 95% CI for the median. The plot emphasizes the effect size, which is the difference between the two groups (marked by a triangle, which is an increase of $1 in median trust). The error bar represents the uncertainty about that estimate; it is the 90% CI of the difference, which is [0.00001, 2.99]. The confidence interval is not symmetrical around the point estimate. See the last section of the paper for technical details on how this data was summarized.](/cms/asset/561146b1-e2fd-4705-a8f7-0804952891ee/utas_a_1518266_f0001_b.jpg)
The New Statistics approach offers a very different lens from which to interpret the same data (). Under this approach, we would ask the quantitative question: By how much does oxytocin increase trust in humans? The answer given would not be a p value but an effect-size estimate: median trust behavior in the oxytocin group is estimated to be 12.5% higher than in the placebo group, a notable increase (technical details on our re-analysis of this data are presented in the last section of this article). This effect size should not stand on its own—we also need to countenance the uncertainty inherent in generalizing from a sample of this size. One popular way to express uncertainty is to report a confidence interval; in this case the 90% confidence interval is [0.0002%, 37.5%]. This means that if the real effect was very large (37.5% increase in median trust) the data obtained would not be especially unusual or remarkable. On the other hand, the data would also be unsurprising if the true effect is vanishingly small, as small as 2 ten-thousandths of a percent. Based on this, we should consider the experiment uninformative; the study is intriguing but it does not demonstrate that oxytocin has a meaningful impact on trust.
With the benefit of hindsight, we know that this cautious conclusion is probably accurate: only a very small quantity of intranasally delivered oxytocin is now thought to reach the brain, so it may not be possible for this route of administration to reliably influence trust (reviewed in Leng and Ludwig Citation2016a; Citationb; though see the commentary by Quintana and Woolley Citation2016). Consistent with this, attempts to replicate the findings of Kosfeld et al. (Citation2005) have so far been unsuccessful (summarized in Nave et al. Citation2015; see also a critical commentary by Quintana Citation2018).
In this example, the New Statistics leads to a very different (and more judicious) conclusion than the NHST approach. What is striking is that the confidence interval reported here is based on the exact same data, models, assumptions, and standards of evidence as the p-value originally reported. Although both approaches ought to lead to a very tentative conclusion, the p-value approach does not make the uncertainty in the sample salient and the tendency towards hasty generalization is left unchecked. The New Statistics emphasizes quantifying and interpreting uncertainty; this should help researchers better calibrate their conclusions to the evidence.
The example provided here is not unusual. There is diversity across different fields of inquiry, but many research communities rely primarily on samples that are far too small relative to the research claims that are made (e.g., Button et al. Citation2013; Szucs and Ioannidis Citation2017). In oxytocin research, for example, Kosfeld et al. (Citation2005) is entirely typical. A recent meta-analysis of studies manipulating oxytocin in humans found a median sample-size of just 25 participants/group (Walum et al. Citation2016). The authors of the meta-analysis concluded that the published research literature on intranasal oxytocin is generally unreliable.
2 The New Statistics Approach Can Help Reduce Confirmation Bias
Confirmation bias is the selective appraisal of evidence: evidence supporting one’s position is accepted uncritically while contrary evidence is discounted or even ignored. Humans have a strong tendency toward confirmation bias; the scientific method is a cognitive prosthetic designed to mitigate this bias.
Although scientists agree that evidence must be weighed impartially, few seem to recognize that the NHST approach institutionalizes confirmation bias. The NHST approach dichotomizes research results into “statistically significant” and “not statistically significant”. That would be fine if both types of results were weighed equally, but they are not. Researchers are taught that a lack of statistical significance is inconclusive—it could mean their hypothesis is wrong, but it could also mean the experiment was not conducted properly or that not enough data were collected. Statistical significance, on the other hand, is treated as conclusive—worries about sample size or procedural error might go right out the door. This “heads I win, tails you lose” approach means that negative results are routinely discarded into the “file drawer” rather than being published and weighed alongside more favorable results. The file drawer problem has been well-documented but unsolved for almost 60 years (Sterling Citation1959; Sterling et al. Citation1995).
The New Statistics approach can help decrease confirmation bias in the published literature. Under the New Statistics approach, results are not dichotomized into” significant” or “nonsignificant”—there are simply estimates and uncertainty. Of course, every research result needs to be evaluated carefully. There are factors that can cause underestimation (e.g. insufficient manipulation, careless responding, noisy measurement, etc.). But there are just as many factors that can cause overestimation (e.g. experimenter bias, failure of random assignment, differential dropout, etc.). Thus, the New Statistics approach emphasizes applying the same epistemic standards regardless of the result. Moreover, the New Statistics emphasizes synthesis, especially through meta-analysis, to help ensure that all evidence is weighed. Although meta-analysis cannot magically open the file drawer, it can often indicate when the data available for synthesis is biased, helping to sound the alarm that a hypothesis is not being fairly evaluated.
The impact of confirmation bias has been acutely illustrated in the literature on oxytocin and human social behavior. We now know that oxytocin delivered via the nose could be inert in terms of brain function (Leng and Ludwig Citation2016b). And yet there is a large published literature showing statistically significant and large effects of intranasal oxytocin on human behavior: it is reported to increase self-confidence, boost trust, facilitate social interactions, increase altruism, and much more (reviewed in Walum et al. Citation2016). How could an inactive treatment be “proven” effective? Some researchers hold out hope that intransal oxytocin may be active, perhaps via the peripheral nervous system or by reaching the brain at important but unmeasurable levels (Neumann and Landgraf Citation2012; Quintana and Woolley Citation2016). A recent meta-analysis, however, offers a much simpler explanation: confirmation bias. Specifically, it was found that the published literature shows “excess significance”: more studies are statistically significant than plausible given the small sample sizes used (Walum et al. Citation2016). This means that many “negative” findings have been either suppressed or inappropriately coaxed under the threshold for statistical significance. Consistent with this possibility, one brave lab has opened its file drawer for inspection (Lane et al. Citation2016), reporting that the five positive results it has published represent just 39% of the 13 different tests the lab had conducted. The lab had tried to publish the eight less favorable results, but these were “rejected time and time again” (p. 38). Having only positive results reach the public distorts research findings: although the lab’s public output seemed to show a strong effect of oxytocin, meta-analysis across all of its work indicates oxytocin had little to no effect on the trust behaviors that had been measured.
At this stage, there is a voluminous published literature on oxytocin and human trust, but it is unclear if any very reliable knowledge has been generated. Moreover, some harm has been done. Based on what seemed like an unequivocal research literature, a number of clinical trials have been launched examining whether intranasal oxytocin could enhance social function in children with autism. These trials have not yet yielded strong evidence of a benefit (though see Yatawara et al. Citation2016). Unfortunately, almost 40% of the 261 children so far treated with oxytocin have suffered an adverse event (DeMayo et al. Citation2017; compared with only 12% of the 170 children assigned a placebo). Thankfully, most (93) of these adverse events were mild; but six were moderate, and three severe.
Could the New Statistics and Open Science have helped prevent the oxytocin debacle? We think so. First, focusing on effect sizes might have made it clear that some reported effects of oxytocin on trust are too large to be credible. Second, making uncertainty salient would have indicated the acute need for direct replication, something which has been unacceptably rare in this literature and in many other fields of study (Makel et al. Citation2012). Third, dispelling the false dichotomy between “positive” and “negative” results might have made it more likely for unfavorable results to be published and considered. Fourth, Open Science practices might have improved transparency and completeness in reporting. Finally, meta-analysis has already played a critical role in bringing the problems in the oxytocin literature to light.
The file drawer problem is anathema to good science. It is a disgrace that this problem has persisted for so long since its initial recognition. If the New Statistics approach can even slightly improve the situation, it will be well worth adoption.
3 The New Statistics Approach Can Foster More Cautious Judgments of Consistency
Researchers frequently judge the consistency of results across different conditions or contexts. For example, a researcher may test the effects of a drug on both memory and anxiety and then try to judge if the drug influences both measures similarly, or if there is a selective effect that is specific to just memory or just anxiety. Judgments of consistency are important tools in discerning mechanisms (why an effect occurs) and boundary conditions (in what contexts an effect will occur). Accurate judgments of consistency are essential to fruitful science.
The correct method for judging the consistency of two results is to make a direct statistical comparison that factors in the uncertainty in both data sets. In the NHST approach, this means examining the “interaction” to see if it is statistically significant. In the New Statistics approach, this means estimating and interpreting the “difference of the difference” to quantify the degree to which the two sets of results differ and the uncertainty in generalizing from the samples.
If that last paragraph made your head spin, you are not alone: comparing sets of results is a difficult topic in inferential statistics. Unsurprisingly, many competent researchers avoid the complex (but correct) solution in favor of heuristic approaches that are simpler, but sometimes wrong. There are heuristic approaches for both the NHST approach and the New Statistics approach. Both can lead to error, but in very different ways: the NHST approach sets a standard that is too low; the New Statistics sets a standard that is too high.
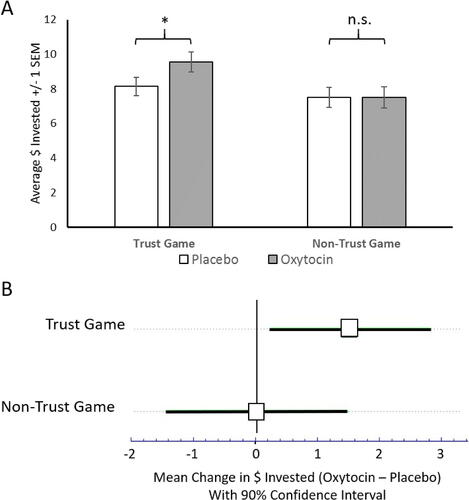
Under the NHST approach, researchers often take the short-cut of judging consistency through the comparison of statistical significance status: two results are judged to be consistent if their statistical significance matches (both significant or both not significant), or inconsistent if one is statistically significant and the other is not. For example, Kosfeld et al. (Citation2005) noted that oxytocin had a statistically significant effect on a game of trust, but did not have a statistically significant effect in a similar game that involved risk but not trust (the other player was not a human but an algorithm that selected responses at random). Because one effect was statistically significant but the other was not, the results were judged to be inconsistent and it was concluded that oxytocin has a selective effect on trust ().
Fig. 2 Two heuristic approaches to judging consistency. This figure compares the NHST approach (A) and the New Statistics approach (B) to making heuristic judgements of consistency. The data is from Kosfeld et al. (Citation2005) on the effect of intranasal oxytocin on dollars invested in a trust game and nontrust game that involved only risk. In A, a bar graph is used to show average trust with standard error. The * indicates a statistically significant difference in a one-tailed test (p = 0.04) for the trust game whereas the n.s. indicates a nonsignificant test in the nontrust game. On this basis, many researchers erroneously judge the results to be inconsistent. However, a direct test for the interaction of oxytocin and game type is not statistically significant (p = 0.20 for a standard ANOVA test for interaction). In B we focus on the effect of oxytocin in each context, plotting the difference in mean trust between the oxytocin and the placebo groups, along with the 90% CIs. The strong overlap between the CIs suggests, correctly, that this is not enough data to judge the results inconsistent. In this figure means are compared for ease of analysis. Kosfeld et al. (Citation2005) actually used nonparametric tests and focused on comparing medians, but this also indicates a nonsignificant interaction between drug and task (p = 0.23). The last section of this article has technical details on how we re-analyzed the data from Kosefeld et al. (2005).
This approach is frequently found in the published literature (e.g. Nieuwenhuis et al. Citation2011) but it is too generous by far. Specifically, “selective” effects can be obtained by comparing a statistically significant finding against another set of results drawn from an inadequate sample. For example, Kosfeld et al. (Citation2005) recruited only 61 participants for the study of how oxytocin influences behavior in the nontrust game. That’s not a fair test: even if oxytocin affects behavior in both games similarly, the second study is more likely than not to find nonsignificant results due to inadequate sample size. When this heuristic approach is replaced by a formal test for consistency of results, the outcome is not statistically significant (p = 0.23). Thus, the short-cut used by Kosfeld et al. (Citation2005) led to a claim that oxytocin selectively influences trust, but the correct analysis does not provide adequate support for this conclusion. This is not an uncommon situation—many researchers use this shortcut approach and many fields of inquiry rely on inadequate samples. This combination will often lead to spurious claims of specificity2.
With the New Statistics approach, researchers can also take a shortcut by simply comparing the confidence intervals for both sets of results (Figure 3B): the results are judged inconsistent only if the intervals have no overlap. This approach is not valid; results can be statistically inconsistent even with a small degree of overlap between confidence intervals (see Greenland et al. Citation2016 for a detailed explanation). Thus, the natural inclination to use a “no overlap” rule is actually overly cautious, in many cases equivalent to requiring p < 0.01 to judge results inconsistent (see Cumming and Finch Citation2005 for an explanation and important caveats).
It may seem a bit odd that we are highlighting here a way in which the New Statistics fosters invalid research conclusions. But we think this reveals several important points. First, there are complex interactions between human cognition and statistical inference. Even the same statistical models can evoke different reactions when summarized in different ways. Second, the New Statistics is not a panacea—it may protect against some cognitive foibles but foster others. Finally, there is much more work to be done in the study of statistical cognition—in the way both experts and the public respond to different ways of presenting inferential statistics. We think the New Statistics approach is often the best way of summarizing results because it makes uncertainty salient, but continued empirical work can help work out what types of statistical summaries best support good judgments in different contexts.
4 Open Science Practices Are Needed, Too
Predictive power is one of the ultimate signs that science is working well. Because of this, data analysis is usually divided into two domains: exploratory, where a researcher is discovering trends but must be extremely tentative about conclusions, and planned, where a researcher seeks to confirm specific predictions. While this sounds simple in principle, in practice the dividing line between planned and exploratory research can be difficult to maintain. Indeed, exploratory findings have a slippery way of “transforming” into planned findings as the research process progresses (e.g., O’Boyle et al. Citation2014). Moreover, researchers can be tempted to use flexible definitions of what counts as confirmation.
The literature on oxytocin and human social behavior again offers a striking example of this problem. One research group recently defended the quality of the research in this field by pointing out that they had found a beneficial effect of oxytocin on social-cognition in patients with schizophrenia and that this “particular effect” had been independently replicated (Quintana and Woolley Citation2016). That seems like striking evidence. Here, though, is a more complete description of these results provided by Leng and Ludwig (Citation2016b):
In the first study (Woolley et al. Citation2014), patients treated with oxytocin or placebo were given two different tests of social cognition. There were no overall effects. Instead, there was an effect on one of the subelements of the second test.
In the second study (Davis et al. 2014), three tests of social cognition were administered. None showed significant effects of oxytocin. However, a marginally significant effect was found when combining one subelement of the third part of the second test with the results from one of the other tests.
Underneath the claim of consistently replicated results, then, there is very generous standard for what it means for “particular effect” to be replicated.
Changing statistical approaches will not help with these types of issues. Any approach can be used to selectively report positive evidence, to dress up exploratory research as planned, and/or to allow undue flexibility in what counts as confirmation of a hypothesis. Fortunately, Open Science practices can help ameliorate these problems. One practice that is quickly gaining popularity is public preregistration (Mellor and Nosek Citation2018). This is where a researcher publicly posts full details of their planned research, including their predictions and the specific planned analyses that will be used to check these predictions. Preregistration helps foster more thoughtful initial planning of the research and provides a publicly verifiable firewall between exploratory and planned analysis. Even better, some journals are now implementing preregistered review (e.g., Bernard Citation2017), where peer review occurs prior to data collection as well as after the study is complete. This enables peer reviewers to help researchers identify and fix flaws in their approach when it still might be helpful. In addition, preregistered review commits the journal to an “in principle” acceptance of the paper regardless of results. This helps focus the journal evaluation process on selecting good research questions being answered with reliable methods. Most importantly, preregistered review offers a fighting chance to finally solve the file drawer problem3.
The Open Science movement is still young and evolving. We expect that any new practice adopted may bring concomitant problems and could also open up new opportunities for the system to be gamed. But it would be foolish to let the best be the enemy of the good. Increasing transparency in the research process, especially as it relates to exploratory vs. planned analysis, can have a strong positive impact on science.
5 Some Unpersuasive Counterarguments
There is tremendous resistance to abandoning p values and the NHST approach:
Some have argued that there is there is no need to change because there are no systematic or unusual problems in current scientific practice (e.g. Gilbert et al. Citation2016). According to this point of view replicability in science is high, and any areas of low replicability are not representative of the whole. Statistically speaking, we know that this sunny outlook is implausible. The oxytocin and trust literature went astray due to insufficient sample sizes, publication bias, and post-hoc reasoning. These problems are not unique to neurohormone research, rather they are endemic across many of the behavioral and life sciences (Button et al. Citation2013; Dumas-Mallet et al. Citation2017; Szucs and Ioannidis Citation2017).
Some have argued against change due to optimism, arguing that if we simply taught and used the NHST approach correctly all would be fine. We do not believe that the cognitive biases which p-values exacerbate can be trained away. Moreover, those with the highest levels of statistical training still regularly interpret p-values in invalid ways (McShane and Gal Citation2015). Vulcans would probably use p-values perfectly; mere humans should seek safer alternatives.
Others have argued against change due to cynicism. For example, Nelson, Simmons, and Simonsohn (Citation2018) recently argued that p-values are no more problematic than any other approach, because all approaches can be used mindlessly. We agree that all approaches can be misused. Indeed, researchers can make rote reports of confidence intervals without actually countenancing uncertainty (Fidler et al. Citation2004). Still, the argument by Nelson et al. (Citation2018) is like claiming that all cars are equally safe just because any car can crash. What matters is how likely one is to go wrong with the NHST approach compared to the alternatives. Further study is required, but we think the New Statistics approach can help researchers more regularly make good judgments from data.
Another frequent concern is that scientists need to make clear Yes/No decisions (e.g. Does this drug work? Is this project worth funding?). No problem! Focusing on effect sizes and uncertainty does not preclude making decisions—in fact, it makes it easier because one can easily test a result against any desired standard of evidence. For example, suppose you know that a drug improves outcomes by 10% with a 95% confidence interval from 2% up to 18%. If the standard of evidence required is at least a 1% increase in outcomes, the drug would be considered suitable (because a 1% increase is not within the range of the confidence interval). For a standard of evidence of at least a 5% increase, though, the drug would be considered not yet proven to be suitable (because although 5% is plausible, so is the drug providing only a 2, 3, or 4% benefit). Thus, when focusing on effect sizes and uncertainty over p values one can (if absolutely necessary) make clear-cut Yes/No decision. It is important to note, though, that in practice Yes/No decisions should not be reduced to a simplistic ritual. Decision-making should be informed not only by the best available statistical evidence but also costs and benefits, the alternatives available, relevant values or norms, and more. This is especially important when it comes to publication decisions—these should be guided by the quality of the study, not the data that has been obtained.
Some have argued that we can retain p-values but interpret them quantitatively, as a measure of strength of evidence against the null. This is a step forward from the dichotomous interpretation of p-values, but it still fails to highlight practical significance. Moreover, it seems that in practice even experts fall into the trap of thinking of p-values in a Yes/No fashion (McShane and Gal Citation2015).
Finally, others have sought to rescue the NHST approach by tightening standards, advocating for a redefined and more stringent threshold for declaring statistical significance (Benjamin et al. 2018). This pours gasoline onto the fire. This “solution” doubles down on the arbitrary dichotomy between “significant” and “not significant” and will exacerbate publication bias by pushing more results into the file drawer.
Not all resist abandoning p-values; many are ready to move on to other approaches. It has been difficult, though, to rally reformers around a common set of principles. Notably, some have criticized the New Statistics approach for not going far enough, arguing confidence intervals have too many of the foundational flaws that plague the NHST approach. Traditional confidence intervals do have weaknesses, but this is not a reason to reject a New Statistics approach. There are many ways to quantify and express uncertainty, including Bayesian credible intervals (Kruschke and Liddell Citation2017). Thus, one can make a clean break from frequentist statistics while still focusing on estimation, uncertainty, and meta-analysis. What does not make sense, to our mind, is to adopt Bayesian inference but then to use it in the same mindless decision-making framework that makes the NHST approach so dangerous. We suspect that, at present, confidence intervals are more likely to be understood and used by researchers steeped in NHST. The larger jump to Bayesian estimation could follow.
6 Some Persuasive Cautions
One important caution is that expressions of uncertainty are themselves uncertain. Confidence intervals and credible intervals are based on mathematical ideals; they express the sampling error one would expect in an otherwise perfect study. In practice, samples are often more misleading than the math would predict (e.g., Shirani-Mehr et al. Citation2018). Researchers should always keep in mind that expressions of uncertainty are a best case scenario. In particular, it is important not to put too much emphasis on the boundaries of a particular confidence interval or credible interval; these boundaries are arbitrary.
Another important caution is that inferential statistics are not the ultimate arbiter of scientific truth. McShane et al. (Citation2017) have argued that it is important for researchers to refocus on what have lately been neglected factors in evaluating scientific results: the reliability and validity of the measurement, the quality of the design, interpretation of positive and negative controls, the plausibility of the mechanism, and the practical real-world implications. We whole-heartedly agree.
A final important caution is that the problems in science are not merely statistical. There are also structural, economic, and cultural issues that are increasingly problematic as science nears its 300th year of nearly continuous exponential growth. Inferential statistics is just one area in need of reform in order to maintain the unparalleled productivity of modern science.
7 Ways Forward
The inertia behind p-values is considerable, and 60+ years of incisive criticism has not yet dethroned NHST as the dominant approach to inference in many fields of science. Momentum, though, seems to finally be on the side of reform. Journals are increasingly revising publication guidelines to require authors to report effect sizes and confidence intervals (e.g., Eich Citation2014). The American Psychological Association has revised its publication manual (2010) to enjoin reporting and interpreting effect sizes and confidence intervals (reviewed in Fidler Citation2010). Open Science practices are becoming increasingly common across many branches of scientific inquiry (see, e.g., Giofrè et al. Citation2017).
In addition to internal reforms, we think an important catalyst for change will be from the outside, from the many stakeholders that fund, consume, and depend on scientific research. One of the persistent barriers for meaningful interactions with stakeholders has been the cognitive opacity of the NHST approach: the counter-intuitive p value (it’s good when it is small), the mysterious null hypothesis (you want it to be false), and the eminently confusable Type I and Type II errors. If stakeholders realized that instead of simplistic yes/no judgments and mysterious p-values scientists could speak to them in the simple language of effect size and uncertainty, they would rightfully demand that all results be presented this way. We strongly encourage this response. When engaging with research outputs, stakeholders should be unafraid to ask:
How much does this help?
How wrong might you be?
What else is known that might influence your conclusions?
Leverage from outside forces would help internal reforms gain more traction and might finally help end the pernicious NHST tradition.
Although we are optimistic about the future, it is important to be clear-eyed about the daunting task ahead. The NHST approach is a complex ecosystem. It is embedded in textbooks, in the assessments that colleges use to evaluate their students, in software tools, and most importantly in the way several generations of scientists have been trained to think. Moving towards a New Statistics approach will thus require systemic change across the scientific landscape, not just updates to journal and publishing guidelines. There is lots of interesting and helpful work to be done; we hope many will take up the challenge.
8 Further Reading
For those interested in learning more about the New Statistics approach, we recommend:
Video Tutorials on the New Statistics designed specifically for those already trained in the NHST approach: http://www.psychologicalscience.org/members/new-statistics (see also Cumming Citation2011).
Our recent textbook for students just getting started with inferential statistics (Cumming and Calin-Jageman Citation2017). It emphasizes the New Statistics and Open Science practices.
ESCI – a free set of Excel workbooks for calculating and visualizing effects sizes and confidence intervals for a number of common research designs. ESCI is available for download at: https://thenewstatistics.com/itns/esci/
Works on Bayesian New Statistics, especially this short overview (Kruschke and Liddell Citation2017) and this excellent textbook (Kruschke Citation2014)
Resources for sample-size planning to obtain accurate effect size estimates, especially the work of Ken Kelley and colleagues (e.g. Kelley Citation2007; Maxwell et al. Citation2008) and the useful web tools they have made available: https://designingexperiments.com/
The excellent book by Kline (Citation2004) that summarizes the history of the NHST approach, outlines its flaws, and provides detailed exposition and references on the calculation of frequentist confidence intervals. Smithson (Citation2002) also provides a highly accessible introduction to confidence intervals.
9 Technical Details
Kosfeld et al. (Citation2005) summarized their research on oxytocin and trust using the NHST approach. In Sections 2 and 3, we showed how this data would be summarized using the New Statistics approach. Our goal was to stay as true to Kosfeld’s approach as possible, using the same models and assumptions, but to summarize the data through effect sizes and uncertainty. It is important to note that regardless of the analytic strategy the data from Kosfeld et al. (Citation2005) is highly uncertain; it is compatible with a wide range of oxytocin effects including the possibility that effects are vanishingly small. The point of our re-presentation is simply to illustrate how differently the same results are judged when summarized with p values compared to with estimates of effect sizes and uncertainty. Data and analysis scripts are posted at https://osf.io/54n9q/.
9.1 Data Extraction
To recover the raw data from Kosfeld et al. (Citation2005), we drew on their , which presents histograms of the data from the trust and risk experiments. However, we found that the bar heights in sum to just 26 control participants even though the text of the manuscript reports that there were 29 control participants. Through trial and error we found that imputing three additional scores of 10 in the control group of the trust experiment yielded a dataset that reproduced all the statistics reported in the main text and Table 1. Notably, seems to be missing a bar for control group participants scoring a 10; it seems likely that this aspect of the figure was clipped or misprinted.
9.2 Original Research Strategy
Kosfeld et al. (Citation2005) made inferences about the population by using the Mann–Whitney U test (also known as the Wilcoxon test). This tests the equality of the distribution functions for the two groups. Kosfeld et al. (Citation2005) interpreted statistically significant results to indicate differences not only in group distributions but also in group medians (e.g. “These differences in the distribution of trust result in higher average and median trust levels for subjects given Oxytocin”, p. 674). The interpretation of differing group medians requires the assumption that the distributions are symmetrical. For the critical test comparing the placebo and oxytocin in the trust experiment, a one-tailed test was reported (“p = 0.025 one sided”). All other tests reported were two-sided.
9.3 Comparing Oxytocin And Placebo Groups in The Trust Experiment
As Kosfeld primarily focused on median trust, we selected the difference between median trust as our measure of effect size. This was calculated using the Hodges–Lehmann estimator. Technically, this calculates the psuedomedian, but if one assumes the distributions are symmetrical (as Kosfeld et al., Citation2005 seem to have assumed), then the psuedomedian coincides with the median. For clarity, we elided this distinction in the main text and discussed the effect size simply as a difference in medians. Note, again, that other analytic approaches (e.g., estimating the difference between means with a t-test) would still lead to the same conclusions.
There are multiple ways to quantify uncertainty, including Bayesian credible intervals and frequentist confidence intervals. As Kosfeld et al. (Citation2005) used a frequentist approach, we report frequentist confidence intervals for the difference between medians. This was again based on the Hodges–Lehmann estimator. Calculations were made in R using the Wilcox.test function which can also provide the estimated psuedomedian and its confidence interval. To match the stringency of the one-tailed test used by Kosefeld et al. (2005), we calculated and report 90% confidence intervals.
In the text, we express the difference between medians in % terms (e.g. a 12.5% increase in median trust). To obtain % changes, we divided the estimated change in location (1) by the median in the placebo group (8).
9.4 Estimated Power for the Non-trust Experiment
In Section 3 we estimate the power Kosfeld et al. (Citation2005) had to detect an oxytocin effect in the nontrust experiment in which participants played a game that involved the same risk but not trust. For the trust experiment, the standardized mean difference in performance was d = 0.47. We estimated the power to detect this effect size in the non-trust experiment, which involved 61 total participants and was analyzed with a two-tailed test with an alpha of 0.05. For an independent samples t-test, power would be 0.45 if all assumptions were perfectly met. Kosfeld et al. (Citation2005) actually used a nonparametric test. Parametric tests can lose power dramatically with violations of assumptions whereas non-parametric tests are more robust. However, our estimated power of 0.45 is for a t-test under ideal circumstances and thus is optimistic for the analysis strategy utilized by Kosfeld et al. (Citation2005). Although the ideal way to estimate a priori power for the nontrust experiment could be debated, it seems unequivocal that the experiment did not have a sample-size sufficient to regularly detect the expected effect of oxytocin, and thus the negative results are unconvincing as a test for specificity of an oxytocin effect.
9.5 Drug × Task Interaction
Kosfeld et al. (Citation2005) made a number of comparisons between groups in the trust and nontrust experiments. They did not, however, test the critical interaction between drug and task. To do this with the nonparametric approach used in the original study, we used the aligned rank transform test developed by Higgins and Tashtoush (1994), implemented as the aligned.rank.transform function from the ART package in R. This indicated a nonsignificant interaction, p = 0.23. An ANOVA test for an interaction also indicated a nonsignificant interaction between group and task, p = 0.20.
Acknowledgment
The authors thank Rebecca Pliske and Daniel Quintana for helpful comments on an earlier draft of this article.
Funding
This work was partially supported by NIMH Grant 1R15MH107892-01.
Notes
1 Actually, there are problems with p-values themselves, too. But our focus in this paper is specifically on our own cognitive foibles and how these can be mitigated by a New Statistics approach.
2 Comparing significance levels can also mask real differences. For example, suppose both Drug A and Drug B have statistically significant benefits on feelings of depression. Many researchers would therefore judge the drugs to have consistent effects. In reality, though, the drugs might differ substantially in how much they influence feelings of depression. Being cognizant of a difference in magnitude can have important implications for making good inferences.
3 There is much more to the Open Science movement (e.g., sharing data and code, being fully transparent in reporting). We are brief here because others have discussed the benefits of Open Science with more detail and authority (e.g., Nosek et al. 2015, Citation2018).
Related Research Data
References
- American Psychological Association (2010), Publication Manual of the American Psychological Association, Washington, DC: Author.
- Benjamin, D. J., Berger, J. O., Johannesson, M., Nosek, B. A., Wagenmakers, E.-J., Berk, R., Bollen, K. A., Brembs, B., Brown, L., Camerer, C., Cesarini, D., Chambers, C. D., Clyde, M., Cook, T. D., De Boeck, P., Dienes, Z., Dreber, A., Easwaran, K., Efferson, C., Fehr, E., Fidler, F., Field, A. P., Forster, M., George, E. I., Gonzalez, R., Goodman, S., Green, E., Green, D. P., Greenwald, A. G., Hadfield, J. D., Hedges, L. V., Held, L., Hua Ho, T., Hoijtink, H., Hruschka, D. J., Imai, K., Imbens, G., Ioannidis, J. P. A., Jeon, M., Jones, J. H., Kirchler, M., Laibson, D., List, J., Little, R., Lupia, A., Machery, E., Maxwell, S. E., McCarthy, M., Moore, D. A., Morgan, S. L., Munafó, M., Nakagawa, S., Nyhan, B., Parker, T. H., Pericchi, L., Perugini, M., Rouder, J., Rousseau, J., Savalei, V., Schönbrodt, F. D., Sellke, T., Sinclair, B., Tingley, D., Van Zandt, T., Vazire, S., Watts, D. J., Winship, C., Wolpert, R. L., Xie, Y., Young, C., Zinman, J., and Johnson, V. E. (2018), “Redefine Statistical Significance,” Nature Human Behaviour, 2, 6–10. DOI: 10.1038/s41562-017-0189-z.
- Bernard, C. (2017), “Editorial: A Message from the Editor-in-Chief,” Eneuro, 4, ENEURO.0023-17.2017. DOI: 10.1523/ENEURO.0023-17.2017.
- Button, K. S., Ioannidis, J. P. A., Mokrysz, C., Nosek, B. A., Flint, J., Robinson, E. S. J., and Munafò, M. R. (2013), “Power Failure: Why Small Sample Size Undermines the Reliability of Neuroscience,” Nature Reviews Neuroscience, 14, 365–376. DOI: 10.1038/nrn3475.
- Chavalarias, D., Wallach, J. D., Li, A. H. T., and Ioannidis, J. P. A. (2016), “Evolution of Reporting P Values in the Biomedical Literature, 1990–2015,” JAMA, 315, 1141. DOI: 10.1001/jama.2016.1952.
- Cumming, G. (2011), Understanding the New Statistics: Effect Sizes, Confidence Intervals, and Meta-Analysis, New York: Routledge.
- Cumming, G., and Calin-Jageman, R. J. (2017), Introduction to the New Statistics: Estimation, Open Science, and Beyond, New York: Routledge.
- Cumming, G., and Finch, S. (2005), “Inference by Eye: Confidence Intervals and How to Read Pictures of Data,” The American Psychologist, 60, 170–180. DOI: 10.1037/0003-066X.60.2.170.
- Davis, O. S. P., Band, G., Pirinen, M., Haworth, C. M. A., Meaburn, E. L., Kovas, Y., Harlaar, N., Docherty, S. J., Hanscombe, K. B., Trzaskowski, M., Curtis, C. J. C., Strange, A., Freeman, C., Bellenguez, C., Su, Z., Pearson, R., Vukcevic, D., Langford, C., Deloukas, P., Hunt, S., Gray, E., Dronov, S., Potter, S. C., Tashakkori-Ghanbaria, A., Edkins, S., Bumpstead, S. J., Blackwell, J. M., Bramon, E., Brown, M. A., Casas, J. P., Corvin, A., Duncanson, A., Jankowski, J. A. Z., Markus, H. S., Mathew, C. G., Palmer, C. N. A., Rautanen, A., Sawcer, S. J., Trembath, R. C., Viswanathan, A. C., Wood, N. W., Barroso, I., Peltonen, L., Dale, P. S., Petrill, S. A., Schalkwyk, L. S., Craig, I. W., Lewis, C. M., Price, T. S., Donnelly, P., Plomin, R., and Spencer, C. C. A. (2014), “The Correlation Between Reading and Mathematics Ability at Age Twelve Has a Substantial Genetic Component,” Nature Communications, 5, 4204.
- DeMayo, M. M., Song, Y. J. C., Hickie, I. B., and Guastella, A. J. (2017), “A Review of the Safety, Efficacy and Mechanisms of Delivery of Nasal Oxytocin in Children: Therapeutic Potential for Autism and Prader-Willi Syndrome, and Recommendations for Future Research,” Springer International Publishing, 19, 391–410. DOI: 10.1007/s40272-017-0248-y.
- Dumas-Mallet, E., Button, K. S., Boraud, T., Gonon, F., and Munafò, M. R. (2017), “Low Statistical Power in Biomedical Science: A Review of Three Human Research Domains,” Royal Society Open Science, 4, 160254. DOI: 10.1098/rsos.160254.
- Eich, E. (2014), “Business Not as Usual,” Psychological Science, 25, 3–6. DOI: 10.1177/0956797613512465.
- Fidler, F. (2010), “The American Psychological Association Publication Manual: Implications for Statistics Education (6th ed.),” Proceedings of ICOTS-8, Eighth International Conference on Teaching Statistics, 8.
- Fidler, F., Thomason, N., Cumming, G., Finch, S., and Leeman, J. (2004), “Editors Can Lead Researchers to Confidence Intervals, but Can’t Make Them Think: Statistical Reform Lessons from Medicine,” Psychological Science, 15, 119–126. DOI: 10.1111/j.0963-7214.2004.01502008.x.
- Gilbert, D. T., King, G., Pettigrew, S., and Wilson, T. D. (2016), “Comment on ‘Estimating the Reproducibility of Psychological Science,”’ Science, 351, 1037–1037. DOI: 10.1126/science.aad7243.
- Giofrè, D., Cumming, G., Fresc, L., Boedker, I., and Tressoldi, P. (2017), “The influence of Journal Submission Guidelines on Authors’ Reporting of Statistics and Use of Open Research Practices,” (J. M. Wicherts, ed.), PLOS ONE, 12, e0175583. DOI: 10.1371/journal.pone.0175583.
- Greenland, S., Senn, S. J., Rothman, K. J., Carlin, J. B., Poole, C., Goodman, S. N., and Altman, D. G. (2016), “Statistical Tests, P-values, Confidence Intervals, and Power?: A Guide to Misinterpretations,” The American Statistician, 15, 1–31.
- Kelley, K. (2007), “Sample Size Planning for the Coefficient of Variation from the Accuracy in Parameter Estimation Approach,” Behavior Research Methods, 39, 755–766. DOI: 10.3758/BF03192966.
- Kline, R. B. (2004), Beyond Significance Testing, Washington, DC: American Psychological Association.
- Kosfeld, M., Heinrichs, M., Zak, P. J., Fischbacher, U., and Fehr, E. (2005), “Oxytocin Increases Trust in Humans,” Nature, 435, 673–676. DOI: 10.1038/nature03701.
- Kruschke, J. K. (2014), Doing Bayesian data analysis: A tutorial with R, JAGS, and Stan (2nd ed.).
- Kruschke, J. K., and Liddell, T. M. (2017), “The Bayesian New Statistics: Hypothesis Testing, Estimation, Meta-Analysis, and Power Analysis from a Bayesian Perspective,” Psychonomic Bulletin & Review.
- Lane, A., Luminet, O., Nave, G., and Mikolajczak, M. (2016), “Is there a Publication Bias in Behavioural Intranasal Oxytocin Research on Humans? Opening the File Drawer of One Laboratory,” Journal of Neuroendocrinology, 28.
- Leng, G., and Ludwig, M. (2016a), “Review Intranasal Oxytocin?: Myths and Delusions,” Biological Psychiatry, 243–250. DOI: 10.1016/j.biopsych.2015.05.003.
- Leng, G., and Ludwig, M. (2016b), “Reply to: Intranasal Oxytocin Mechanisms Can Be Better Understood, but Its Effects on Social Cognition and Behavior are Not to Be Sniffed At,” Biological Psychiatry, 79, e51–e52. DOI: 10.1016/j.biopsych.2015.06.022.
- Makel, M. C., Plucker, J. A., and Hegarty, B. (2012), “Replications in Psychology Research: How Often Do They Really Occur?” Perspectives on Psychological Science, 7, 537–542. DOI: 10.1177/1745691612460688.
- Maxwell, S. E., Kelley, K., and Rausch, J. R. (2008), “Sample Size Planning for Statistical Power and Accuracy in Parameter Estimation,” Annual Review of Psychology, 59, 537–563. DOI: 10.1146/annurev.psych.59.103006.093735.
- McShane, B. B., and Gal, D. (2015), “Blinding Us to the Obvious? The Effect of Statistical Training on the Evaluation of Evidence,” Management Science, mnsc.2015.2212.
- McShane, B. B., Gal, D., Gelman, A., Robert, C., and Tackett, J. L. (2017), “Abandon Statistical Significance,” arXiv preprint arXiv:1709.07588.
- Mellor, D. T., and Nosek, B. A. (2018), “Easy Preregistration will Benefit any Research,” Nature Human Behaviour, 2, 98–98. DOI: 10.1038/s41562-018-0294-7.
- Nave, G., Camerer, C., and McCullough, M. (2015), “Does Oxytocin Increase Trust in Humans? A Critical Review of Research,” Perspectives on Psychological Science, 10, 772–789. DOI: 10.1177/1745691615600138.
- Nelson, L. D., Simmons, J., and Simonsohn, U. (2018), “Psychology’s Renaissance,” Annual Review of Psychology, 511–534. DOI: 10.1146/annurev-psych-122216-011836.
- Neumann, I. D., and Landgraf, R. (2012), “Balance of Brain Oxytocin and Vasopressin: Implications for Anxiety, Depression, and Social Behaviors,” Trends in Neurosciences, 35, 649–659. DOI: 10.1016/j.tins.2012.08.004.
- Nieuwenhuis, S., Forstmann, B. U., and Wagenmakers, E.-J. (2011), “Erroneous Analyses of Interactions in Neuroscience: A Problem of Significance,” Nature Neuroscience, 14, 1105–1107. DOI: 10.1038/nn.2886.
- Nosek, B. A., Alter, G., Banks, G. C., Borsboom, D., Bowman, S. D., Breckler, S. J., Buck, S., Chambers, C. D., Chin, G., Christensen, G., Contestabile, M., Dafoe, A., Eich, E., Freese, J., Glennerster, R., Goroff, D., Green, D. P., Hesse, B., Humphreys, M., Ishiyama, J., Karlan, D., Kraut, A., Lupia, A., Mabry, P., Madon, T. A., Malhotra, N., Mayo-Wilson, E., McNutt, M., Miguel, E., Paluck, E. L., Simonsohn, U., Soderberg, C., Spellman, B. A., Turitto, J., VandenBos, G., Vazire, S., Wagenmakers, E. J., Wilson, R., and Yarkoni, T. (2015), “Promoting an Open Research Culture,” Science, 348, 1422–1425. DOI: 10.1126/science.aab2374.
- Nosek, B. A., Ebersole, C. R., DeHaven, A. C., and Mellor, D. T. (2018), “The Preregistration Revolution,” Proceedings of the National Academy of Sciences, 115, 2600–2606. DOI: 10.1073/pnas.1708274114.
- O’Boyle, E. H., Banks, G. C., and Gonzalez-Mule, E. (2014), “The Chrysalis Effect: How Ugly Initial Results Metamorphosize Into Beautiful Articles,” Journal of Management.
- Quintana, D. S. (2018), “Revisiting Non-Significant Effects of Intranasal Oxytocin Using Equivalence Testing,” Psychoneuroendocrinology, 87, 127–130. DOI: 10.1016/j.psyneuen.2017.10.010.
- Quintana, D. S., and Woolley, J. D. (2016), “Intranasal Oxytocin Mechanisms Can Be Better Understood, but Its Effects on Social Cognition and Behavior Are Not to Be Sniffed At,” Biological Psychiatry, 79, e49–e50. DOI: 10.1016/j.biopsych.2015.06.021.
- Shirani-Mehr, H., Rothschild, D., Goel, S., and Gelman, A. (2018), “Disentangling Bias and Variance in Election Polls,” Journal of the American Statistical Association, 113, 607–614 DOI: 10.1080/01621459.2018.1448823.
- Smithson, M. (2002), Confidence Intervals, London: SAGE Publications.
- Sterling, T. D. (1959), “Publication Decisions and their Possible Effects on Inferences Drawn from Tests of Significance—or Vice Versa,” Journal of the American Statistical Association, 54, 30–34. DOI: 10.2307/2282137.
- Sterling, T. D., Rosenbaum, W. L., and Weinkam, J. J. (1995), “Publication Decisions Revisited: The Effect of the Outcome of Statistical Tests on the Decision to Publish and Vice Versa,” The American Statistician, 49, 108. DOI: 10.2307/2684823.
- Szucs, D., and Ioannidis, J. P. (2017), “Empirical Assessment of Published Effect Sizes and Power in The Recent Cognitive Neuroscience and Psychology Literature,” PLOS Biology, 15, e2000797. DOI: 10.1371/journal.pbio.2000797.
- Tversky, A., and Kahneman, D. (1971), “Belief in the Law of Small Numbers,” Psychological Bulletin, 76, 105–110. DOI: 10.1037/h0031322.
- Walum, H., Waldman, I. D., and Young, L. J. (2016), “Statistical and Methodological Considerations for the Interpretation of Intranasal Oxytocin Studies,” Biological Psychiatry, 79, 251–257. DOI: 10.1016/j.biopsych.2015.06.016.
- Woolley, J. D., Chuang, B., Lam, O., Lai, W., O’Donovan, A., Rankin, K. P., Mathalon, D. H., and Vinogradov, S. (2014), “Oxytocin Administration Enhances Controlled Social Cognition in Patients with Schizophrenia,” 47, 116–125. DOI: 10.1016/j.psyneuen.2014.04.024.
- Yatawara, C. J., Einfeld, S. L., Hickie, I. B., Davenport, T. A., and Guastella, A. J. (2016), “The Effect of Oxytocin Nasal Spray on Social Interaction Deficits Observed in Young Children with Autism: A Randomized Clinical Crossover Trial,” Molecular Psychiatry, 21, 1225–1231. DOI: 10.1038/mp.2015.162.