?Mathematical formulae have been encoded as MathML and are displayed in this HTML version using MathJax in order to improve their display. Uncheck the box to turn MathJax off. This feature requires Javascript. Click on a formula to zoom.
ABSTRACT
It is now widely accepted that the techniques of null hypothesis significance testing (NHST) are routinely misused and misinterpreted by researchers seeking insight from data. There is, however, no consensus on acceptable alternatives, leaving researchers with little choice but to continue using NHST, regardless of its failings. I examine the potential for the Analysis of Credibility (AnCred) to resolve this impasse. Using real-life examples, I assess the ability of AnCred to provide researchers with a simple but robust framework for assessing study findings that goes beyond the standard dichotomy of statistical significance/nonsignificance. By extracting more insight from standard summary statistics while offering more protection against inferential fallacies, AnCred may encourage researchers to move toward the post p < 0.05 era.
1 Introduction
The process of turning data into insight is central to the scientific enterprise. It is therefore remarkable that the most widely used approach—null hypothesis significance testing (NHST)—has been subjected to devastating criticism for so long to so little effect. The emergence of the so-called replication crisis has catalyzed widespread debate about NHST in general and the use of p-values in particular (e.g., Nuzzo Citation2014; Baker Citation2016). This debate reached a turning-point in March 2016 with the publication of an unprecedented statement by the American Statistical Association (ASA) stating that p-values are “commonly misused and misinterpreted” (Wasserstein and Lazar Citation2016) and calling for researchers to move toward a “post p < 0.05 era.”
However, the statement stopped short of giving specific recommendations on how this transition should be achieved, stating only that statisticians “often supplement or even replace p-values” through, for example, emphasizing estimation, Bayesian methods, and false discovery rates. This absence of clear guidance has led to concern that the statement will become yet another failed attempt to deal with the threat posed by NHST to reliable scientific inference (see, e.g., Goodman Citation2016a, Matthews, Wasserstein, and Spiegelhalter Citation2017).
In what follows, I examine the potential of the Analysis of Credibility (AnCred, Matthews Citation2018) to encourage researchers to embrace more reliable forms of inference. Its origins lie in a Bayesian technique for assessing clinical trial outcomes in the context of existing knowledge (Matthews Citation2001a, Citation2001b; Spiegelhalter, Abrams, and Myles Citation2004). Its underlying theory has since found applications in health care evaluation (Spiegelhalter Citation2004), epidemiology (Rothman et al. Citation2008), risk assessment (Greenland Citation2011), and interpretive issues in inference (Held Citation2013).
In the current context, I examine the two features of AnCred that make it potentially attractive to researchers in any discipline looking to move beyond NHST:
Its ability to extract more insight from standard summary statistics, allowing researchers to go beyond the simplistic true/false dichotomization encouraged by p-values toward a more nuanced assessment of new findings.
The enhanced protection it offers against common inferential misconceptions promoted by NHST and highlighted by the ASA statement.
I begin by outlining the inferential concepts underpinning AnCred.
2 The Conceptual Basis of the Analysis of Credibility
NHST dichotomizes findings according to whether or not they possess statistical significance, as reflected by p < 0.05. Notoriously, this has become the de facto criterion by which researchers judge whether a finding is worth taking seriously or not. As the ASA statement made clear, however, this is an inappropriate role for the p-value, which bears no simple relationship to effect size or weight of evidence, and offers no means of setting findings in context. Furthermore, it encourages the dangerously false perception that statistically significant results are in some sense “true,” while nonsignificant results are “null” or “negative” outcomes.
These deficiencies have led to calls for the research community to transition from NHST and p-values to greater use of estimation via confidence intervals (CIs). The latter are widely recognized as concise but informative summary statistics (e.g., Rothman Citation1978; Gardner and Altman Citation1986). The resulting inferential benefits are impressive: the bounds of a CI give insight into the best-supported magnitude of an effect, together with its direction and associated uncertainty—none of which flows directly from a p-value. CIs are also better suited to the aggregation of insight and the replication of findings, being more readily combined than p-values, and giving a more intuitive measure of the probability of replication (e.g., Cumming Citation2008).
While the use of estimation methods is growing, such is the grip of NHST that CIs are routinely converted back into p-values or simply inspected to check their bounds exclude no effect. As a result, most of their inferential content is thrown away. In addition, the meaning of CIs under the NHST paradigm is routinely misunderstood in ways similar to that of p-values (see, e.g., Hoekstra et al. Citation2014; Greenland et al. Citation2016).
AnCred is based on the pragmatic view that if the research community is to move beyond NHST, it requires inferential tools that are widely applicable, simple to use, and less prone to misinterpretation. To achieve these goals, AnCred shifts the focus of inference away from null hypothesis testing and toward effect size estimation relevant to the substantive hypothesis, with findings assessed via the concept of credibility. With its origins in Bayesian inference, credibility reflects both the evidential weight of a finding, as captured by the so-called likelihood, and the level of support for the finding provided by existing knowledge as reflected by a prior distribution. Bayesian inference then usually combines this prior information with the likelihood using Bayes’ theorem leading to a posterior distribution giving the updated level of evidence for the claimed effect, commonly summarized as a 95% credible interval. Unlike conventional CIs, this has a straightforward interpretation, in that there is a 95% probability this interval contains the true effect size. Thus, if this posterior credible interval excludes no effect, evidence for a nonzero effect size is said to be “credible at the 95% level.”
With its use of credible intervals, AnCred thus provides a bridge between the dominant but flawed NHST paradigm and the less familiar but more informative methods of Bayesian estimation. It also allows the familiar summary statistic of CIs to be retained but with an interpretation in line with the basic research question: do the data provide credible evidence for the substantive hypothesis of a nonzero effect?
Any inferential method based on Bayesian techniques must confront the so-called problem of priors: the vulnerability of inferences to choices of prior distributions biased—unconsciously or otherwise—to give a desired outcome. This has long been seen as a major challenge to the general acceptance of Bayesian methods, and has prompted a variety of methods for dealing with it (e.g., Spiegelhalter, Abrams, and Myles Citation2004). The approach used in AnCred is to obviate the need to specify a prior by deducing it from the data (Good Citation1950; Carlin and Louis Citation1996). To do this, Bayes’ theorem is inverted and the prior deduced subject to the requirement that when combined with the likelihood it leads to a posterior distribution that excludes no effect. The resulting prior can then be compared with existing evidence to see if it can be justified in the light of what is known. If this is the case, the new finding can be deemed credible evidence of a nonzero effect.
The comparison required by AnCred can be performed in a variety of ways: using CIs to summarize prior evidence from meta-analyses or systematic reviews of previous studies, or ranges based on plausibility arguments. AnCred facilitates the comparison by virtue of maintaining a consistent format for the summary statistics throughout the analysis; for example, if the finding is stated as a 95% CI for an odds ratio (OR), AnCred gives the necessary prior in the same terms. The outcome is a principled and quantitative assessment of the new finding in the context of what is known—in marked contrast to the cursory and qualitative discussion sections typically accompanying NHST-based studies.
As AnCred allows the prior needed for credibility to extracted objectively from the likelihood, concerns about priors being hand-picked to achieve a desired outcome do not arise. Simply put, if a finding is shown to require a level of prior support not found in the existing knowledge base, that finding does not provide credible evidence for a non-zero effect. While selective use of the knowledge base remains possible, AnCred readily exposes such practices and allows the impact of less favorable supporting evidence to be easily determined.
In the case of entirely unprecedented findings, however, comparison with appropriate prior insight may not be possible. In such instances, AnCred assesses the credibility of the finding using the only evidence available: the finding itself. Such intrinsic credibility is determined using a criterion given in the next section, whose basis is explained in the Appendix.
With credibility as its defining concept, AnCred encourages a transition away from unthinking dichotomization based on statistical significance. This practice reflects the widespread, but erroneous, belief that p < 0.05 is a universally valid criterion for the reality of an effect, regardless of context. AnCred, in contrast, assesses findings on the basis of their credibility, which depends not only on evidential weight, but also support from prior insight. As such, it discourages the belief that findings in isolation can be relied on to demonstrate the truth or otherwise of a hypothesis. The assessment of credibility is necessarily context-dependent and thus open to quantitative challenge and debate by the relevant research community, rather than simple declaration by those responsible for the finding.
The theory and modelling assumptions underpinning the above features of AnCred are summarized in the Appendix. As the remit of this Special Issue is to explore practical suggestions for transitioning to the post p < 0.05 era, the rest of this article will focus on assessing the extent to which AnCred addresses the real-life challenges involved in making that transition.
3 How AnCred Is Applied in Practice
Any proposal for encouraging changes in inferential practice must accept the ubiquity of NHST. From the training of new researchers through to the stipulations of leading journals, the concepts of p-values, statistical significance and nonsignificance look set to remain widely used for the foreseeable future, whatever their failings. Pragmatism suggests, therefore, that the best hope of achieving a change in practice lies in offering inferential tools that can be used alongside the concepts of NHST, adding value to them while mitigating their most egregious features.
The formalism of AnCred is aligned with this view. Operationally, it proceeds as follows:
The study finding is summarized using standard methods as a 95% CI (L, U); this represents the likelihood, with point estimate M.
This likelihood is then used to deduce the range of prior effect sizes which, when combined with the likelihood, lead to a posterior range that just excludes no effect at the 95% level. The resulting critical prior interval (CPI) is used to assess the credibility of a finding, according to whether it is statistically significant or not. The appropriate formulas for calculating the CPI in each case are found in the Appendix. For example, if the effect size is stated as a difference in means or proportions, the CPI for statistically significant findings is (-SL, +SL), where SL is the skepticism limit calculated from the likelihood (L, U) via EquationEquation (A1)
(A1)
To assess the credibility of the finding under AnCred, this CPI is compared with effect sizes supported by prior evidence, in the form of CIs or plausible ranges (see Appendix). The criteria used depend on whether the finding is statistically significant, nonsignificant or is unprecedented:
For statistically significant results: if prior evidence supports effect sizes at least as large as the calculated SL, the finding is both statistically significant and provides credible evidence for a nonzero effect.
For statistically nonsignificant results: if prior evidence supports effect sizes lying within the advocacy CPI, the finding provides credible evidence of a nonzero effect size, despite being nonsignificant.
For unprecedented results for which no appropriate prior evidence exists, a finding is both statistically significant and intrinsically credible if the point value M of the 95% CI lies outside the calculated CPI.
The examples that follow show how these criteria are applied in practice. As we shall see, one striking feature of the use of AnCred it that statistically significant findings can nevertheless lack credibility, for example, because their evidential weight is too weak to compensate for their implausibility as indicated by prior evidence. Similarly, statistically nonsignificant results can still provide evidential support for nonzero effects, and provide useful constraint on plausible effect sizes. This highlights the feature of NHST so often overlooked by researchers, and highlighted by the ASA statement: statistical significance and nonsignificance are unreliable indicators of the presence or absence of genuine effects.
To illustrate the ability of AnCred to bring more inferential power to bear on research questions, I now give some representative worked examples. To fix ideas, these are in the form of prototypical findings whose effect size is summarized by a 95% CI for an OR, the substantive hypothesis being that the OR exceeds unity.
Example 1.
OR = 1.57 (1.12, 2.21). This is a statistically significant finding (p = 0.01). To assess whether it also provides credible evidence for a genuine effect, we turn to AnCred and calculate the appropriate CPI from the summary CI. For statistically significant ORs, we use (A2) to calculate the SL, which in this case is 1.47. Thus, for this finding to be deemed credible, AnCred requires that there is prior evidence for plausible ORs at least as large as this; for example, if the prior evidence for a positive effect is summarized by a CI of (Lo, Uo), then we require Lo > SL. This might be entirely reasonable in some contexts, for example, the outcome of a new educational intervention; in such cases we may conclude that the finding provides both statistically significant and credible evidence for a nonzero effect at the 95% level. However, in other contexts—for example, an increase in environmental cancer risk—such an SL may be highly implausible. Either way, AnCred has moved the assessment beyond the standard simplistic true/false dichotomization to a discussion based on both the weight of evidence from the new finding and the context as set by prior knowledge.
Example 2.
OR = 1.57 (1.03, 2.40). This finding has the same central effect size as before and is again statistically significant (p = 0.04). This much is clear simply by noting the point estimate and also that the range excludes no effect. However, this common practice overlooks a crucial difference from the previous example: the CI is considerably wider and its lower bound runs closer to no effect; as such it represents a weaker level of evidence for a positive effect. AnCred quantifies this, with Equation (A2) leading to an SL of 3.0. Thus, the finding is now only credible evidence for a positive effect if there is prior evidence that plausible ORs are at least as large as 3.0. So, for example, if the prior evidence is summarized by a CI of (Lo, Uo), then Lo > 3.0. Intuitively, the more demanding SL reflects the fact that this study provides weaker evidence than the previous example, and thus needs more support from prior evidence to achieve credibility.
If the finding concerned an entirely novel effect for which no clearly relevant prior evidence exists, then the concept of intrinsic credibility applies. In this case, we see that the point value M of the CI—and thus best-supported effect size—is an OR of 1.57 which is lower than the SL, and lies within the skepticism CPI of (1/3.0, 3.0). Thus, for an entirely novel finding, this level of evidence would be statistically significant but not intrinsically credible support for a genuine effect.
Example 3.
OR = 2.03 (1.03, 4.00). This has the same level of statistical significance as the previous example (p = 0.04), but a higher point estimate. Many researchers would thus regard it to be a more impressive finding. However, this again highlights the failings of the common practice of focusing solely on the point estimate and whether the CI excludes no effect. With its upper bound of 4.00 the CI is considerably wider than before, reflecting its lower evidential weight. AnCred reflects this, with (A2) now showing that, despite having the same p-value as before, the wider CI leads to a much more demanding SL: prior evidence that ORs exceed SL ∼ 10 is now needed to achieve credibility. AnCred has here highlighted the fact that findings with the same p-value do not necessarily provide the same evidential weight.
Example 4.
OR = 1.57 (0.93, 2.65). This result has the same point value as the first two examples, but is formally nonsignificant. Furthermore, its p-value of 0.09 lies in the range 0.05 ≤ p ≤ 0.10 often characterized by euphemisms such as “approaching significance,” “marginally significant,” etc. Such findings often prompt researchers to try to claim support for their substantive hypothesis by blurring the normally sharp cut-off for statistical significance. In contrast, AnCred provides a principled approach to such cases, unpacking the evidential content of the CI and showing the implications. In this example, it confirms the intuition that despite being nonsignificant, there is some evidence for a positive effect here, as reflected by its point estimate exceeding unity. AnCred goes further, however, and reveals the weakness of this evidence. Putting the 95% CI into (A4) shows that the advocacy CPI is (1, 1100). This is extremely broad, implying that essentially any prior evidence for a positive effect will suffice to make the finding credible support for such an effect, despite its nonsignificance. That is, the width of the CPI is warning that the finding adds essentially nothing to what is already known from prior evidence. As such, claims that its “marginal” significance adds to the evidence for a positive effect are questionable. Even less justifiable, however, would be the common interpretation of any such nonsignificant finding as indicating the absence of any effect at all. Only more evidential weight from additional data can bring the required clarity.
This is in marked contrast to Example 2, whose 95% CI has the same point estimate but is both tighter and entirely excludes no effect, reflecting its much greater evidential weight. This leads to a CPI putting much greater constraint on those seeking to challenge its credibility as evidence of a positive effect.
Example 5.
OR = 1.10 (0.80, 1.5). With a p-value of 0.57, this strongly nonsignificant result would typically be dismissed by many researchers as powerful evidence of the absence of an effect. As such, it may be given only scant attention in a paper, or indeed remain unpublished. AnCred shows that both responses are inappropriate. Hints of this can be seen simply by inspection of the CI: the central effect is in the direction of a positive effect, and the CI is tighter than in the previous example, suggesting it still carries evidential weight for a positive effect. AnCred confirms this: from Equation (A4) the stated 95% CI leads to AL = 1.5. Thus, despite its nonsignificance, the finding provides credible evidence of a positive effect if prior evidence supports effect sizes lying in the advocacy CPI of (1.0, 1.5). This is much tighter than the previous CPI, despite the similarity of effect size and p-value, essentially because the 95% CI is tighter and the lower bound is further in the direction of a negative effect (ORs < 1.0). It thus puts more constraint on prior effect sizes able to produce credible evidence of a positive effect. Specifically, prior evidence for effect sizes wholly within the advocacy CPI of (1.0, 1.5)—for example, summarized by a 95% CI of, say, (1.2, 1.4)—will make the finding credible evidence of a positive effect at the 95% level, despite being nonsignificant. More diffuse prior evidence lacks the “heft” needed to achieve this, even if its upper bound substantially exceeds AL. For example, prior evidence summarized by (1.2, 4.0) is too diffuse to make the finding of a positive effect credible.
AnCred is, however, based on conservative criteria which guarantee credibility when met. Findings may thus still be rendered credible by prior evidence lying outside the AL if it carries sufficient heft—that is its range is sufficiently tight, for example a 95% CI of (1.8, 5.0). Such situations may encourage researchers to perform a specific Bayesian calculation to make their case. However, in doing so, they must also justify going outside the conservative framework of AnCred. Either way, in this example AnCred highlights the inadvisability of simply dismissing nonsignificant findings as “negative.” Once set in the context of prior knowledge, even strongly nonsignificant findings can provide credible evidence for nonzero effects.
Example 6.
OR = 0.84 (0.45, 1.55). This has the same nonsignificant p-value as before (0.57), but now the point estimate—0.84—contradicts the substantive hypothesis of OR > 1. In such cases, there is no CPI capable of turning this into credible evidence for a positive effect. However, AnCred confirms the intuition that such findings do support the existence of a negative effect. To see this, the advocacy CPI is simply reversed to (AL, 1), consistent with a substantive hypothesis of OR < 1, with AL now calculated using the reciprocal of (A4). We then find a CPI of (0.46, 1), implying that the finding is credible evidence for OR < 1 if prior evidence exists for effect sizes lying wholly in this range. AnCred has here highlighted the fact that while a study may not support the expected substantive hypothesis, this does not imply it supports the complete absence of any effect, and/or should therefore be discarded.
As with the previous example, if the conservative criteria of AnCred are relaxed, prior evidence for effect sizes lying beyond the AL may also render the finding credible; this can be investigated via a standard Bayesian analysis.
These prototypical examples illustrate how AnCred goes beyond the standard dichotomy of NHST, extracting additional insight from findings and providing a basis for quantitative discussion of their implications. I now examine the potential for AnCred to offer enhanced protection against the inferential traps highlighted by the ASA in its 2016 statement.
4 AnCred as a Means of Avoiding Inferential Fallacies
The misconceptions surrounding NHST and p-values are so numerous there have been several attempts to curate them. Goodman (Citation2008) focuses on a “Dirty Dozen,” while the authors of the Supplement to the ASA’s 2016 statement identified more than 20 (Greenland et al. Citation2016). Many of these misconceptions can be avoided by moving from NHST to estimation; however, as we have seen, this alone is not enough. The use of AnCred provides extra protection against inferential fallacies by reducing the opportunities for them to arise in the first place.
4.1 Misinterpretation of p-Values and CIs
The most notorious inferential error in NHST is the interpretation of a p-value as the probability that the null hypothesis is true. This and related fallacies have been promulgated even by statistical texts (for a review, see Hubbard Citation2016a). It is widely held that estimation and CIs are less prone to such misinterpretations. However, they are certainly not immune, with standard CIs often being interpreted as the range within which the true effect size lies with specified probability. This interpretation is valid only within a Bayesian framework, under which CIs become credible intervals with uninformative priors. By explicitly using the Bayesian framework, the use of AnCred obviates this interpretative issue.
4.2 Misappropriation of CIs in Dichotomization
Despite their role in estimation, CIs are commonly hijacked for use in NHST, in which the focus is simply on whether the CI includes values corresponding to no effect. This in turn leads to the notorious practice of taking the resulting dichotomy of statistical significance/nonsignificance as equivalent to the truth or falsity of the substantive hypothesis. In contrast to this inferentially wasteful and misleading practice, AnCred makes full use of the content of the CI, generating SLs and ALs that allow researchers to make more nuanced assessments of the credibility of new findings in the context of existing insight.
4.3 Misuse of Power in the Interpretation of Study Findings
Researchers commonly believe that the bigger the sample, the more compelling the resulting inference. While intuitively appealing, the limitations of this maxim are less widely known. This may explain why the concept of statistical power, which is directly related to sample size, is the source of some of the most recalcitrant inferential fallacies. Power is frequently used retrospectively to interpret study findings, despite being a probabilistic concept that lacks meaning once the results are known (Goodman and Berlin Citation1994). Researchers hoping to find a genuine effect from a small study but confronted with a statistically nonsignificant result frequently ascribe it to “inadequate” power. Conversely, a nonsignificant outcome from a study with high retrospective power is often seen as strong evidence against the existence of the effect.
Such practices have long been criticized without obvious effect (e.g., Hoenig and Heisey Citation2001). This suggests that even if retrospective power is an invalid concept, there is a demand for ways of assessing the weight of evidence once the findings are known. AnCred meets this demand via the concept of credibility. Findings based on small samples typically have wider CPIs than those from large samples, making claims of statistical significance/nonsignificance more vulnerable to challenge, as intuition would suggest. Furthermore, this approach to assessing evidential weight is free from the issues that undermine retrospective power. However, the expressions (A1)–(A4) also show that sample size alone is not enough to determine the CPI in any specific case: both the location of the point estimate of the CI and the relationship to its width also play a role. As such, the use of AnCred also offers protection against the counterintuitive phenomenon known as the power fallacy: the belief that findings from small studies are necessarily less compelling than large studies (Wagenmakers et al. Citation2015). To see this, consider the following real-life example.
Example: Adverse effects of reboxetine. In their systematic review of adverse effects of this anti-depressant, Eyding et al. (Citation2010) include two double-blinded, randomized controlled trials with 510 and 210 patients, respectively. The former gave an OR for adverse effects relative to placebo of 1.73, with 95% CI of (1.07, 2.79); the smaller study gave a larger point estimate of 4.30, but was also substantially less precise, with a 95% CI of (1.85, 9.99). Being based on fewer than half the number of patients, intuition suggests the smaller study is necessarily less compelling. AnCred shows such reasoning to be a case of the power fallacy. The application of (A2) shows that the smaller study has a SL of 1.8, compared with 2.4 for the larger study. Thus, surprisingly, the smaller study actually provides more compelling evidence of adverse effects, in the sense of putting more constraint on skeptics seeking to dismiss the evidence as not credible. In essence, this is because AnCred makes use of both the uncertainty surrounding the effect size (i.e., the width of the CI) and the margin by which it excludes no effect (i.e., the location of the bounds of the CI relative to no effect) in making its assessment. AnCred has here highlighted the unreliability of focusing solely on the width of the CI in assessing the evidential value of a finding.
4.4 Misuse of Significance as a Marker of “Discordant” Results
The replication crisis which motivated the ASA statement has rekindled long-standing concerns over the use of p-values as guides to the probability of successful replication. For example, if an initial study obtained the true effect size along with p = 0.05, there is only a 50% probability of getting so impressive a p-value even from a perfect replication (Goodman Citation1992). For the “intuitive” replication probability of 95% to hold, the initial study must achieve p ≤ 3 × 10– 4.
The use of CIs does less violence to intuition: under ideal conditions, the probability that the mean of a replication falls within the 95% CI of the initial study is 83% (Cumming, Williams, and Fidler Citation2004). Nevertheless, CIs remain vulnerable to serious misconceptions concerning replications. Of these, the most prevalent is that studies whose CIs encompass no effect are necessarily discordant with those which exclude it (and vice versa).
This fallacy is commonly the result of the hijacking of the CI to serve as a proxy for a p-value. The following case-study shows how AnCred addresses this fallacy.
Example: The effect of statins on glioma risk. Widely prescribed for controlling cholesterol, statins appear to have a protective effect against brain cancers (see, e.g., Gaist et al. Citation2014). To investigate this link, Seliger et al. (Citation2016) conducted a large case-control comparison involving 2469 cases of glioma and a 10-fold matched control group. The point estimate for cancer incidence among those receiving statins was an OR of 0.75, consistent with the protective effect found in earlier studies. Yet despite this, the 95% CI of (0.48, 1.17) encompassed no effect, leading the authors to conclude their findings were discordant with these previous studies.
As Greenland noted in a rejoinder (2017) “Such statistical misinterpretations have been decried for at least four decades,” adding that the authors’ error was clearly unintentional, but nevertheless “undermined their considerable and respectable effort.” The use of AnCred would have averted this unfortunate exchange, and also provided more insight into the research question at issue. Instead of interpreting the findings simply via the dichotomy of whether or not the CI includes no effect, AnCred subjects them to challenge using the CI’s entire inferential content. As the substantive hypothesis under test is for a reduction of risk, the appropriate CPI is (AL, 1), where AL is the advocacy limit calculated from (A4). This leads to the conclusion that Seliger et al.’s interpretation of their nonsignificant finding can be successfully challenged if there exists prior evidence of a protective effect in the range (0.14, 1.0). The authors themselves cite two prior studies with 95% CIs of (0.52, 1.00) and (0.59, 0.98), respectively, both within the required range. Thus, far from being discordant, Seliger et al.’s finding adds to the growing evidence in favor of the protective effect of statins.
4.5 The Inability of p-Values to Incorporate Plausibility
Lacking any direct means of taking account of plausibility, the NHST paradigm is notoriously capable of lending support to patently spurious claims (e.g., Hines Citation1998; Austin et al. Citation2006; Bennett, Miller, and Wolford Citation2009). While often blamed on practices such as data-dredging, failure to take account of plausibility is more pernicious as it can undermine entire areas of research (e.g., Bracken Citation2009; Ioannidis Citation2013).
By setting new findings in context via Bayes’ theorem, AnCred captures in quantitative terms the well-known maxim that “extraordinary claims require extraordinary evidence” (Sagan Citation1980). This is especially valuable when assessing startling claims whose statistical significance conceals an underlying lack of evidential support.
Example: The benefits of prompt administration of clot-busters. In 1992, a UK-based study suggested that death rates from heart attacks could be reduced by 50% if the so-called clot-buster drug anistreplase was given at the scene rather than after arrival in hospital (GREAT Group Citation1992). So large a benefit was surprising: prior experience suggested the reduction in mortality risk was likely closer to 15–20% (Pocock and Spiegelhalter Citation1992). However, the fact that the findings—summarized by an OR of 0.47 with a 95% CI of (0.23, 0.97)—were also statistically significant (p = 0.04) aroused much interest.
The unreliability of inferences based solely on p-values without reference to plausibility is made clear by the application of AnCred. This leads, via (A2), to a CPI of (0.1, 1.0), implying the finding is only credible if there exists prior evidence that prompt administration leads to at least a 90% reduction in mortality. This has no basis in reality. AnCred has thus cut through the statistical significance to focus on the startling lack of evidential weight behind the headline figure, due to both the width of the CI and how close it comes to encompassing no effect. However, the study’s failure to provide credible evidence for an effect does not imply it is worthless; as with the nonsignificant finding in the glioma/statin study, it still contains some evidential weight. As Pocock and Spiegelhalter showed, this can be extracted using conventional Bayesian analysis, which pointed to a much more modest effect size similar to that found in a subsequent meta-analysis (Morrison et al. Citation2000). In this example, AnCred serves to alert researchers to the weakness of the original evidence, the need to avoid using statistical significance as a proxy for the truth of the substantive hypothesis, and the value in carrying out a full Bayesian analysis.
4.6 Significance as an Unsafe Basis for Scientific Conclusions
Goodman (Citation2008) argues that the overarching misconception about NHST is that statistical significance forms a suitable basis for scientific conclusions or policy. This has led to the bizarre situation of each new study often being seen as in some sense superseding all that went before. While flattering for researchers and journal editors, this is a parody of the notion of scientific insight flowing from the accumulation of reliable evidence. It also threatens trust in the scientific process among policy-makers and the public alike (Devlin Citation2017). Nevertheless, the ubiquity of NHST continues to feed “insights” into the academic and public arena based solely on statistical significance/nonsignificance. In a final illustration of the use of AnCred, I examine a recent and controversial example of the fallacy of using nonsignificance as a proxy for the falsity of the substantive hypothesis, in breach of the well-known maxim “Absence of evidence is not evidence of absence” (Altman and Bland Citation2004).
Example: The effectiveness of stents in angina patients. Introduced in the 1970s and implanted in over 500,000 such patients each year, stents have long been regarded as plausibly and observably beneficial to patients with stable angina. This view has recently been challenged by the outcome of ORBITA, the first blinded randomized controlled trial of the effectiveness of stents (Al-Lamee et al. Citation2018). The primary endpoint was increased exercise time, which was 28.4 sec for those receiving a stent, compared to only 11.8 sec for those in the control group; the summary statistic was the difference of +16.6 sec, with a 95% CI of (–8.9, 42.0) sec. Despite the point estimate being consistent with benefit, the nonsignificance of the finding (p = 0.2) led the researchers to conclude that stents do not increase exercise time, with positive results from previous studies possibly being a placebo effect. An accompanying commentary (Brown and Redberg Citation2017) went even further, described the implications as “profound and far-reaching,” with the findings showing “unequivocally” the absence of benefit compared to other therapies, and requiring “all cardiology guidelines to be revised.”
Many cardiologists expressed surprise at the findings. Some questioned the wisdom of overturning decades of practice on the basis of a study of 200 patients; others raised technical issues. Remarkably few commentators noted, however, that the point estimate of benefit of +16.6 sec is clearly consistent with genuine efficacy, albeit of questionable value given the risks involved in stent operations. In addition, the finding was not set in context, despite its implausibility in light of prior experience and the relatively broad CI, both of which suggest the nonsignificance is potentially misleading.
By exploiting the full inferential content of the summary statistic, AnCred circumvents the “null effect” fallacy encouraged by nonsignificant results. It also allows the findings to be put in quantitative context. Applying (A3) to the summary CI leads to an AL of +115 sec. So high a level shows that the ORBITA evidence, while valuable, is too weak to undermine the credibility of claims that stents provide clinically meaningful benefit.
Thus, contrary to the impression created by the standard misinterpretation of nonsignificance, ORBITA provides no compelling justification for revising cardiology guidelines. Rather, it points to a small positive level of benefit. This is of course hinted at by the point value of the 95% CI, but the NHST paradigm led both the researchers and commentators to focus solely on the nonsignificance of the finding—that is the location of just one of the CI bounds—and then misinterpret this as evidence of no benefit. In contrast, by making full use of the inferential content of the CI, AnCred allows the result to be in the context of existing insight. In the process, it counters the misguided practice of regarding a single, modest but valuable contribution to knowledge as a dichotomously definitive “fact.”
5 Conclusion
In his commentary to the ASA statement, Goodman (Citation2016a) states:
“What follows this statement is as or more important than the statement itself…We need to formulate a vision of what success looks like, and how we will get there. If not, we can start drafting the language of the 2116 ASA statement tomorrow.”
If the statement is to succeed where previous attempts at reform have failed, the reasons for those past failures must be addressed. The “publish or perish” research milieu encourages the use of inappropriate inferential practices (see, e.g., Smaldino and McElreath Citation2016) as “poor methods get results” (Horton Citation2015). Other barriers include a reluctance to move beyond basic statistical training (Schwab et al. Citation2011) and incredulity that so prevalent a technique as NHST can be seriously flawed (Hubbard Citation2016b).
This article has examined the extent to which the use of AnCred alongside current practices can overcome these barriers. Using real-life case-studies, I have highlighted the following practical benefits offered by AnCred:
It provides researchers with a principled means for going beyond familiar NHST-based methods, extracting more insight from them while requiring only modest changes to statistical training.
The Bayesian framework underpinning AnCred shifts the focus of inference to the substantive hypothesis rather than the null, and leads to straightforward interpretations of findings based on familiar summary statistics.
This in turn provides enhanced protection against common but recalcitrant inferential fallacies resulting from using NHST in isolation.
Under AnCred, simplistic assessment of evidential weight based on width of CI or sample size is replaced by a more nuanced quantitative assessment based on SLs and ALs.
By “unpacking” the weight of evidence in CIs in this way, AnCred identifies situations where statistically significant evidence for a nonzero effect requires an unjustifiable level of support from prior evidence to achieve credibility.
AnCred reduces the incentive for practices such as data dredging and p-hacking by extracting valuable insight from nonsignificant findings, often dismissed as “null” outcomes.
This in turn reduces the risk of such findings going unreported, a notorious cause of publication bias, waste of research resources, and scientific misconduct.
At the same time, AnCred addresses broader concerns about the misuse of NHST by the research community:
By setting new findings in the broader context of existing insight, AnCred combats the common but false perception of statistical significance/nonsignificance as synonymous with the “truth” or otherwise of a substantive hypothesis.
This in turn encourages the view that, regardless of their statistical significance/nonsignificance, findings from well-conducted studies are all contributions to the accumulation of insight, rather than definitive, standalone conclusions that supersede all that came before.
The use of AnCred ameliorates the so-called replication crisis by extending the assessment of findings beyond simplistic dichotomization as statistically significant/nonsignificant, while bringing more clarity to the concept of “discordant” studies.
The concepts of SL and AL eliminate the need to use such flawed notions as “borderline” significance and post-hoc power to explain disappointingly “negative” study outcomes.
The combination of evidential weight and prior evidence used in AnCred subjects weak and implausible claims to the maxim “extraordinary claims require extraordinary evidence.”
The above features constitute a checklist for comparing AnCred with other proposals for moving toward a post p < 0.05 era (e.g., Goodman Citation2016b; Benjamin et al. Citation2018; Colquhoun Citation2018). Like any such proposal, however, AnCred is based on principles and assumptions that can be challenged. Notably, it models definitions of fair-minded skepticism and advocacy using normal distributions, and uses 95% CIs to produce assessments of credibility at the 95% level. These choices are pragmatic, in that they lead to computational simplicity and retain a familiar standard whose ubiquity suggests widespread acceptability. They are not mandatory, however; as noted in the Appendix, the principles behind AnCred can be extended to other distributions and credibility levels.
Perhaps the most obvious potential criticism of AnCred is that the concept of credibility simply replaces statistical significance as a means of dichotomizing findings. However, it should be stressed that dichotomization per se has never been the problem with NHST; it is the actions that flow from it. The categorization of a finding as statistically significant depends solely on the finding itself, takes no account of context or plausibility and is based on a universal (if widely misinterpreted) cut-off. As such, statistical significance will sustain a sharp and incontrovertible dichotomy—a feature which has encouraged the belief that it is equivalent to the dichotomy of the reality or otherwise of an effect (Fisher Citation1929). In contrast, categorization of a finding as credible is both conditional and context dependent. It depends on the size of effect found, its uncertainty, and its relationship to existing knowledge—which is itself open to discussion in terms of selection and aggregation. As such, it offers no basis for a sharp and incontrovertible dichotomization based solely on the finding itself. Instead, the credibility of any given finding is open to debate and challenge by the research community. Credibility thus reflects the realities of the scientific enterprise, which approaches truth asymptotically, not peremptorily.
It may be argued that AnCred does not go far enough, in that it stops short of subjecting every finding to a full Bayesian analysis. The merits of having a standardized conservative framework for assessing new findings should not be under-estimated, however—not least because it gives continuity with conventional practice, whereby researchers perform an initial assessment of their findings. In any case, AnCred does not preclude more sophisticated analysis: indeed, it encourages it via its use of CIs, which are far more informative than p-values. There is no shortage of guidance on how to perform such analysis—for those motivated to do so. It is hoped that AnCred will provide such motivation by showing how even relatively elementary techniques beyond the NHST paradigm bring major benefits such as extracting more inferential content from standard summary statistics, and reduced risk of misinterpretation of the implications.
AnCred is not merely “quick and dirty Bayes,” however. Its use of the inversion of the central theorem addresses the long-standing debate over setting appropriate priors that bedevils even the most sophisticated Bayesian analyses. The inversion makes the prior needed to achieve credibility immediately clear and thus available to all for debate. By moving beyond the use of uninformative priors or priors based on expert elicitation, AnCred thus makes more of the inferential power of Bayesian methods, while increasing their transparency.
This article has examined the application of AnCred to basic inferential challenges, but there is clearly scope for further development, for example, involving different study designs and nonnormal distributions. Using AnCred to re-examine implausible, “negative” and “discordant” claims based on NHST in the existing research literature may also prove illuminating.
AnCred is not a panacea for the inferential ills of the research community. It may, however, encourage researchers to move beyond NHST and explore the statistical armamentarium now available to answer the central question of research: what does our study tell us?
Acknowledgments
I am indebted to Stephen Senn for prompting me to develop the ideas discussed here, to Ronald Wasserstein and David Spiegelhalter for their interest and encouragement, and to Denise Best, Doug Altman, Leo Held, Sander Greenland, Tom Louis, and Paul Parsons for valuable discussions. The final version benefited greatly from the comments of two anonymous referees and the editor and associate editor of TAS.
I dedicate this article to the memory of my friend and fellow member of the Summertown Soup Club, Doug Altman (1948–2018).
Related Research Data
References
- Al-Lamee, R., Thompson, D., Dehbi, H. M., Sen, S., Tang, K., Davies, J., Keeble, T., Mielewczik, M., Kaprielian, R., Malik, I. S., and Nijjer, S. S. (2018), “Percutaneous Coronary Intervention in Stable Angina (ORBITA): A Double-Blind, Randomised Controlled Trial,” The Lancet, 391, 31–40. DOI: 10.1016/S0140-6736(17)32714-9.
- Altman, D. G., and Bland, M. J. (2004), “Confidence Intervals Illuminate Absence of Evidence,” BMJ, 328, 1016–1017.
- Austin, P. C., Mamdani, M. M., Juurlink, D. N., and Hux, J. E. (2006), “Testing Multiple Statistical Hypotheses Resulted in Spurious Associations: A Study of Astrological Signs and Health,” Journal of Clinical Epidemiology, 59, 964–969. DOI: 10.1016/j.jclinepi.2006.01.012.
- Baker, M. (2016), “1,500 Scientists Lift the Lid on Reproducibility,” Nature, 533, 452–454. DOI: 10.1038/533452a.
- Benjamin, D. J., Berger, J. O., Johannesson, M., Nosek, B. A., Wagenmakers, E. J., Berk, R., Bollen, K. A., Brembs, B., Brown, L., Camerer, C., and Cesarini, D. (2018), “Redefine Statistical Significance,” Nature Human Behaviour, 2, 6–10. DOI: 10.1038/s41562-017-0189-z.
- Bennett, C. M., Miller, M. B., and Wolford, G. L. (2009), “Neural Correlates of Interspecies Perspective Taking in the Post-Mortem Atlantic Salmon: An Argument for Multiple Comparisons Correction,” Neuroimage, 47, S125. DOI: 10.1016/S1053-8119(09)71202-9.
- Bracken, M. B. (2009), “Why Are So Many Epidemiology Associations Inflated or Wrong? Does Poorly Conducted Animal Research Suggest Implausible Hypotheses?,” Annals of Epidemiology, 19, 220–224. DOI: 10.1016/j.annepidem.2008.11.006.
- Brown, D. L., and Redberg, R. F. (2017), “Last Nail in the Coffin for PCI in Stable Angina?,” The Lancet, 391, 3–4. DOI: 10.1016/S0140-6736(17)32757-5.
- Carlin, B. P., and Louis, T. A. (1996), “Identifying Prior Distributions That Produce Specific Decisions, With Application to Monitoring Clinical Trials,” in Bayesian Analysis in Statistics and Econometrics: Essays in Honor of Arnold Zellner, eds. D. Berry, K. Chaloner, and J. Geweke, New York: Wiley, pp. 493–503.
- Colquhoun, D. (2018), “The False Positive Risk: A Proposal Concerning What to Do About p-Values,” arXiv no. 1802.04888.
- Cumming, G. (2008), “Replication and p Intervals: p Values Predict the Future Only Vaguely, But Confidence Intervals Do Much Better,” Perspectives on Psychological Science, 3, 286–300. DOI: 10.1111/j.1745-6924.2008.00079.x.
- Cumming, G., Williams, J., and Fidler, F. (2004), “Replication and Researchers’ Understanding of Confidence Intervals and Standard Error Bars,” Understanding Statistics, 3, 299–311. DOI: 10.1207/s15328031us0304_5.
- Devlin, H. (2017), “Exaggerations Threaten Public Trust in Science, Says Leading Statistician,” Guardian.com, available at www.tinyurl.com/Spiegelhalter-interview.
- Eyding, D., Lelgemann, M., Grouven, U., Härter, M., Kromp, M., Kaiser, T., Kerekes, M.F., Gerken, M. and Wieseler, B. (2010), “Reboxetine for Acute Treatment of Major Depression: Systematic Review and Meta-Analysis of Published and Unpublished Placebo and Selective Serotonin Ruptake Inhibitor Controlled Trials.” BMJ, 341, c4737. DOI: 10.1136/bmj.c4737.
- Fisher, R. A. (1929) “The Statistical Method in Psychical Research,” Proceedings of the Society for Psychical Research, 39, 189–192.
- Gaist, D., Hallas, J., Friis, S., Hansen, S., and Sørensen, H. T. (2014), “Statin Use and Survival Following Glioblastoma Multiforme,” Cancer Epidemiology, 38, 722–727. DOI: 10.1016/j.canep.2014.09.010.
- Gardner, M. J., and Altman, D. G. (1986), “Confidence Intervals Rather Than P Values: Estimation Rather Than Hypothesis Testing,” British Medical Journal, 292, 746–750. DOI: 10.1136/bmj.292.6522.746.
- Good, I. J. (1950), Probability and the Weighing of Evidence, London, UK: Griffin, pp. 35–36.
- Goodman, S. N. (1992), “A Comment on Replication, P-Values and Evidence,” Statistics in Medicine, 11, 875–879. DOI: 10.1002/sim.4780110705.
- Goodman, S. N. (2008), “A Dirty Dozen: Twelve P-Value Misconceptions,” Seminars in Hematology, 45, 135–140. DOI: 10.1053/j.seminhematol.2008.04.003.
- Goodman, S. N. (2016a), “The Next Questions: Who, What, When, Where, and Why?,” Online Commentary to Wasserstein and Lazar (2016).
- Goodman, S. N. (2016b), “Aligning Statistical and Scientific Reasoning,” Science, 352, 1180–1181. DOI: 10.1126/science.aaf5406.
- Goodman, S. N., and Berlin, J. A. (1994), “The Use of Predicted Confidence Intervals When Planning Experiments and the Misuse of Power When Interpreting Results,” Annals of Internal Medicine, 121, 200–206. DOI: 10.7326/0003-4819-121-3-199408010-00008.
- GREAT Group (1992), “Feasibility, Safety, and Efficacy of Domiciliary Thrombolysis by General Practitioners: Grampian Region Early Anistreplase Trial,” British Medical Journal, 305, 548–553.
- Greenland, S. (2011), “Null Misinterpretation in Statistical Testing and Its Impact on Health Risk Assessment,” Preventative Medicine, 53, 225–228. DOI: 10.1016/j.ypmed.2011.08.010.
- Greenland, S. (2017), “A Serious Misinterpretation of a Consistent Inverse Association of Statin Use With Glioma Across 3 Case-Control Studies,” European Journal of Epidemiology, 32, 87–88. DOI: 10.1007/s10654-016-0205-z.
- Greenland, S., Senn, S. J., Rothman, K. J., Carlin, J. B., Poole, C., Goodman, S. N., and Altman, D. G. (2016), “Statistical Tests, P Values, Confidence Intervals, and Power: A Guide to Misinterpretations,” European Journal of Epidemiology, 31, 337–350. DOI: 10.1007/s10654-016-0149-3.
- Held, L. (2013), “Reverse-Bayes Analysis of Two Common Misinterpretations of Significance Tests,” Clinical Trials, 10, 236–242. DOI: 10.1177/1740774512468807.
- Held, L. (2018), “A New Argument for p < 0.005,” arXiv no. 1803.10052.
- Hines, T. M. (1998), “Comprehensive Review of Biorhythm Theory,” Psychological Reports, 83, 19–64. DOI: 10.2466/pr0.1998.83.1.19.
- Hoekstra, R., Morey, R. D., Rouder, J. N., and Wagenmakers, E. J. (2014), “Robust Misinterpretation of Confidence Intervals,” Psychonomic Bulletin & Review, 21, 1157–1164. DOI: 10.3758/s13423-013-0572-3.
- Hoenig, J. M., and Heisey, D. M. (2001), “The Abuse of Power: The Pervasive Fallacy of Power Calculations for Data Analysis,” The American Statistician, 55, 19–24. DOI: 10.1198/000313001300339897.
- Horton, R. (2015), “Offline: What Is Medicine’s 5 Sigma?,” Lancet, 385, 1380. DOI: 10.1016/S0140-6736(15)60696-1.
- Hubbard, R. (2016a), Corrupt Research: The Case for Reconceptualizing Empirical Management and Social Science. Thousand Oaks, CA: Sage, pp. 209–213.
- Hubbard, R. (2016b), Corrupt Research: The Case for Reconceptualizing Empirical Management and Social Science. Thousand Oaks, CA: Sage, pp. 232–234.
- Ioannidis, J. P. A. (2013), “Implausible Results in Human Nutrition Research,” BMJ, 347, I6698
- Matthews, R. A. J. (2001a), “Why Should Clinicians Care about Bayesian Methods?,” Journal of Statistical Inference and Planning, 94, 43–58.
- Matthews, R. A. J. (2001b), “Methods for Assessing the Credibility of Clinical Trial Outcomes,” Drug Information Journal, 35, 1469–1478. DOI: 10.1177/009286150103500442.
- Matthews, R. A. J. (2018) “Beyond ‘Significance’: Principles and Practice of the Analysis of Credibility,” Royal Society Open Science, 5, 171047. DOI: 10.1098/rsos.171047.
- Matthews, R. A. J., Wasserstein, R., and Spiegelhalter, D. (2017), “The ASA’s P-Value Statement, One Year On,” Significance, 14, 38–41. DOI: 10.1111/j.1740-9713.2017.01021.x.
- Morrison, L. J., Verbeek, P. R., McDonald, A. C., Sawadsky, B. V., and Cook, D. J. (2000), “Mortality and Prehospital Thrombolysis for Acute Myocardial Infarction: A Meta-Analysis,” Journal of the American Medical Association, 283, 2686–2692. DOI: 10.1001/jama.283.20.2686.
- Nuzzo, R. (2014), “Scientific Method: Statistical Errors,” Nature, 506, 150–152. DOI: 10.1038/506150a.
- Pocock, S. J., and Spiegelhalter, D. J. (1992), “Domiciliary Thrombolysis by General Practitioners,” British Medical Journal, 305, 1015. DOI: 10.1136/bmj.305.6860.1015.
- Rothman, K. J. (1978), “A Show of Confidence,” New England Journal of Medicine, 299, 1362–1363. DOI: 10.1056/NEJM197812142992410.
- Rothman, K. J., Greenland, S., and Lash, T. L. (Eds.) (2008), Modern Epidemiology, Philadelphia: Lippincott Williams & Wilkins, chapter 18.
- Sagan, C. (1980), Broca’s Brain: Reflections on the Romance of Science, New York: Random House, p. 73, chapter 5.
- Schwab, A., Abrahamson, E., Starbuck, W. H., and Fidler, F. (2011), “Perspective: Researchers Should Make Thoughtful Assessments Instead of Null-Hypothesis Significance Tests,” Organization Science, 22, 1105–1120. DOI: 10.1287/orsc.1100.0557.
- Seliger, C., Meier, C. R., Becker, C., Jick, S. S., Bogdahn, U., Hau, P., and Leitzmann, M. F. (2016), “Statin Use and Risk of Glioma: Population-Based Case–Control Analysis,” European Journal of Epidemiology, 31, 947–952. DOI: 10.1007/s10654-016-0145-7.
- Smaldino, P. E., and McElreath, R. (2016), “The Natural Selection of Bad Science,” Royal Society Open Science, 3, 160384. DOI: 10.1098/rsos.160384.
- Spiegelhalter, D. J. (2004), “Incorporating Bayesian Ideas Into Health-Care Evaluation,” Statistical Science, 19, 156–174. DOI: 10.1214/088342304000000080.
- Spiegelhalter, D. J., Abrams, R., and Myles, J. P. (2004) Bayesian Approaches to Clinical Trials and Health-Care Evaluation, Chichester: Wiley & Sons, chapter 3.
- Wagenmakers, E.-J., Verhagen, J., Ly, A., Bakker, M., Lee, M. D., Matzke, D., Rouder, J. N., and Morey, R. D. (2015), “A Power Fallacy,” Behavior Research Methods, 47, 913–917. DOI: 10.3758/s13428-014-0517-4.
- Wasserstein, R. L., and Lazar, N. A. (2016), “The ASA’s Statement on P-Values: Context, Process, and Purpose,” The American Statistician, 70, 129–133. DOI: 10.1080/00031305.2016.1154108.
Appendix
What follows is a summary of the theory underpinning AnCred and its principal results; for full derivations, the reader is referred to Matthews (Citation2018).
A1: Motivating Principles
AnCred seeks to provide researchers with a simple, intuitive and versatile means of assessing the credibility of effect sizes found by standard study designs. To achieve these goals, AnCred takes as input the familiar summary statistic of CIs, and extracts from them inferential content that “adds value” to the standard NHST-based concepts of statistical significance and nonsignificance. This is done through an inversion of Bayes’ theorem, allowing the deduction of the prior needed for a given finding to constitute credible evidence for the existence of an effect, in the form of a posterior distribution that excludes no effect.
The required inversion is performed with the likelihood and the prior modelled as normal distributions, widely used to address standard inferential issues concerning means, proportions and ratios. They are also conjugate distributions, which in the case of AnCred leads to closed analytic results requiring no specialized computation. Mathematically, the inversion requires specification of the location and scale parameters of the prior distribution, and in AnCred this is achieved by applying the Principle of Fair-Minded Challenge (PFMC) to the two situations of statistically significant and nonsignificant findings; I now consider each in turn.
A2: The Case of Statistically Significant Findings
Here the PFMC implies challenging claims to have found a statistically significant nonzero effect on the basis of fair-minded skepticism. This is modelled by a prior distribution centered on no effect, but whose tails reflect the fair-minded concession that there is a finite probability that a nonzero effect exists. The resulting CPI is shown in . For findings in the form of a statistically significant difference in a mean or proportion expressed as a CI of (L, U), the CPI has lower and upper bounds (–SL, +SL) where SL is the skepticism limit given by(A1)
(A1)
A finding provides credible evidence of a nonzero effect if prior evidence exists for minimum effect sizes lying outside the skeptical CPI. For example, if the prior evidence for a positive effect is summarized (via, say, a meta-analysis) by a 95% CI of (Lo, Uo), then the finding is credible at the same level if Lo > SL. As (A1) shows, the width of the CPI is dictated by the evidential weight of the data, as indicated by the width and location of the CI summarizing the data. The stronger the evidence of a genuine effect, the tighter the CPI, putting skeptics of an effect under greater constraint. In colloquial terms, they must invoke more extreme levels of skepticism about effect sizes to “drag” the posterior distribution back to the no effect line.
The corresponding expression for statistically significant ratios can be found by applying the transformation etc., resulting in a CPI with bounds (1/SL, SL) where if U and L are expressed as ORs,
(A2)
(A2)
Note that the level of credibility reflected in the SL is set by the summary statistic: for example, if SL is calculated from a 90% CI, then (A2) is a 90% credibility level, etc.
As the CPI for skepticism is centered on no effect, it represents a conservative standard for assessing the credibility of a statistically significant result, reflecting the view that the most likely effect size is zero. As such, a finding may still be credible if only a proportion of the prior evidence lies inside the CPI; those wishing to demonstrate this can make their case via a conventional Bayesian analysis specific to the findings and prior evidence.
A3: The Case of Statistically Nonsignificant Findings
Here, the PFMC involves challenging a nonsignificant finding on the basis of fair-minded advocacy of the original substantive hypothesis. This is modelled by a prior distribution reflecting belief that despite the nonsignificance, a nonzero effect size still exists, albeit confined to an interval extending from no effect to some finite bound. This reflects fair-mindedness in the sense that, despite the advocates’ belief in some level of effect, they concede that its magnitude must have a finite limit. The resulting CPI is then the range of prior effect sizes capable of turning the nonsignificant finding into credible evidence for a nonzero effect. As such advocacy can be of effects either greater or less than the null, the CPI must reflect the sign as well as magnitude of the substantive hypothesis. For conciseness, I focus on the case where the substantive hypothesis implies differences in means exceeding zero and ratios exceeding unity (e.g., better test scores; higher survival rates); the results where these inequalities are reversed follow by symmetry. The CPI for nonsignificant differences in means and proportions is then (0, AL) where AL is the advocacy limit given by(A3)
(A3)
The CPI for substantive hypotheses of ORs > 1 is (1, AL) where AL is given by(A4)
(A4) the level of credibility again being set by the summary statistic, with 95% CIs leading to ALs for 95% credibility etc. The width of the advocacy CPI again depends on the evidential weight of the data, such that the stronger the evidence against a positive effect, the narrower the CPI; see .
If prior evidence points to effect sizes lying wholly within the advocacy CPI, the finding can be deemed credible evidence for a nonzero effect, despite its nonsignificance. For example, if the prior evidence for a positive effect is summarized by an OR 95% CI of ( and both Lo and Uo lie within the relevant advocacy CPI—that is,
AL—then the finding is credible evidence for a positive effect, despite its nonsignificance. On the other hand, the above expressions for AL show that a finding cannot provide credible evidence for the hypothesized effect under AnCred if the point value M lies on the other side of the null line from the hypothesized effect. Instead, it provides evidence for the opposite effect (e.g., decreased rather than increased test-scores), and this is credible if it meets the criteria set by AnCred, this time with the CPI transformed from (1, AL) → (AL, 1).
As with the skepticism CPI, AnCred imposes a conservative bound on the range of prior evidence needed to provide credible evidence of a nonzero effect, in this case because the Advocacy CPI has one bound fixed at no effect. If prior evidence exists for effect sizes substantially exceeding no effect, this allows the finding to retain credibility for values beyond AL. Again, those seeking to argue for this must make their case via a Bayesian analysis specific to the findings and prior evidence.
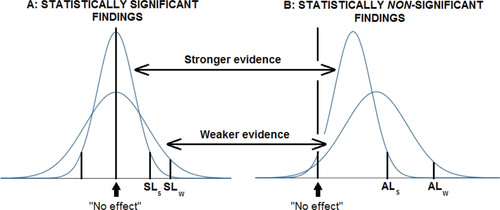
summarizes the use of AnCred for both statistically significant and nonsignificant findings, and shows the impact of evidence from earlier studies on findings with different weight of evidence.
A4: The Case of No Relevant Prior Evidence
In the case of entirely novel findings, there may be no obviously relevant prior evidence with which the CPI can be compared to establish credibility. In such cases, AnCred provides a framework leading to the assessment of intrinsic credibility (Matthews Citation2018, sect. 6). Here, the CPI calculated from the 95% CI is compared to the point value of the effect size, given by the point value of the CI. The application of AnCred then proceeds as usual, with the location of this point value relative to the CPI determining intrinsic credibility. An example is given in Example 2 of Section 3.
As shown in the above reference, the assessment can be performed by a simple rule of thumb: entirely novel findings possess intrinsic credibility if they have p-values less than around 0.01. It should be stressed, however, that this rule of thumb has no interpretation under NHST. Lack of intrinsic credibility means simply that the novel finding in question currently lacks the evidential weight to make its case without external support. Such support may emerge following publication of the finding, thus allowing a reassessment of the finding using AnCred.
Very recently, Held (Citation2018) has developed an alternative approach to intrinsic credibility which casts intriguing new light on proposals to lower the threshold for significance of novel findings to p ≤ 0.005 (Benjamin et al. Citation2018).
A5: Extension of AnCred to Other Inferential Challenges
This article has focused on the application of AnCred in the most widely used situation encountered in research: the assessment of evidence for nonzero effects expressed as differences in means, proportions, or as ORs. The basic principle of inverting Bayes’ theorem and deducing the prior needed for posterior credibility at the 95% level can be applied to other inferential questions, such as the credibility of claims of worthwhile benefit. However, even with conjugate distributions the outcome typically lacks the analytic elegance made possible by the normal distribution, and the use of software packages is likely to be required for general acceptance by the research community. It is hoped that such developments will be encouraged by the potential benefits of using AnCred explored in this article.
Fig. A1 Under AnCred, statistically significant claims summarized by 95% CIs are subjected to fair-minded skeptical challenge represented by a prior distribution centered on no effect, whose 2.5% and 97.5% quantiles represent the critical prior interval. Weak evidence for the existence of an effect leads to relatively high skepticism limits (SLs), giving plenty of scope for skeptical challenge using prior knowledge. Strong evidence, in contrast, leads to tight CPIs, making skeptical challenge more demanding.
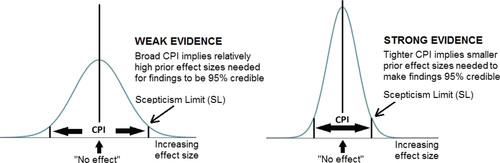
Fig. A2 The advocacy prior distribution for assessing claims of statistical nonsignificance summarized by 95% CIs. For substantive hypotheses of a positive effect, the lower bound of the advocacy CPI is fixed at no effect, while the upper bound—the advocacy limit (AL)—is such that the CPI encompasses 95% of the prior distribution capable of making the finding credible evidence of a positive effect. Weak evidence against such an effect—that is a broad, nonsignificant 95% CI with a lower bound pointing to a small negative effect—leads to a relatively broad CPI, as such findings put little constraint on the prior evidence needed for credibility. Stronger evidence against the substantive hypothesis leads to a tighter CPI, thus constraining advocates to a narrower range of prior support.
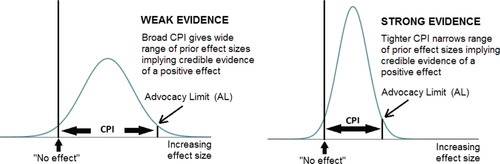
Fig. A3 The effect of prior evidence summarized by the interval (Lo, Uo) on the credibility of findings from different studies. For statistically significant findings (A), if Lo > SLw then the finding is credible evidence of a positive effect whether it came from the stronger or weaker study. If SLs < Lo < SLw, only the finding from the stronger study achieves credibility under AnCred. If Lo < SLs then demonstration of the credibility of the finding requires a Bayesian analysis specific to the study and prior evidence. For statistically nonsignificant results (B), findings still provide credible evidence of a nonzero effect if both Lo and Uolie between no effect and ALs in the case of the stronger study, and ALw for the weaker study. As before, the impact on credibility of prior evidence lying outside these ranges can be assessed using a specific Bayesian analysis.