
Abstract
Marine fuels are consumed worldwide in quantities of more than 200 million tons per year. It is not a uniform product, but rather heterogeneous mixtures of hydrocarbons with a wide range of viscosities. Due to the production processes, marine diesel contains dimethylsiloxanes. These lead to damage to marine exhaust catalysts in connection with combustion reactions in the ships’ engines. A novel analytical method, presented here, was developed that allows to investigate these processes and to monitor the dimethylsiloxane contents in complex marine fuel matrices. The key steps of the analytical procedure are analyte enrichment by solid phase extraction (SPE) using thermally activated silica gel and chromatographic separation and measurement by heart-cutting gas chromatography - mass spectrometry. Authentic reference substances for quantification by standard addition are used for the dimethylsiloxane analytes. The clean-up enabled a 90% reduction of the matrix content in the analysis solutions compared to the initial sample. Recovery rates in the range of 87.8% to 111.4% were determined for all analytes (Si3 to Si9). The detection limits of analytes ranged from 0.06 μg/L to 5.68 μg/L. Values of 0.71 μg/L to 23.6 μg/L were determined for the limits of quantification. The newly designed analytical method was successfully applied to real marine fuel samples. The analytical procedure is to be made available to commercial and industrial laboratories as a practical method for controlling siloxane contents in marine fuels to contribute this way to efficiently functioning marine exhaust gas purification.
Introduction
Currently, about 90% of world trade is carried by sea. This is associated with considerable environmental pollution due to the discharge of pollutants and waste into the waters, ship noise and the possible introduction of non-native organisms (German Federal Environment Agency Citation2023). However, the most significant source of emissions is combustion exhaust from ship propulsion systems. In 2019 alone, a total of 233 million tons of fuel were required for marine purposes (Ershov et al. Citation2022). Heavy as well as gas oils currently represent by far the largest share of the fuels used. According to a 2018 forecast, their share will be 79% in 2030 and a decrease to 33% is expected by 2050. Alternatives include liquefied natural gas (LNG) and CO2-neutral propulsion systems. However, the share of electrically powered cargo ships will remain low in the future (Statista Citation2023).
To counteract the environmental pollution associated with the use of conventional fuels, limits have been introduced for the maximum permissible emissions of sulfur and nitrogen oxides (SOx and NOx). These can be complied with by exhaust gas aftertreatment on board of the ships and by using fuels that burn with lower levels of pollutants. The former option is often associated with the discharge of pollutants filtered from the exhaust stream into the surrounding water body and is therefore not an efficient contribution to emission reduction (German Federal Environment Agency Citation2023). In particular, the required reduction of SOx emissions has therefore led to the development of particularly low-sulfur fuels, so-called ultra-low-sulfur fuel oils (ULSFO). The maximum sulfur content is limited to a mass fraction of 0.1%.
Since the use of these novel fuels, however, shipping companies and catalyst manufacturers have increasingly documented cases in which there has been an unusually rapid reduction in the efficiency of the selective catalytic reduction (SCR) catalysts used to eliminate NOx in the exhaust gas of marine engines. The cause of the observed decrease in NOx conversion efficiency was found to be a thin layer of silica on the affected catalyst surfaces during the R&D project, which this publication is based on. Initially, it was assumed that this layer formation resulted from the presence of so-called catalyst fines in the fuels. These are known to be fine particles containing Si and Al within a zeolite structure, which in this case originate from the fluid catalytic cracking process during crude oil refining. However, it has been shown experimentally that these inorganic particles pass through the SCR exhaust catalyst without the formation of a SiO2 layer and are therefore not associated with catalyst deactivation (Kolb et al. Citation2024).
The focus was then placed on the characterization and analysis of organic silicon compounds, which form inorganic silicon species only during the combustion process in the engine. Organic silicon compounds are widely used in the form of defoamers and additives in oil and gas production and the subsequent refining of crude products. Their low surface tension and low solubility in crude oil predestine them for this application. For economic and technical reasons, these additives are usually not separated from the products again, resulting in the described contamination of the fuels (Dubreuil et al. Citation2017).
Organic silicon compounds from the dimethylsiloxanes substance class were thus identified as the silicon source in the fuels which were deposited in the form of inorganic silicon dioxide in the catalyst block after combustion in the engine. In the systematics of these compounds is shown.
Figure 1. Nomenclature of cyclic and linear dimethylsiloxanes.
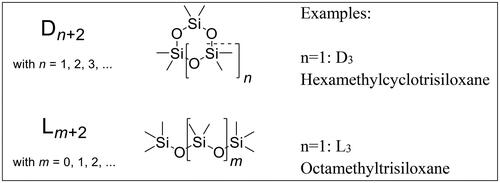
The ISO 8217 (International Organization for Standardization Citation2017) standard currently applicable with regard to the required fuel specifications only contains a maximum permissible sum content for silicon and aluminum in residual fuels for marine use. Depending on the fuel type, a total of 25 mg/kg to 60 mg/kg is permitted. No differentiation is made in the standard with regard to the chemical bonding form of the two elements Si and Al. Thus, as explained above, no conclusions can be drawn concerning possible catalyst damages caused by silicon from the total Si content in the fuel.
As a basis for the comprehensive investigation of the complex processes involved in the damage of marine SCR exhaust catalysts, there was a need to develop an analytical procedure that would enable the single-substance-specific, detection-sensitive quantification of dimethylsiloxanes from the highly variable and complex hydrocarbon matrices of marine fuels. In addition, the method should be designed as simple as possible and feasible with common laboratory equipment to make it available for control tasks in industrial and commercial laboratories. The performance and practical application of this analytical method is described below.
Materials and methods
Characterization of marine fuels of different origin
Viscosity
The kinematic viscosities of the marine fuels were determined with Ubbelohde viscometers (SI Analytics, Mainz, Germany). First, the fuel samples were heated to 40 °C in order to ease the filling of the viscometer. Then, the viscometer, filled with 15 mL of fuel, was kept in a 50 °C water bath for 10 min. For the measurement, the fuel sample was pumped up and afterwards the time was stopped that it took to flow down from one mark to another. The kinematic viscosity was calculated by the equation ʋ = [k · t] with ʋ: kinematic viscosity [mm2/s], k: device constant [mm2/s2], and t: flow time [s]. Each measurement was repeated three times. The relative standard deviation of the measurements was ≤ 1.1%.
Gas chromatography with flame ionization detection
For measurements with a gas chromatograph equipped with a flame ionization detector (7890B GC-FID, Agilent Technologies, Santa Clara, CA, USA) the fuel samples, if necessary for fluidity adjustment, were heated to 40 °C and diluted 1:100 with hexane. In case, a sample was not soluble in total or asphaltenes precipitated out of the solution, the sample was filtered with a syringe filter equipped with a polytetrafluoroethylene (PTFE)-membrane. In , the GC-FID settings are listed.
Table 1. GC-FID settings for ‘fingerprint-analyses’ with marine fuel samples.
Element-analytical measurement of Si
For sample preparation, the fuel samples were tempered to 40 °C and diluted 1:4 (bright, diesel-like) or 1:12 (dark, heavy oil) with o-xylene. The samples were homogenized for 1 min (Vortex) and treated in an ultrasonic bath for 15 min. They were stored at 4 °C and homogenized again directly before measurement.
For quantification of the Si-content, an external calibration with a Si-standard (Si in oil, 1000 µg/g; Thermo Fisher, Kandel, Germany) was used. The Si-standard was diluted in siloxane-free kerosene (Agilent Technologies) to the required concentrations for calibration. The calibration range was 1 mg/L to 100 mg/L. These calibration standards were further diluted 1:4 or 1:12 with o-xylene (Rectopur, >99%; VWR Chemicals, Leuven, Belgium), respectively, according to the fuel samples.
For the determination of the total Si-content of the fuel samples a VISTA-MPX CCD inductively coupled plasma optical emission spectrometer (ICP-OES) (Agilent Technologies, Santa Clara, CA, USA) was used. The ICP-OES was equipped with a seaspray nebulizer and a twister nebulizer chamber. The torch was designed for use with kerosene (tempered, i. d.: 1.4 mm). Kerosene resistant pump tubes consisting of Viton Fluran HCA F-5500-A (Cole-Parmer, St. Neots, United Kingdom) were applied. The instrument settings are summarized in .
Table 2. Settings for analysis of the fuel’s total Si-contents with ICP-OES.
Analysis of dimethylsiloxanes in marine fuels
Solid phase extraction
At the beginning of the analytical procedure, the marine fuel samples were subjected to a clean-up by solid phase extraction. For this purpose, 20 mL disposable syringes (B. Braun SE, Melsungen, Germany) with the syringe plunger removed were used as cartridges which showed no measurable contamination with dimethylsiloxanes. They were filled with a filter paper (Cytiva Whatman™, Freiburg im Breisgau, Germany), a 3 mm layer of sea sand (ultrapure, Merck KGaA, Darmstadt, Germany) and 5 g silica gel (EcoChrom™ MP Silica 63-200, 60 Å, MP Biomedicals Germany GmbH, Eschwege). The filter paper and the overlying layer of sea sand provided a mechanical seal at the bottom of the SPE cartridge, while the silica gel acted as the adsorbent. The silica gel was conditioned and activated at 180 °C for 2 h before use in each case. After filling, the bulk was pressed using a syringe plunger perforated at the bottom. Before use, another 3 mm layer of sea sand was applied to prevent any turbulences in the adsorbent layer while adding sample or solvent. The SPE cartridges were prepared directly before use. The clean-up process of the fuel samples was carried out in four steps. The respective eluent was passed through the column without external pressure gradient.
First, the SPE cartridges were preconditioned with 25 mL n-pentane (SPE fraction F1) followed by the application of 0.5 mL of a fuel sample diluted 1:5 with n-pentane (corresponding to 0.1 mL of pure fuel). The next step included the elution with 30 mL of n-pentane (SPE fraction F2, containing most of the hydrocarbon matrix) followed by the final elution with 55 mL n-pentane/dichloromethane (DCM) mixture (9:1) (SPE fraction F3, containing the analytes).
Eluates collected in pointed flasks with an extended cylindrical tip (SPE fraction F3) were tempered to 25 °C in a water bath. The eluates were concentrated to a volume of 1 mL by evaporation of the solvent under a weak stream of nitrogen and they were then ready for measurement.
Chemicals used
The chemicals listed in were used for the analytical procedure.
Table 3. Chemicals that were used for the analysis of dimethylsiloxanes.
Standard solutions were stored at 5 °C in amber glass vials (Zinsser Analytic, Fürstenfeldbruck, Germany) sealed with screw caps with PTFE seal (Scherf Präzision Europa GmbH, Meiningen, Germany).
Heart-cutting gas chromatography
A 7890B gas chromatograph (GC) equipped with a flame ionization detector (FID) and 5977 A mass selective detector (MSD) (all Agilent Technologies, Santa Clara, USA) was used. A Deans Switch (Agilent Technologies, Santa Clara, USA) was installed to switch between the first column connected to an FID and the second column coupled with an MSD. Substance identification from the acquired scanning mass spectra was performed by comparing the fragmentation patterns with those of the spectral database NIST Mass Spectral Library (version 2.2, June 2014). The associated instrument settings, technical gases, and separation columns used are listed in . In the selected masses and time windows for mass spectrometric analyses performed in single ion monitoring (SIM) mode are given.
Table 4. Instrument settings of the heart-cutting gas chromatography with FID/MSD.
Table 5. SIM-masses and heart-cutting time windows for the analytes D3 - D6 and L3 – L9.
The SIM masses were selected from scan measurements of the dimethylsiloxanes, which were carried out for hexamethylcyclotrisiloxane (D3) to dodecamethylcyclohexasiloxane (D6) as well as octamethyltrisiloxane (L3) to eicosamethylnonasiloxane (L9) with the corresponding standard substances (). Preferably, the highest possible masses with high signal intensity were selected in order to achieve high measurement sensitivity and to minimize the interfering influence of the matrix.
For quantification of the analytes according to the standard addition procedure, known amounts of analytes were added three times in volumes of 0.5, 1.0 and 1.5 µL to the analysis solution with a volume of 100 µL. The analyte concentrations of the solutions used for standard addition were adjusted so that the addition of 1.5 µL doubled to tripled the analyte content in the analysis solution. One sample remained free from the addition of standard solution. The evaluation of the measurement results was carried out by plotting the respective area values of an analysis series against the amount of analyte added. The analyte content in the initial sample could then be determined from the intersection of the regression line with the x-axis.
Results and discussion
Characterization of marine fuels for marine application of different origin
In this context, the term ‘marine application’ refers to diesel engines with a power output between 560 kW and 100 MW. They are divided into high-speed (>1000 rounds per minute (rpm)), medium-speed (300 to 1000 rpm), and low-speed engines (<300 rpm), whereby the first have to be operated with higher-quality fuels (Merker and Teichmann Citation2018).
The marine fuel market is diverse. Nevertheless, following ISO 8217 (International Organization for Standardization Citation2017), the numerous fuels were divided into two categories. These are distillate marine fuels and residual marine fuels. The International Maritime Organization (IMO) used these fuel categories to describe marine fuels (International Maritime Organization Citation2019). Distillate marine fuels are mixtures of light and middle distillates. Various sub-classifications were defined, depending on viscosity. Some of those contain fatty acid methyl esters up to 7 vol%. Distillates are referred to as marine gas oil as they mostly do not contain any residuals. Residual marine fuels offer a cost advantage compared to distillate marine fuels. These are residuals of atmospheric and vacuum distillation. The refineries produce these fuels as cost-effectively as possible. Another common term for residual marine fuels is heavy fuel oil. Increased contents of aromatics, asphaltenes, water, sulfur, ash, and carbon characterize residual marine fuel grades. Higher carbon content is responsible for the higher density and lower calorific value against distillates. H/C ratios of less than factor 2 are possible.
Since 2015, new fuels have entered the market due to the 0.1 wt% emission control area sulfur limit. These ULSFOs have widely varying properties and can be categorized as distillate marine fuels or residual marine fuels, depending on their production. The IMO also reduced the global sulfur limit in 2020. Furthermore, new fuels, called very-low-sulfur fuel oil (VLSFO), appeared on the market with a maximum sulfur content of 0.5 wt%. VLSFOs are either distillate or residual fuels, depending on their properties. Moreover, high-sulfur heavy fuel oil (HSHFO) with sulfur contents of more than 0.5 wt% is still known. This suggested a large heterogeneity of the marine fuels to be investigated.
For the development of an analytical method, the matrix in which the analytes are located should be known. Therefore, the above general systematic data on marine fuels were first substantiated by measuring the viscosities, hydrocarbon compositions, and Si contents of marine fuel samples of various types and origins as examples. Sampling was initiated by the industry and carried out in different countries. The fuel samples were mostly provided without further information. Thus, they represent a random cross-section of marine fuels.
Kinematic viscosities of marine fuel samples
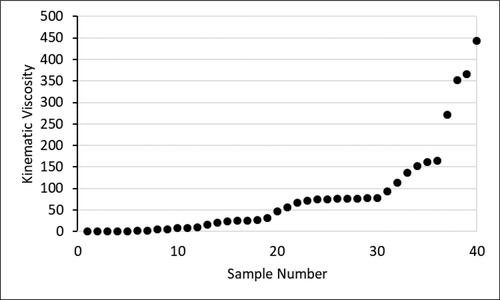
Kinematic viscosities at 50 °C were measured of 36 randomly selected marine fuel samples. The results are summarized in . The four highest values were taken from sample suppliers’ data sheets, measured at 40 °C. The viscosities range from 0.59 mm2/s to 444 mm2/s and show the large heterogeneity of the samples with respect to this property.
Figure 2. Kinematic viscosities of marine fuel samples (mm2/s; 40–50 °C).
Gas chromatographic characterization of hydrocarbon sample matrices
The characteristic patterns of the GC-FID high-temperature (HT) chromatograms are considered as “fingerprints” of the single marine fuels. They give reference to hydrocarbon mixtures that the fuels consist of. Examples are given in . The evenly spaced peaks are from linear alkanes, while the signals of aromatic hydrocarbons occur rather irregularly in between.
Figure 3. HT GC-FID chromatograms of different marine fuel samples (A, B, C), diluted 1:100 in hexane.
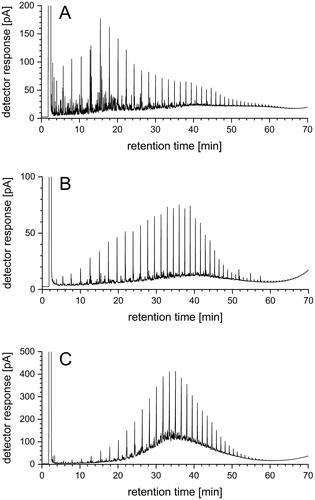
For an evaluation of the fingerprint chromatograms, they were compared to that of an alkane standard solution (not depicted). By this, the longest hydrocarbon chain and the hydrocarbon measured with highest intensity could be identified, respectively. The longest hydrocarbon chain with 50 C-atoms was identified in the fuel sample shown in . On average, the longest hydrocarbon chain had 32 C-atoms and that one measured with highest intensity had 20 C-atoms, when considering all the randomly compiled marine fuel samples. Moreover, the fingerprint chromatograms had different symmetries in the hydrocarbon patterns. Symmetric chromatographic patterns are typical for diesel-like and distillate fuels, as for example depicted in . and represent rather asymmetric chromatographic patterns.
Further evaluation supported by size exclusion chromatography equipped with a refraction index detector revealed that in about half of the marine fuel samples under consideration aliphatic hydrocarbons dominated quantitatively over aromatic compounds and vice versa. By these chromatographic investigations the remarkable heterogeneity of the marine fuel’s matrices was demonstrated as well.
Total silicon content
For the measurement of the total Si content in marine fuel samples, a method designed by Chainet et al. (Citation2011) for light diesel-type samples was further developed. As described above, the measurements were carried out with ICP-OES after sample preparation. Recovery rates between 85% and 108% in different fuels, even at a low concentration of 5 mg Si/L, indicated a good quality of the method. Under best conditions depending on the dilution factor of the sample (1:4 or 1:12), a limit of detection (LOD) of 1 mg/L (3 mg/L if diluted 1:12) and a limit of quantification (LOQ) of 2 mg/L (6 mg/L if diluted 1:12) could be achieved. The precision of the method was determined by doping eight samples of kerosene with 5 mg Si/L. With a relative standard deviation of 3%, a stable precision in series was demonstrated.
In this case, even 63 randomly sampled marine fuel samples were analyzed. Thirtysix of the samples had a Si-concentration of <5 mg/L, seventeen had 5-10 mg Si/L, five had 10-20 mg Si/L, one sample was in the range of 20-30 mg Si/L, and three had 30-40 mg Si/L. The highest Si-concentration found in one sample was 44 mg/L. This corresponds to 44 mg/kg, if one assumes a typical density for heavy oil of 1.01 kg/L at 15 °C according to ISO 8217 (International Organization for Standardization Citation2017).
When using the ICP-OES measurement technique, it is not possible to distinguish between inorganically and organically bound silicon. Thus, also Si was quantified that was contained, for example, in inorganic catalytic fines particles that were demonstrably not involved in damage to the SCR catalyst (Kolb et al. Citation2024). Nevertheless, it should be noted that in only four of 63 marine fuel samples no silicon could be detected above the sample-specific detection limit of 1 to 3 mg/L.
Analysis of dimethylsiloxanes in marine fuels
Solid phase extraction
Prior to GC/MS analysis of the marine fuels, a clean-up of the samples was performed by solid phase extraction. In contrast to untreated samples, a concentration of the analytes was thus achieved with simultaneous removal of a large part of the hydrocarbon matrix.
First, commercial SPE cartridges with different sorbent materials (activated carbon, silica gel, Florisil, amine phase, C18) were compared. For this purpose, a simplified artificially prepared fuel matrix was used. The substances were selected as representatives of short, medium and long chain hydrocarbons (nonane, hexadecane and triacontane) and of mono- and bicyclic aromatics (toluene and naphthalene). One cyclic, one linear siloxane (octamethylcyclotetrasiloxane (D4) and dodecamethylpentasiloxane (L5)) as well as polydimethylsiloxanes (PDMS) were added as model substances for the siloxanes. The aim was to identify the SPE system best suited for the separation of the linear and aromatic hydrocarbons from the siloxanes. The cartridges were conditioned according to specification of the manufacturers and the simplified matrix including the siloxanes was transferred to the cartridges (1 mL per 1 g of sorbent material). Each eluate was collected in small fractions and the separation of the components was analyzed by GC-FID (). The cartridges made of silica gel (SiOH) proved to be most suitable for the separation of linear and aromatic hydrocarbons from the siloxanes.
However, due to irreversible siloxane contamination of all commercially available SPE cartridges investigated, a new method based on self-packed cartridges had to be developed as described in section ′materials and methods′. For this purpose, experiments were carried out in the first step to investigate the elution behavior of the analytes. By conditioning the silica gel for 2 h at 180 °C, a quantitative elution of all dimethylsiloxanes (D4 – D6, L3 – L9) in fraction 3 was achieved. This increase in activity can be explained by the release of water that was previously physically adsorbed on the surface hydroxyl groups of the silica gel. However, a temperature ≥200 °C should be avoided during conditioning, as this would lead to chemical water splitting with a reduction in the number of hydroxyl groups and the formation of additional intramolecular siloxane bridges (Berthod Citation1991). Without the conditioning step, an early partial elution of the analytes into fraction 2 occurred, causing errors in quantification. The conditioning of the silica gel was thus crucial for the separation process. An exception was D3 which could not be detected in any of the fractions after thermal conditioning. To clarify this, a modified repetition of the SPE with activated silica gel was carried out.
After column conditioning (fraction 1), 0.5 mL of a D3 solution in n-pentane with an elevated concentration of 100 ng/µL was added. After completion of the standard elution sequence (fractions 1 to 3), additional elution with 55 mL of pure DCM (fraction 4) and final extraction of the SPE silica gel in an ultrasonic bath with 10 mL of DCM/n-pentane 1:3 (10 min, 37 kHz) were performed. The extract was concentrated to 1 mL of analytical solution analogous to the standard procedure. Analysis was performed by GC/MS in scan mode according to . In fraction 3, only a small proportion of the D3, 2.8%, could be found. By further increasing the elution strength in fraction 4 by changing the eluent to pure DCM, an additional 42.3% could be detected. A final extraction of the column packing material in an ultrasonic bath did not significantly increase the recovery rate (0.08%). Thus, an above-average adsorption on silica was observed for D3, so that it could not be completely desorbed even when increasing the eluent elution strength. Partial decomposition of this substance in contact with the activated silica gel cannot be ruled out either.
Furthermore, the efficiency of the SPE with respect to the separation of the hydrocarbon matrix was checked by GC-FID. For this purpose, a real marine fuel sample was diluted by a factor of 500 with n-pentane as an example. After filtration with a syringe filter, direct analysis by GC-FID was performed. The chromatogram obtained is shown in . The hydrocarbon fingerprint of the sample is clearly visible.
Figure 4. GC-FID chromatogram of a marine fuel oil diluted 1:500 with n-pentane.
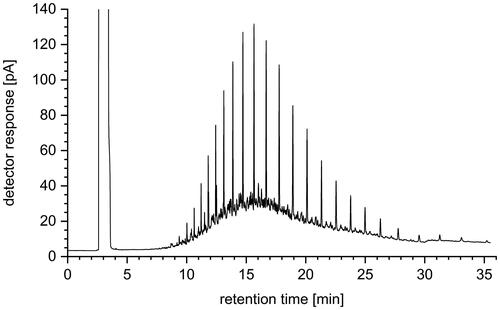
The sample was then subjected to SPE clean-up and the analyte fraction 3 was measured with GC-FID. Prior to this, the fraction, which had been concentrated to 1 mL, was diluted by a factor of 50 with n-pentane. Thus, the 1:10 dilution that took place in conjunction with the SPE also resulted in a dilution factor of 500, providing quantitative comparability between the initial sample and the SPE fraction for efficiency assessment of matrix separation. The corresponding chromatogram is shown in .
Figure 5. GC-FID chromatogram of fraction 3, diluted 1:50 with n-pentane after marine fuel oil SPE clean-up.
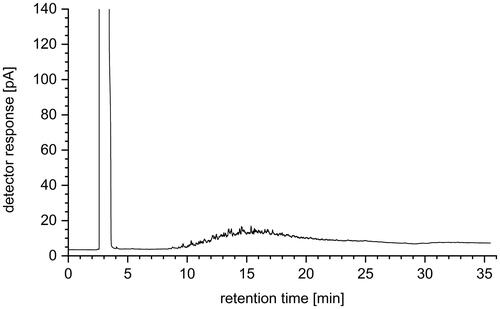
From the comparison of the chromatograms shown in and , it is clear that a large part of the hydrocarbon matrix of the fuel could be removed from the analyte fraction 3, which may contain the siloxanes. According to the addition of all peak areas (except solvent), a 90% reduction of the matrix could be achieved by SPE. In addition, a clearly visible retention of dark colored fuel components in the upper part of the SPE column could be observed during SPE. Thus, contamination of the gas chromatographic system by these low-volatile substances was efficiently prevented in the course of the subsequent analysis.
Heart-cutting gas chromatography with FID/MSD
Due to the very similar chromatographic behavior of the siloxane analytes and the remaining hydrocarbon matrix in the measurement solutions, the heart-cutting technique with two separation columns remained necessary despite the SPE clean-up. In the literature, it is suggested to use two separation columns with different polarity (Tranchida et al. Citation2012). However, in tests with siloxane/matrix standards, it proved advantageous to use two separation columns with nonpolar stationary phases here and to exchange the previously used DB-HeavyWAX with polyethylene glycol phase for a polydimethylsiloxane phase with 5% phenyl substitution (). Advantages resulted from optimized separation performance to comparatively narrow and thus defined peaks, better temperature stability, less column bleeding and thus improved detection sensitivity especially in the posterior retention time range. The elution of all dimethylsiloxanes was carried out baseline separated, so that a completely selective detection of the analytes was possible.
In the next development step, it was intended to perform the analyte quantification by means of external calibration. The lack of correlation between the calibration measurements of the siloxane standards and doped real samples with a known analyte concentration proved to be problematic. Excessive recovery rates in the range of 150% to 500% were permanently observed for all analytes. By additional experiments it was recognized that this was caused by the remaining hydrocarbon matrix. As usual, this could have been compensated by using matrix-matched standards, where the standard solutions are adapted as closely as possible to the analytical solutions in terms of their matrix composition. However, the problem here was that both due to the complexity of marine fuel composition and due to changing fuel types, exact matrix matching was not possible. Therefore, the quantification was carried out according to the standard addition procedure as described under “Materials and methods”.
To determine the recovery rates, a real fuel sample was reconstituted by diluting siloxane-free kerosene to five times its volume with n-pentane and by defined siloxane addition. The solution prepared this way contained 100 pg/µL of each siloxane, which corresponded to a content of 500 µg/L each based on the pure kerosene. Purification was carried out according to the newly developed SPE method. For all quantifications by standard addition method, the volume increase due to addition of the standards to the sample solutions was neglected. The dilution of the sample solutions resulting from the volume increase was at maximum 1.5% by adding 0.5, 1.0 or 1.5 µL standard to 100 µL sample solution. In addition to this defined recovery rate determination, a marine fuel sample was spiked with the siloxane compounds before clean-up. The recovery rates determined for the two samples are given in . In total, they range from 71.2% to 111.4%. According to Vogelgesang and Hädrich (Citation1998), for residue analyses the recovery rates at low concentrations close to the limit of quantification should be between 70% and 120%, according to which the values determined in this work can be regarded as good.
Table 6. Recovery rates of siloxanes D4 – D6 and L3 – L9 determined by standard addition method.
To determine the LOD and LOQ of the siloxanes based on the respective quantifier ion, highly diluted standards were measured by heart-cutting GC/MS and the siloxane-specific signal-to-noise (S/N) ratio was determined for each concentration. Linear fits were created from the S/N ratio plotted against analyte concentration, and the respective siloxane concentrations were determined from these fits which produced a signal that was three- and tenfold greater than the noise. The results obtained by this method for D4 – D6 and L3 – L9 are listed in .
Table 7. Limits of detection and quantitation determined for D4 – D6 and L3 – L9 for matrix-free standard solutions.
The determined detection limits ranged from 0.06 µg/L (D4) to 5.68 µg/L (L9). For the limits of quantification, values from 0.71 µg/L (L3) to 23.6 µg/L (octadecamethyloctasiloxane (L8)) were determined.
Chainet et al. (Citation2011, Citation2012) obtained detection limits for single silicon compounds ranging from 5 to 33 µg/kg with a two-dimensional gas chromatography/time of flight mass spectrometry (GC-GC/TOFMS) device. In a gasoline sample they found 1627 µg D4/kg and 101 µg decamethylcyclopentasiloxane (D5)/kg as well as 105 µg decamethyltetrasiloxane (L4)/kg in a naphtha sample.
Analysis of real marine fuel samples
To demonstrate the applicability of the analytical procedure described here, six real marine fuel samples were selected and analyzed as examples in order to determine the methodically accessible dimethylsiloxanes qualitatively and quantitatively. The total silicon content of the samples was already known from measurements by ICP-OES.
In the following, the fuel samples are described by information given in . The densities of the fuels required for this purpose were determined by weighing. The siloxane contents of the fuel samples in relation to the respective pure fuel in µg/L are listed in .
Table 8. Properties of six marine fuel samples to be analyzed for dimethylsiloxanes.
Table 9. Siloxane contents in [μg/L] of the real marine fuels A to F.
Fuels A and B showed a quite similar pattern with regard to siloxane content. Thus, both samples contained approx. 3000 µg of dimethylsiloxanes per liter of fuel. The most abundant compound in each case was D4 with 2210 µg/L (A) and 2000 µg/L (B) followed by D5 with 515 µg/L and 475 µg/L, respectively, according to standard addition method. All other siloxanes were present in smaller amounts or below the limit of detection.
The silicon content of sample C determined by ICP-OES was 34 mg/L, the third highest of all 63 available fuel samples. All dimethylsiloxanes included in this analytical procedure could be detected and quantified in the samples C and D. The most abundant analyte was D4 at 11400 µg/L (C) and 3030 µg/L (D). The second most abundant compound was D5 with 5410 µg/L (C) and 2160 µg/L (D).
In addition, two other fuel samples E and F were analyzed. However, no siloxanes above detection limit could be determined in either sample. Common to all six real samples analyzed was that the total silicon content could not or only partially be accounted for by the dimethylsiloxanes contained. It can thus be assumed that additional silicon was contained in the fuels in other binding forms, such as catalyst fines or PDMS.
Analytical quality control
Siloxanes are used in a large number of products in the human environment. Due to their properties, they are known to be detectable almost everywhere (Varaprath, Stutts, and Kozerski Citation2006). Therefore, all chemicals, solvents, adsorbents, working materials, apparatus and measuring instruments used in connection with siloxane analysis were continuously checked for contamination by means of blank value measurements. Glassware was pre-cleaned in the laboratory dishwasher and then rinsed with DCM and n-pentane. Volumetric flasks were filled with DCM, cleaned for 10 min in an ultrasonic bath, and then rinsed with n-pentane. Pasteur pipettes were pre-rinsed with either n-pentane or the liquid to be pipetted before use. To avoid sample contamination, the use of laboratory and personal care products containing siloxanes, such as ground joint grease, silicone seals, hand cream, etc., was avoided.
A blank determination of the entire SPE process was carried out according to the SPE procedure described, but without the sample addition in step 2. Here, the low molecular weight siloxanes D4, D5 and D6 were found in the concentration range of the respective detection limits, irrespective of the pretreatment of the silica gel. The peak areas determined were approximately constant during all measurements and were thus subtracted as blank values from the later analysis results.
At the beginning of all heart-cutting GC/MS measurement sequences of analysis solutions, an injection of pure n-pentane was always performed to check the system for siloxane contamination and normal detector function. In general, a septum-free injector system was used (Merlin Microseal, Agilent Technologies, Santa Clara, USA). 2 mL vials made of brown borosilicate glass and silicone-free lids with PTFE septum (both Agilent Technologies, Santa Clara, USA) were used.
Furthermore, repeat measurements of a siloxane standard were performed to estimate the reproducibility of the measured values. For this purpose, a multicomponent standard of concentration 100 pg/µL per analyte was used. The results are listed in .
Table 10. Comparison of multiple measurements of a dimethylsiloxane mixed standard.
With regard to the retention times of all components, very constant values and thus low standard deviations of a maximum of 0.0014 min were always recorded, even for the late eluting compound L9. With regard to the peak signals determined, however, there were larger variations. Thus, the calculated standard deviation was up to 4.92% of the average value of the corresponding measurements (L5). However, these deviations were to be expected due to the complexity of the detection system. For example, it is known that, in addition to small variations in the injection volume (± 1% according to the manufacturer), changes in the MSD can also occur. In this context, a slightly fluctuating ionization efficiency and the contribution of the multiplier to the signal generation should be mentioned. Likewise, small deviations are generated by the automatic peak integration (Hübschmann Citation2015).
Conclusion
At present, a large fleet of merchant ships is operated on the world’s oceans. The fuels used for these ships are predominantly mineral oil-based heavy and gas oils in a quantity of around 233 million tons per year. The conversion of these large vessels to environmentally neutral propulsion systems is technologically complex, and it will certainly take several decades to achieve relevant conversion rates. The combustion of the huge amount of marine fuels produces large amounts of pollutants, such as nitrogen oxides (NOx). An efficient exhaust gas cleaning system operated on ships will be of crucial importance for a long time to come. In the case of nitrogen oxides, SCR catalysts are used. These are effectively damaged by dimethylsiloxanes (Kolb et al. Citation2024) which are present in marine fuels. The siloxanes are added as auxiliary substances during mineral oil production and processing which will be difficult to avoid in the future.
Against this background, it was necessary to develop an analytical method for the detection of dimethylsiloxanes in marine fuels. The method described here is suitable for the analysis of dimethylsiloxanes D4 to D6 and L3 to L9. These are quantitatively relevant representatives of the dimethylsiloxanes and they are investigated as target compounds to indicate the presence of this comprehensive substance group. The analytical procedure has contributed to the elucidation of the mechanism of damage to exhaust gas catalysts and it is to be made available to commercial and industrial laboratories as a practical method for controlling siloxane contents in marine fuels and for setting them at least at a low concentration level during fuel formulation. Of course, this method can also be applied to less complex hydrocarbon matrices than represented by marine fuels.
In the literature, an analytical approach was previously presented by Chainet et al. (Citation2011, Citation2012) which, however, shall be applicable to lighter and more defined composition mineral oil fractions, i.e., naphthas and gasolines obtained from a steam cracking process. In contrast to the method described here for marine fuels, no clean-up was performed. The mineral oil fraction was injected directly into the GC (0.1 − 0.5 µL) which is usually not possible in the case of marine fuels. A separation column combination was used which was recognized as unfavorable for marine fuels, a less common detector was used in the form of a time of flight (TOF) mass spectrometer, and the chosen quantification method was only briefly described, without giving recovery rates. The analytical procedure presented here, overcomes these limitations.
In the future, it would be helpful for the application of the presented analytical procedure, if suitable SPE cartridges without dimethylsiloxane contamination were commercially available. The step of preparing self-packed columns for clean-up could then be eliminated. Furthermore, it would be advantageous if other, larger dimethylsiloxane single substances were available as analytical standards.
As previously mentioned, the Si content of the samples determined by elemental analysis is greater than that calculated from dimethylsiloxane analysis. This indicates that, in addition to dimethylsiloxanes and inorganic catalyst fines, other compounds of organic nature may be present in the samples. Chemically stable PDMS, which are partly not analyzed by gas chromatography due to their lack of volatility, are the most likely candidates. One approach is to decompose these PDMS into short-chain fragments by adding energy during the presented analytical procedure, thus making them analytically accessible. Work is being carried out on this.
A limit value for defined dimethylsiloxanes, which could act as indicator substances for this large group of substances in marine fuels, would be helpful for permanently efficient exhaust gas cleaning in large marine engines. The presented analytical procedure with the very low limits of detection for the siloxane analytes would be suitable for monitoring compliance with such a limit.
Authors’ contributions
JG and LF: Conceptuation, Methodology, Investigation, Writing-review & editing. MK and HW: Funding acquisition, Conceptuation, Methodology, Investigation, Supervision, Validation, Visualization, Writing-original draft, Writing-review & editing. All authors read and approved the final manuscript.
Acknowledgements
The authors like to thank the FVV for its financial, material and content-related support. We would also like to thank the Institute of Internal Combustion Engines (ivb), Technische Universität Braunschweig, under the direction of Prof. Dr.-Ing. Peter Eilts for the excellent cooperation.
Disclosure statement
No potential conflict of interest was reported by the author(s).
Availability of data and materials
All data generated during this work are available from the corresponding author on reasonable request.
Additional information
Funding
References
- Berthod, A. 1991. Silica: Backbone material of liquid chromatographic column packings. Journal of Chromatography A 549:1–28. doi: 10.1016/S0021-9673(00)91415-8.
- Chainet, F., C. P. Lienemann, J. Ponthus, M. Courtiade, and O. F. X. Donard. 2012. Development of heart-cutting multidimensional gas chromatography coupled to time of flight mass spectrometry for silicon speciation at trace levels in gasoline samples. Journal of Chromatography. A 1264:80–6. doi: 10.1016/j.chroma.2012.09.020.
- Chainet, F., M. Courtiade, C. P. Lienemann, J. Ponthus, and O. F. X. Donard. 2011. Silicon speciation by gas chromatography coupled to mass spectrometry in gasolines. Journal of Chromatography. A 1218 (51):9269–78. doi: 10.1016/j.chroma.2011.10.047.
- Dubreuil, A. C., F. Chainet, R. M. de Sousa Bartolomeu, F. M. Mota, J. Janvier, and C. P. Lienemann. 2017. Understanding the impact of silicon compounds on metallic catalysts through experiments and multi-technical analysis. Comptes Rendus. Chimie 20 (1):55–66. doi: 10.1016/j.crci.2016.05.020.
- Ershov, M. A., V. D. Savelenko, A. E. Makhmudova, E. S. Rekhletskaya, U. A. Makhova, V. M. Kapustin, D. Y. Mukhina, and T. M. M. Abdellatief. 2022. Technological potential analysis and vacant technology forecasting in properties and composition of low-sulfur marine fuel oil (VLSFO and ULSFO) bunkered in key world ponts. Journal of Marine Science and Engineering 10 (12):1828. doi: 10.3390/jmse10121828.
- German Federal Environment Agency. 2023. Maritime shipping (German language: Seeschiffahrt). Accessed July 25, 2023. https://www.umweltbundesamt.de/themen/wasser/gewaesser/meere/nutzung-belastungen/schifffahrt#fakten-zur-seeschifffahrt-und-zu-ihren-auswirkungen-auf-die-umwelt.
- Hübschmann, H. J. 2015. Handbook of GC-MS. 3rd ed. Weinheim: Wiley-VCH.
- International Maritime Organization. 2019. Guidelines for Consistent Implementation of the 0.50% Sulfur Limit under MARPOL Annex VI (Resolution MEPC.320(74)). https://wwwcdn.imo.org/localresources/en/OurWork/Environment/Documents/Resolution%20MEPC.320%2874%29.pdf.
- International Organization for Standardization. 2017. ISO 8217. Petroleum products – Fuels (class F) – Specifications of marine fuels. https://www.iso.org/standard/64247.html.
- Kolb, M., L. Wesemann, P. Eilts, L. Fuhrländer, and H. Wichmann. 2024. Process of SCR-catalyst deactivation by dimethylsiloxanes present in marine fuels. Emission Control Science and Technology, accepted for publication.
- Merker, G. P., and R. Teichmann, eds. 2018. Basics of combustion engines (German language: Grundlagen Verbrennungsmotoren). Wiesbaden: Springer Vieweg. doi: 10.1007/978-3-658-19212-9.
- Statista. 2023. Forecast of the share of propulsion types in the energy consumption of the global shipping fleet in 2030 and 2050 (German language: Prognose zum Anteil der Antriebsarten am Energieverbrauch der globalen Schiffflotte in den Jahren 2030 und 2050). https://de.statista.com/statistik/daten/studie/1190438/umfrage/prognose-zum-anteil-der-antriebsarten-der-globalen-schifffahrt.
- Tranchida, P. Q., D. Sciarrone, P. Dugo, and L. Mondello. 2012. Heart-cutting multidimensional gas chromatography: A review of recent evolution, applications, and future prospects. Analytica Chimica Acta 716:66–75. doi: 10.1016/j.aca.2011.12.015.
- Varaprath, S., D. H. Stutts, and G. E. Kozerski. 2006. A primer on the analytical aspects of silicones at trace levels – challenges and artifacts – A review. Silicon Chemistry 3 (1–2):79–102. doi: 10.1007/s11201-006-9005-8.
- Vogelgesang, J., and J. Hädrich. 1998. Limits of detection, identification and determination: A statistical approach for practitioners. Accreditation and Quality Assurance 3 (6):242–55. doi: 10.1007/s007690050234.