
 ?Mathematical formulae have been encoded as MathML and are displayed in this HTML version using MathJax in order to improve their display. Uncheck the box to turn MathJax off. This feature requires Javascript. Click on a formula to zoom.
ABSTRACT
Trade negotiators are confronted with the policy challenge of determining which non-tariff measures (NTMs) and products to focus on, particularly in the agriculture and food sectors, which face a prevalence of NTMs. Quantitative advice on the trade effects of different measures can inform one aspect of a negotiator’s multifaceted prioritization process. Despite well-established methods for the quantification of trade policies at an aggregate bilateral trade level, the product-level literature suffers from a general misapplication of economic theory, leaving much of it divergent from microeconomic foundations. Furthermore, the literature generally makes compromises that inhibit the ability to draw useful insight on importer-specific policy variables like NTMs. In light of this gap in the literature, we propose an approach that leads to a proof-of-concept quantification methodology for bilateral product-level analysis, fulfiling a need in the body politic to defensibly identify trade effects of NTMs at a bilateral and product level. International grains markets are used as an example to demonstrate the proof-of-concept.
I. Introduction
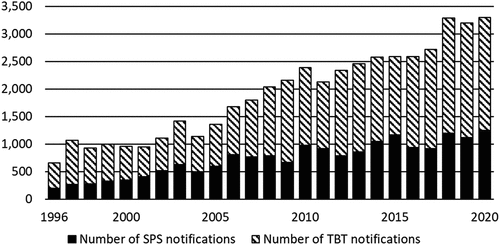
Global average applied tariffs have fallen since the completion of the Uruguay Round in 1994. Across the same period, notifications of non-tariff measures (NTMs) to the WTO have steadily increased (). A trade negotiator is thus dealing with success on the tariffs front, but grapples with the spectre of potential rising protectionism on the NTMs front.
Figure 1. Number of Sanitary and Phytosanitary (SPS) and Technical Barrier to Trade (TBT) notifications to the WTO.
The trade negotiator is faced with the challenge of understanding the effects of these NTMs on trade, and determining what NTMs and products to focus on in bilateral and multilateral negotiations. This means that qualitative and quantitative advice on the trade effects of different measures can inform one aspect of a negotiator’s multifaceted decision-making process to prioritize and allocate scarce resources. Furthermore, bilateral product-level results enable trade policymakers to communicate on a tangible level to the public, and to public representatives, how measures are affecting trade for specific products on specific bilateral routes, helping to target sectoral interests in a political economy effort to build a constituency for change.
A policymaker or negotiator who allocates scarce taxpayer resources to resolve a potential trade barrier, or who raises its trade effects in international forums, requires a defensible and robust methodology in the event that the methodology is challenged. Despite the existence of methods for the quantification of trade policies at an aggregate bilateral trade level, the product-level literature shows a significant gap, suffering a general misapplication of economic theory, leaving much of it divergent from microeconomic foundations. Furthermore, to overcome technical econometric challenges in the presence of numerous importer-specific variables, the literature generally makes compromises that inhibit the ability to draw useful policy insight, such as the effects on trade of importer-specific policy variables like NTMs. In light of this gap in the literature, we demonstrate an approach that is consistent with underlying economic theory, overcomes the challenges of product-level multicollinearity, incorporates the important concept from the literature of multilateral resistance, incorporates an intuitively sensible approach of using product-level information to explain product-level trade and fulfils a need in the body politic to defensibly identify trade effects of NTMs at a bilateral and product level.
II. Literature review
Studies attempting to quantify the effects of NTMs typically make use of the gravity model. This is a useful tool as it allows identification of the influences – and the quantification of their effects – on trade price, quantity and value. The so-called structural gravity model provides an econometric approach with microeconomic foundations. Its development is documented by Baier and Bergstrand (Citation2010). Herman (Citation2022), Heid, Larch, and Yotov (Citation2021), Dolabella (Citation2020), Cadot, Gourdon, and van Tongeren (Citation2018), Kee and Nicita (Citation2016) and Kareem, Martinez-Zarzoso, and Brümmer (Citation2016) provide recent examples of its application. Head and Mayer (Citation2014) summarize numerous alternative approaches and suggest that many of these alternatives yield similar underlying econometric specifications and results.
In the structural gravity approach, trade is regressed against a number of explanatory variables, such as production, expenditure and trade costs. Successful achievement of bilateral product-level quantification has hitherto required trade-offs in different aspects, and existing studies can be categorized according to one or more of the following technical quantification matters or negotiator needs. These are discussed in further detail below and summarized in . This table does not include all studies cited below but provides a summary of papers providing methodological developments in the field and recent applied studies, so as to provide focus and demonstrate where gaps in the literature exist.
Table 1. Summary of papers providing methodological developments in the field and recently applied studies.
Consistency with underlying microeconomic foundations
A foundational approach to modelling bilateral trade flows (and the effects of policy measures on bilateral trade) is provided in a seminal paper by Anderson and van Wincoop (Citation2003). Their paper establishes a utility-maximizing representative consumer, with constant elasticity of substitution preferences. Analyses based on that framework require a representative consumer optimizing their consumption of a single good differentiated across production regions – because of this, production of the single good can be considered an economy-wide aggregate (e.g. GDP) if aggregate trade flows are being investigated. This approach is not appropriate for product-level analysis because expenditure by country j on the single good (purchased from itself and various exporters) must be derived from income from production of the single good in j. In other words, it implies that a country that does not produce wheat will not purchase wheat. This point is made clear by Anderson and van Wincoop (Citation2003) and is again reiterated by Heid, Larch, and Yotov (Citation2021).
Some studies inappropriately use the Anderson and van Wincoop framework for product-level analysis and diverge from the underlying model by investigating product-level trade and use GDP as the exporter’s production variable. Recent examples are Dolabella (Citation2020), Kareem, Martinez-Zarzoso, and Brümmer (Citation2016) and Larson et al. (Citation2018). Ghodsi, Grübler, Reiter and Stehrer (Citation2017) do not specify any such microeconomic foundations of their model, but similarly use aggregate measures such as GDP, labour and capital, but not product-specific information to explain product-specific trade.
Herman (Citation2022) presents a novel approach and appears to use product-specific expenditure in their preferred specification (consistent with Anderson and van Wincoop Citation2003), but they apply it to a multi-product framework. This is not intuitively consistent with the foundational microeconomic idea of a utility maximizing consumer optimizing their consumption across a basket of goods subject to their budget constraint (Xiong and Beghin Citation2014).
Numerous studies explicitly use the Anderson and van Wincoop framework, but implement exporter-time fixed effects to account for aggregate production in an exporter. Such studies include USITC (Citation2021), Bacchetta et al. (Citation2012) and Heid, Larch, and Yotov (Citation2021). While the authors’ chosen framework implies that they believe they are capturing exporter GDP, their applied approach should nonetheless be theoretically consistent with a product-level framework outlined by Xiong and Beghin (Citation2014), which is essentially the same in an applied sense as Anderson & van Wincoop when exporter-time fixed effects are used.
Xiong and Beghin (Citation2014) expanded on the single product approach by introducing multiple goods into the consumer’s utility maximization problem and the producer’s cost minimization problem. An important contribution was that the consumer optimizes consumption of each good across multiple countries subject to aggregate expenditure. Market equilibrium occurs on the product level. While Xiong and Beghin (Citation2014) use their framework specifically for analysis of maximum residue limits (MRLs), a type of NTM in agriculture and food markets, the approach can be adapted to identify categories of NTMs at a product level that are trade-promoting (increases bilateral quantity) and trade-diverting (reduces bilateral quantity) via net shifts in demand or supply, as per Cadot, Gourdon, and van Tongeren (Citation2018).
Outside the Anderson and van Wincoop (Citation2003)/Xiong and Beghin (Citation2014) sphere, Kee, Nicita, and Olarreaga (Citation2008) produced ground-breaking work quantifying NTMs for each importer in the world at a HS6 level, based on a methodology in Kee, Nicita, and Olarreaga (Citation2009). However, close interrogation demonstrates that even these authors diverge from their stated underlying microeconomic foundations of ‘the n-good n-factor general equilibrium model with log-linear utilities and log-linear constant returns to scale technologies (see Leamer Citation1988, Citation1990)’. Kee, Nicita, and Olarreaga (Citation2009) explicitly used economy-aggregate variables (‘agricultural land over GDP, capital over GDP and labour over GDP’), rather than incorporating the product-specific factor inputs that are required by Leamer’s framework (Leamer Citation1990) and incorporated, at least to some extent, by the papers cited by these authors (Leamer Citation1990; Harrigan Citation1993; Trefler Citation1993; Lee and Swagel Citation1997). Putting aside complicated frameworks, it is intuitively sensible to incorporate product-level information to explain product-level trade.
Product information and potentially omitted variable bias
Distinct from the issue of theoretical consistency with microeconomic foundations, a further issue is the potential omitted variable bias when product information is excluded. Excluding product-level information about the product could lead to omitted variable bias when explanatory variables are correlated with each other. For example, a country with relatively large agricultural production may have a high incidence of sanitary and phytosanitary (SPS) measures, given the opportunity cost of a biosecurity incursion. Furthermore, a consideration of influences on product-level trade should intuitively include product-level information. For example, the size of a country’s corn harvest is reasonably a major influence on the size of a country’s corn exports in any given year. This omitted variable bias is a further shortcoming of some studies which explicitly use GDP for exporters’ product-level output, e.g. Larson et al. (Citation2018), Kareem, Martinez-Zarzoso, and Brümmer (Citation2016), Dolabella (Citation2020) and Ghodsi, Grübler, and Stehrer (Citation2016).
Product-level multicollinearity and the fixed effects problem
When applying a structural gravity framework on an individual product basis to cross-section data, econometric estimation may suffer from multicollinearity, biasing parameter estimates. This is a problem when multiple i-specific and/or j-specific variables are included and creates problems for understanding the effects of policies that are generally non-discriminatory. This is also made very clear by Heid, Larch, and Yotov (Citation2021), Fell (Citation2020) and Head and Mayer (Citation2014).
Multicollinearity is less of a problem when analysis is conducted at a coarser level than HS6 trade, as practitioners can obtain variation in the data through numerous trade observations, tariff estimates and NTM indices at the finer level. These are then pooled to a coarser level, e.g. HS2, to gain sufficient variation in data to avoid multicollinearity.
To avoid the multicollinearity problem, some studies use fixed effects to capture all i-specific and/or j-specific effects (see for example Bacchetta et al. (Citation2012), USITC (Citation2021) and Heid, Larch, and Yotov (Citation2021)). Given that most NTMs are applied non-discriminately and some countries may predominantly apply MFN tariffs to their imports, a country-specific dummy could pick up not just local product-level information, but also tariffs and NTMs, so analysis cannot be conducted reliably for certain comparative statics and the effect of country-specific variables (such as non-discriminatory NTMs) on trade flows cannot be investigated (Baier and Bergstrand Citation2010).
To emphasize this point, we quote Head and Mayer (Citation2014) directly (as do Heid, Larch, and Yotov Citation2021): “In the presence of importer and exporter fixed effects a variety of potentially interesting trade determinants can no longer be identified in a gravity equation. Notably, (1) anything that affects exporters’ propensity to export to all destinations (such has [sic] having hosted the Olympics or being an island), (2) variables that affect imports without regard to origin, such as country-level average applied tariff, (3) sums, averages, and differences of country-specific variables. If any variables of these three forms is added to a trade equation estimated with importer and exporter fixed effects … the estimates are meaningless”.
Treatment of tariffs information
Given the challenge of multicollinearity, it is important to extract as much bilateral variation from data as possible. For this reason, studies to quantify non-discriminatory variables would ideally use applied bilateral tariffs (incorporating both applied MFNs and preferential tariffs), rather than simply using applied MFNs. Recent studies (e.g. Cadot, Gourdon, and van Tongeren Citation2018; Dolabella Citation2020; Herman Citation2022) simply use applied MFN tariffs, and potentially introduce omitted variable bias given that reductions in preferential tariffs could be linked to increases in NTMs.
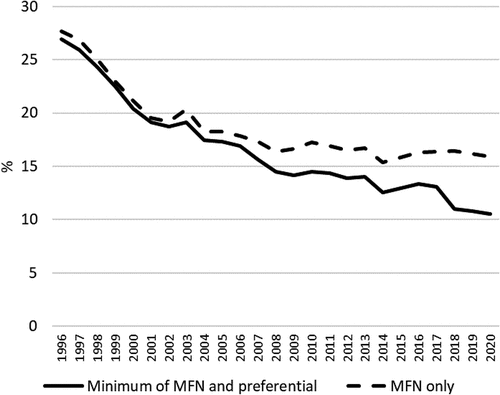
The treatment of tariffs information highlights another trade-off. A practitioner may need to calculate bilateral product-level applied tariff estimates on approximately 40,000 country pairs per year per product, accounting for all preferential agreements, but for uncertain benefit given that the lowest applied tariff may simply be the applied MFN tariff. However, indicates that accounting for preferential tariffs may be important. Using agriculture as an example, the minimum applied simple average tariff has diverged from simple average applied MFN tariffs and this divergence has increased in recent years.
Figure 2. Simple average tariffs on all bilateral routes, WTO definition of agriculture.
Multilateral resistance
Anderson and van Wincoop (Citation2003) developed the important insight that a concept known as multilateral resistance must be taken into account in structural gravity studies. Multilateral resistance represents the idea of general resistance to import or export in a country. Shepherd (Citation2016) explains that its exclusion leads to omitted variable bias as multilateral resistance terms (MRTs) are correlated with other trade costs by their very definition. The indices used by Anderson and van Wincoop (Citation2003) are computationally challenging to create and Head and Mayer (Citation2014) consequently discuss a number of alternative methods for incorporating MRTs, including Taylor series approximation, fixed effects, trade cost relative to market share and trade-weighted trade cost.
Examination of a Taylor series expansion demonstrates that the approach is appropriate when panel data, which is typical for gravity models across time, is balanced. However if the panel is not balanced, the different additive elements of the expansion will not be representative of the influence on the dependent variable if adjustment is not made for the varying number of countries in the dataset in each time period.
Fixed effects for importers and exporters can be used to control for multilateral resistance, but there are drawbacks to this approach, as above: country-specific dummies will pick up MRTs and the effect of country-specific variables, which does not lend well to policy analysis. An alternative to fixed effects is suggested by Bacchetta et al. (Citation2012) via the use of a proxy using trade cost relative to market share (sometimes referred to as ‘remoteness’). However, this proxy was refuted earlier by Anderson and van Wincoop (Citation2003) as ‘entirely disconnected from the theory’.
A novel paper by Herman (Citation2022) attempts to make use of assumptions about MRTs and trade costs to overcome the multicollinearity problem (above) by using a two-stage approach and regressing non-discriminatory variables on a series of differences in importer fixed effects, which are shown to equal non-discriminatory trade costs. However, to enable the theoretically correct use of differences in importer fixed effects as equivalent to non-discriminatory trade costs, Herman (Citation2022) adopts significant simplifying assumptions. The first is that in a free trade environment, the structural gravity trade cost term shrinks to unity. This is not reasonable, because the trade cost term includes all trade ‘resistances’ such as distance, NTMs (including appropriate protection as per WTO rules that would still exist in a free trade environment) and other common gravity variables as per Anderson and van Wincoop (Citation2003). The second is that the ratio of MRTs for a given importer in a free trading environment versus a non-free trading environment would be 1. This conflicts with the very definition of these price indices provided in Anderson and van Wincoop (Citation2003). Intuitively, a lowering of a general resistance to trade would be implicit in a country becoming more open to trade.
Domestic expenditure and sales
Heid, Larch, and Yotov (Citation2021) demonstrate that when dealing with the trade effects of variables that are mostly non-discriminatory in nature (e.g. NTMs and MFN tariffs), domestic sales data should be included for structural gravity analyses. Importantly, the inclusion of intranational trade allows an important counterfactual to be considered. In our case, our counterfactual is: what if there are no NTMs, and no other trade costs? The inclusion of intranational trade should also increase degrees of freedom and variation in the data.
Bilateral quantification
The approaches of Herman (Citation2022) and Kee, Nicita, and Olarreaga (Citation2009) provide results only on an importer basis and highlights one of the general trade-offs in bilateral product-level quantification. Conducting analysis only on an importer-basis creates variation in the data in the j (importer) space and potentially removes the multicollinearity problem, but it provides policymakers with limited information on results specific to a bilateral relationship, which is useful in bilateral negotiations. Results may vary on a bilateral basis as countries can respond (divert trade) differently to the same non-tariff measure, particularly depending on the share of trade held by the importer/exporter (Cadot, Gourdon, and van Tongeren Citation2018). Other recent studies to provide results on a bilateral basis include Dolabella (Citation2020) and Cadot, Gourdon, and van Tongeren (Citation2018).
Gap in the literature
It is clear from that there is a gap in the literature in relation to methodologically sound bilateral product-level quantification of NTMs’ effects on trade. Also shown above are numerous trade-offs. To overcome multicollinearity at a product level, the practitioner can use fixed effects, but lose the ability to do meaningful policy analysis. In response, it is possible to switch to a coarser level of analysis, but the ability to gain policy insight on specific products is lost. Alternatively, importer-only quantification can be chosen (e.g. Herman Citation2022; Kee, Nicita, and Olarreaga Citation2008) but that entails losing insight for bilateral negotiations. Secondly, a practitioner can include data on preferential bilateral tariffs to gain more variation in the data, but this comes at a large data compilation effort with uncertain benefit. Thirdly, incorporating MRTs allows theoretical consistency, but introduces or adds to the multicollinearity problem. In response, MRT proxies can be used, but these need to be selected carefully or theoretical inconsistencies with the underlying model will be introduced.
Considering the challenges and deficiencies presented in the literature, the contribution of this paper is to propose an approach that uniquely draws together a series of otherwise isolated innovations in the literature with a new dataset, to demonstrate how to overcome these challenges. The approach, below, overcomes the trade-offs described above and is consistent with microeconomic foundations, avoids omitted variable bias, incorporates multilateral resistance, incorporates domestic expenditure and sales, does not use fixed effects that inhibit policy analysis and does make use of data on bilateral tariffs.
III. Approach
We adapt the basic theoretical framework of Xiong and Beghin (Citation2014) and incorporate developments from Heid, Larch, and Yotov (Citation2021) and Cadot, Gourdon, and van Tongeren (Citation2018), with dataset innovations from Fell (Citation2022b). The consumer utility optimization problem is defined as
where is quantity consumed in importing region
of the product k produced in exporting region
(there are
regions),
represents quality attributes to importer
,
is the elasticity of substitution, assuming it is independent of the importing region,
is price of the product and
is the consumer’s income (and expenditure).
The producer profit optimization problem is defined as
where is the set of countries that exporter
chooses to sell to for product
,
is bilateral trade costs, such as tariffs and other variables influencing the cost of trade and
is the constant elasticity of transformation across products to be produced and regions to be exported. Equilibrium value and price are shown in (3) and (4), respectively, and we derive quantity (5) by dividing value by priceFootnote1
Equilibrium value:
Equilibrium price:
where is the quantity of product
sold by exporter
to all destinations,
is an importer
price index, and
is an exporter
price index for product
. These price indices are the multilateral resistance terms, described in the literature above.
Equilibrium quantity:
(3) to (5) can be estimated at a HS6 level using econometric techniques, as per Cadot, Gourdon, and van Tongeren (Citation2018) and Dolabella (Citation2020).
The benefit of estimating EquationEquation (5)(5)
(5) is that it allows us to pursue comparative static analysis and identify trade-promoting NTM categories through an increase in quantity, and trade-diverting NTM categories through a decrease in quantity.
Multilateral resistance
We use a proxy that incorporates the very idea behind multilateral resistance, consistent with that in Anderson and van Wincoop (Citation2003) and Xiong and Beghin (Citation2014): the MRT for is the trade cost with
weighted by other factors faced by i that capture a suite of broad international market influences (in this case the weighting is ij bilateral trade in k as a share of i’s exports of k to all destinations j) summed over
. This intuitively captures the idea of multilateral resistance:
Note that this is different from the discredited remoteness approach which does not incorporate bilateral trade flows and effectively uses i’s bilateral trade costs weighted by j’s total world market share.
Product information and omitted variable bias
For expenditure, the consumer’s constrained optimization problem suggests that GDP should be used as its proxy, but aggregate production of product k should be used in the producer’s optimization problem. We include the quantity of product k supplied by each exporter i.
Domestic expenditure and sales
We include domestic sales information, incorporating the insight from Heid, Larch, and Yotov (Citation2021). This means that we include ii and jj observations for each variable.
Product-level multicollinearity
We recognize that tariffs have been changing over time and NTMs have been changing over time (Fell Citation2022a). This provides an avenue for overcoming the multicollinearity issues that exist in cross-sectional product-level estimation. This may provide sufficient variation in the data to reveal the marginal effects of these bilateral trade costs. We access the work of Fell (Citation2022b) to utilize a dataset of the minimum applied bilateral tariffs over time at a HS6 level, which incorporates MFNs and preferential tariffs. This introduces variation in both i, j and t. We also incorporate a time element for NTMs, to allow variation in j-specific elements over time.
Endogeneity
The endogeneity of trade flows in trade policy is well documented (Trefler Citation1993; Rodrik Citation1995; Baier and Bergstrand Citation2002). As per Ghodsi, Grübler, and Stehrer (Citation2016), we lag the policy variables by one period so as to reduce any endogeneity bias. It is also reasonable to suspect the potential for endogeneity between the dependent variable and the market share variables. This problem should be avoided using lagged market share variables.Footnote2
Estimation equation
We estimate the equation
Importantly, represents quantity at time t,
is the distance between trading partners,
represents the restrictiveness of non-MRL SPS measures,
represents the restrictiveness of non-MRL technical barriers to trade (TBTs),
represents the restrictiveness of MRL measures and
represents all other import-related NTMs. Other variables are already described above. Similar to Xiong and Beghin (Citation2014) who use
to capture deviation from a standard, we use
to capture trade quantity deviations over barley arising from preference for different grain types, setting
where each
is a dummy variable for each grain type, respectively.
As per Cadot, Gourdon, and van Tongeren (Citation2018), we include market share-weighted tariffs and NTMs as bilateral trade costs to better capture the influence on quantity and price of large country importers’ and exporters’ policies.
Estimation technique
A key contribution with relevance to gravity models came from Santos Silva and Tenreyro (Citation2006), demonstrating Poisson Pseudo Maximum Likelihood (PPML) as an appropriate technique for the gravity model and zero-inflated data given the robustness of the estimator. Consequently, PPML has been widely adopted in gravity studies (see Herman Citation2022; Dolabella Citation2020; Cadot, Gourdon, and van Tongeren Citation2018; Larson et al. Citation2018; Kareem, Martinez-Zarzoso, and Brümmer Citation2016; Ghodsi, Grübler, and Stehrer Citation2016). However, PPML is not without its critics in relation to bias in the presence of pure economically determined zero trade flows (Martin and Pham Citation2020).
Heteroscedasticity
Another factor in favour of choosing PPML, to paraphrase Dolabella (Citation2020), is the documented robustness of the estimator in the presence of heteroscedasticity in the residuals (Santos Silva and Tenreyro Citation2006). Santos Silva (Citation2016) recommends the use of clustered errors with the PPML estimator. Accordingly, we use one-way clustering, two-way clustering and a sandwich covariance matrix and found that statistical inference was not sensitive to these assumptions about the covariance matrix in our applicationFootnote3 We present results using two-way clustering on exporter and importer as it is intuitively reasonable that errors may be clustered based on these two variables.
Data
We use a dataset covering bilateral trade, minimum bilateral tariffs (including MFNs), NTMs, country characteristics and domestic production sold to domestic consumers documented in Fell (Citation2022b). We apply the methodology to international trade in grains between 2010 and 2018. We use bilateral data at the HS6 level, providing ijkt observations. We choose this time period as a result of improved availability of NTM data starting from 2010. We limit the data coverage to HS6 codes representing barley, common wheat (triticum spp. other than triticum durum), durum wheat, corn, oats, rye, and sorghum. Further, we exclude data in seed trade given limited observations and we exclude rice due to challenges with conversion to a common milled-equivalent quantity.
To create a measure of the restrictiveness of NTMs, we use a proxy from UNCTAD TRAINS (Citation2019) count data. We assume that a country that has a proclivity to impose restrictive NTMs is likely to impose more NTMs. While imperfect, we use UNCTAD TRAINS count data to represent this idea, as per Cadot, Gourdon, and van Tongeren (Citation2018), Dolabella (Citation2020) and Herman (Citation2022). These count data are available on a HS6 and MAST category and sub-category basis (UNCTAD Citation2019). We then further extract MRL count data using sub-categories in the dataset.
Ad valorem equivalents
Bilateral product-level ad valorem tariff-equivalents (AVEs) of the NTMs can be deduced from the results. We calculate tariff-equivalents of NTM categories by estimating the magnitude of a tariff cut that achieves the same discrete change in trade as eliminating a particular category of NTMs (7). This is conceptually similar to the tariff wedge approach used by Yue, Beghin, and Jensen (Citation2006) and Fell and MacLaren (Citation2013). We then rearrange (7) to achieve an equation for calculating the AVE (8), using SPS measures as an example.
This differs from an alternative approach, e.g. by Kee, Nicita, and Olarreaga (Citation2009) and Ghodsi, Grübler, and Stehrer (Citation2016), where an elasticity of supply is multiplied by a parameter estimate. Nguyen, Bouët, and Traoré (Citation2022) criticizes that approach to AVE estimation. However, we suggest this critique is mistargeted as it revolves around the widely used PPML-based parameter estimates being biased, i.e. it is the PPML estimates in question, not the AVE estimation methodology. We differ from that methodology so as to focus on true tariff-equivalency of effects.
IV. Results
Results from our estimation process are shown in . Parameter estimates are mostly highly significant. All signs are as expected, with negative signs on tariffs, TBTs, MRLs, and other NTMs. The positive sign on SPS measures suggests they have, on average, a demand-enhancing effect in international grains markets over the period 2010 to 2018. The magnitudes of parameter estimates appear reasonable. For example, the estimate on suggests a 1% increase in domestic grains production leads to a 0.8% increase in bilateral grains exports.
Table 2. Estimation results.
The parameter estimate on the (−4.9) may appear large in absolute terms, but in this study, the bilateral trade response also needs to be interpreted in conjunction with the importer share and exporter share weighted
variables and their parameters. For comparison, elasticities of substitution are calculated in Kee, Nicita, and Olarreaga (Citation2008), and the estimates in this study tend to fall between the 25th and 75th percentiles of Kee, Nicita, and Olarreaga’s (Citation2008) estimates (which are on an importer by importer basis).
The sign on the parameter estimate may appear unexpected. However, an important consideration here is the specifics of the dependent variable,
. This refers to trade specifically between i and j in product k at time t. The result suggests that if i and j actually trade together then any exports between i and j will be greater when the exporter faces greater general resistance to export (see above). In other words, a country that has more general resistance to trade, may send greater volumes to the destinations that it actually exports to (i.e. experiences export concentration).
The results confirm that when a tariff is imposed, the larger the import share of an importer and the larger the export share of an exporter, the lesser the effect on trade, consistent with the general international trade literature on large country tariffs.
The results confirm ambiguity as to the effects on large country exporters with regard to NTM imposition. An NTM is materially different to a tariff: the NTM increases the prices paid/received by both consumer and firm (merely compensating firms for the rise in their marginal costs in market equilibrium)—for a large exporter, marginal revenue rises for an NTM but falls for a tariff. This will have two influences on bilateral trade: i) influence world price (a negative effect on overall consumption of the consumer caused by a movement along the demand curve), and ii) raise prices to cushion the effects of the higher costs, thus limiting the falls in the exporter’s bilateral exports compared with if it was a price taker, thus creating ambiguity in the expected sign. Dolabella (Citation2020) elaborates further on the ambiguity in the expected sign on these variables.
As recommended by Santos Silva (Citation2016), we conducted a RESET test, using the squared values of the predictions from the PPML regression. We do not reject the null hypothesis that the parameter estimate on the squared values of the predictions is zero.
AVEs
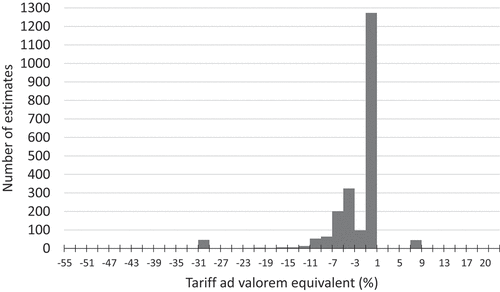
We demonstrate our approach using a sample of results as follows. shows a histogram with the distribution of bilateral ad valorem tariff equivalents of SPS measures for barley in 2018, calculated according to (8). The results indicate that SPS measures for barley are generally trade-promoting, as indicated by negative ad valorem tariff equivalents (i.e. subsidy equivalents) and are generally close to zero.
Figure 3. Distribution of bilateral non-MRL SPS NTMs expressed as ad valorem tariff equivalents, barley, 2018.
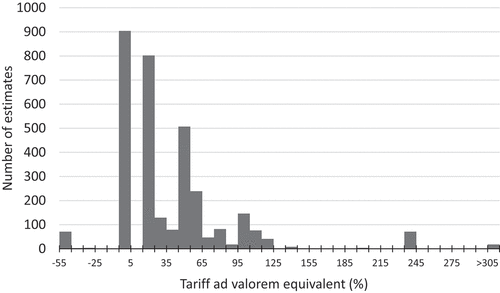
shows a histogram with the distribution of bilateral ad valorem tariff equivalents of TBT measures for common wheat in 2018 when expressed as a bilateral ad valorem equivalent. This demonstrates that the approach can estimate bilateral product-level results by NTM category, in this case TBTs. The results indicate that TBT measures are generally trade-reducing.
Figure 4. Distribution of bilateral non-MRL TBTs expressed as ad valorem tariff equivalents, common wheat, 2018.
Comparison with other literature
Other bilateral HS6 level studies have not published their estimation results. In these other studies, authors have only presented summarized estimation results. As a consequence, a direct comparison of actual estimation results with the literature is not available. To allow comparison with results in the literature, we aggregate our results across NTM categories and compare them with those of major studies, namely Herman (Citation2022), Cadot, Gourdon, and van Tongeren (Citation2018) and Kee, Nicita, and Olarreaga (Citation2008). Given the scarcity of meaningful product-level results available, we specifically include the now dated work of Kee, Nicita, and Olarreaga (Citation2008), which is a major contribution in the field given that it provided HS6 product-level results.
Our results lie between those in the literature for barley, corn and oats, are lower for rye and sorghum, and higher for wheat (). Differences in results can be attributed to the use of alternative methodologies, particularly on the use of bilateral trade/NTM/tariff data, the inclusion of product-level information, the inclusion of MRTs and consideration of different time periods. The inclusion of appropriate economic variables in our approach, subject to theoretically sound microeconomic foundations, also likely contributes to variations in results. Two studies shown in also present anomalous results, and this is discussed in the paragraph below.
Table 3. Comparison of NTMs as ad valorem tariff equivalents.
Interestingly, our results for common and durum wheats are quite different from two of the other studies. The results in Kee, Nicita, and Olarreaga (Citation2008) and Cadot, Gourdon, and van Tongeren (Citation2018) for wheat are unexpected given that NTMs faced by wheat should be similar to other grains. Wheat is used both as a food grain and feed grain. For an alternative food grain, rice, Kee, Nicita, and Olarreaga (Citation2008) report a median AVE of 15% and Cadot, Gourdon, and van Tongeren (Citation2018) report 22%. For an alternative feed grain, Kee, Nicita, and Olarreaga (Citation2008) report 32% for corn and Cadot, Gourdon, and van Tongeren (Citation2018) report 51% for other cereals n.e.c. It is intuitively reasonable that wheat would face similar NTMs to other food and feed grains and our results satisfy this reasoning. The similarity of wheat AVEs to those for other grains products is a characteristic that our results share with Herman (Citation2022).
Policy implication and recommendations
The approach described throughout this paper and the results above provide negotiators with information that enables them to target the most trade-diverting non-tariff measures on a product level. The approach, with results presented above as aggregated across exporters and importers (so that we can compare with other literature in the field), also helps a negotiator to allocate scarce resources across bilateral relationships, as it provides insight through a defensible framework about where the most trade-diverting NTMs occur bilaterally, too.
The results for this proof-of-concept show that in global grains markets NTMs are not necessarily barriers to trade, but can raise bilateral trade volumes. For example, SPS measures are generally trade-promoting, consistent with the idea that consumers receive a signal about the product quality, boosting their demand. TBT measures were shown to be generally trade-diverting in grains markets, suggesting that these measures are an important area for trade negotiators and policymakers to focus efforts. These results suggest that gains from trade are being denied by the imposition of TBTs.
Importantly, approaches like this provide no legal justification for a measure under WTO rules. From an economic perspective, the results also do not provide advice on what is the most efficient means to achieve a policy objective and it does not indicate where there is scope to further reduce compliance cost if a measure is trade-promoting.
V. Conclusion
This article presents a means by which classes of policy instruments can be evaluated to determine their trade-promoting or trade-diverting effects. In contrast to earlier studies attempting bilateral and product-level quantification, our approach is consistent with the underlying microeconomic foundations, providing negotiators and policymakers with methodological defensibility. The approach is intuitively sensible by including product-level information to explain product-level bilateral trade. Our approach enables policymakers to objectively prioritize the scarce allocation of negotiating resources to specific destinations, products and policy measures.
Applied results demonstrate that NTMs across global grains markets are equivalent to tariffs of 29–37%. SPS measures are generally trade-promoting in global grains markets. Results demonstrate that TBTs are generally trade-diverting, with a clear policy implication that these should be a focus for negotiators and policymakers in order to achieve greater gains from trade.
Future research in the field should focus on applications of such an approach to the effects of NTMs over time across a broader suite of products. This article, with the objective of demonstrating an approach, has focussed on interrogating results specifically for global grains markets at a point in time, despite using time series data. A deeper understanding of NTM AVEs over time will also contribute to answering the question for the policy and negotiator community of whether tariff reductions have been, or are being, replaced by NTMs more generally. Furthermore, such work can identify which importers impose the most trade-diverting NTMs, and which bilateral trade relationships are affected the most. Consequently, there is scope for a large body of applied work in the future to continue drawing out significant policy implications.
Disclosure statement
No potential conflict of interest was reported by the author(s).
Notes
1 This idea is contributed by Cadot, Gourdon, and van Tongeren (Citation2018), but those authors use an algebraically erroneous derivation..
2 We estimated two versions of the equation with i) non-lagged market share and policy variables and ii) lagged market share and policy variables. Results indicated that signs were unchanged, and parameter estimates were within 95% confidence intervals with the exception of which was within a 96% confidence interval. Consequently we determined that endogeneity, present or otherwise, was not affecting estimation results.
3 We use the sandwich covariance matrix estimators (Zeileis and Lumley Citation2022) in R to produce the same errors and test statistics generated by Santos Silva’s ppml package in Stata..
References
- Anderson, J. E., and E. van Wincoop. 2003. “Gravity with Gravitas: A Solution to the Border Puzzle.” The American Economic Review 93 (1): 170–192. doi:10.1257/000282803321455214.
- Bacchetta, M., C. Beverelli, O. Cadot, M. Fugazza, J.M. Grether, M. Helble, A. Nicita, and R. Piermartini. 2012. A Practical Guide to Trade Policy Analysis. Geneva: World Trade Organization and United Nations Conference on Trade and Development.
- Baier, S. L., and J. H. Bergstrand. 2002. On the Endogeneity of International Trade Flows and Free Trade Agreements. New York: mimeo.
- Baier, S. L., and J. H. Bergstrand 2010. “Approximating General Equilibrium Impacts of Trade Liberalizations Using the Gravity Equation: Applications to NAFTA and the European Economic Area.” In The Gravity Model in International Trade: Advances and Applications, edited by P. A. G. van Bergeijk and S. Brakman, 88–134. Cambridge: Cambridge University Press.
- Cadot, O., J. Gourdon, and F. van Tongeren. 2018, “Estimating Ad Valorem Equivalents of Non-Tariff Measures: Combining Price-Based and Quantity-Based Approaches.” OECD Trade Policy Papers, No. 215, OECD Publishing. 10.1787/f3cd5bdc-en.
- Dolabella, M. 2020. “Bilateral effects of non-tariff measures on international trade: volume-based panel estimates.” International Trade series, No. 155 (LC/TS.2020/107). Santiago: Economic Commission for Latin America and the Caribbean (ECLAC).
- Fell, J. 2020. Quantification of Non-Tariff Measures as Tariff Equivalents on a Commodity Level. Slides and speaking notes accompanying a presentation to the 2019 conference of the Australasian Agricultural and Resource Economics Society, Melbourne. 10.25814/5e38f24a0c9b2.
- Fell, J. 2022a. ABARES Insights: Australia’s Future Agricultural Trade Advantage. Canberra: Australian Bureau of Agricultural and Resource Economics and Sciences. doi:10.25814/2e44-ah64.
- Fell, J. 2022b. Non-Tariff Measures: Compilation of a Dataset for Analysis of Bilateral Trade Policy Measures ABARES technical report 22.10. Canberra: Australian Bureau of Agricultural and Resource Economics and Sciences. doi:10.25814/wp2v-2941.
- Fell, J., and D. MacLaren. 2013. “The Welfare Cost of Japanese Rice Policy with Home‐good Preference and an Endogenous Import Price.” The Australian Journal of Agricultural and Resource Economics 57 (4): 601–619. doi:10.1111/1467-8489.12013.
- Ghodsi, M., J. Grübler, O. Reiter, and R. Stehrer. 2017. The Evolution of Non-Tariff Measures and Their Diverse Effects on Trade. Research report 419. The Vienna Institute for International Economic Studies.
- Ghodsi, M., J. Grübler, and R. Stehrer. 2016. Estimating Importer-Specific Ad Valorem Equivalents of Non-Tariff Measures. Working paper 129. The Vienna Institute for International Economic Studies.
- Harrigan, J. 1993. “OECD Imports and Trade Barriers in 1983.” Journal of International Economics 35 (1): 91–111. doi:10.1016/0022-1996(93)90006-J.
- Head, K., and T. Mayer. 2014. “Gravity Equations: Workhorse, Toolkit, and Cookbook.” Handbook of International Economics, Vol. 4, 131–195. Elsevier. doi:10.1016/B978-0-444-54314-1.00003-3.
- Heid, B., M. Larch, and Y. V. Yotov. 2021. “Estimating the Effects of Non‐discriminatory Trade Policies Within Structural Gravity Models.” Canadian Journal of Economics/Revue canadienne d’économique 54 (1): 376–409. doi:10.1111/caje.12493.
- Herman, P. 2022. “A Pragmatic Approach to Estimating Nondiscriminatory Non-Tariff Trade Costs.” Review of International Economics 30 (4): 1258–1287. doi:10.1111/roie.12604.
- Kareem, F. O., I. Martinez-Zarzoso, and B. Brümmer. 2016. “Fitting the Gravity Model When Zero Trade Flows are Frequent: A Comparison of Estimation Techniques Using Africa’s Trade Data.” GlobalFood Discussion Papers, No. 858-2016-60260. Georg-August-Universitaet Goettingen, Department of Agricultural Economics and Rural Development. 10.22004/ag.econ.230588.
- Kee, H. L., and A. Nicita. 2016. “Trade Frauds, Trade Elasticities and Non-Tariff Measures.” in 5th IMF-World Bank-WTO Trade Research Workshop, Washington, DC, November, vol. 30.
- Kee, H. L., A. Nicita, and M. Olarreaga. 2008. “Overall Trade Restrictiveness Indices and Import Demand Elasticities.” In The World Bank Data Catalog. Washington DC: The World Bank. Accessed 7 December 2021. https://datacatalog.worldbank.org/search/dataset/0039585
- Kee, H. L., A. Nicita, and M. Olarreaga. 2009. “Estimating Trade Restrictiveness Indices.” The Economic Journal 119 (534): 172–199. doi:10.1111/j.1468-0297.2008.02209.x.
- Larson, J., J. Baker, G. Latta, S. Ohrel, and C. Wade. 2018. “Modeling International Trade of Forest Products: Application of PPML to a Gravity Model of Trade.” Forest Products Journal 68 (3): 303–316. doi:10.2307/1925976.
- Leamer, E. 1988. “Cross-Section Estimation of the Effects of Trade Barriers.” In Chapter in Empirical Methods for International Trade, edited by R. Feenstra, 51–82. Cambridge, Massachusetts: MIT Press.
- Leamer, E. 1990. “Latin America as a Target of Trade Barriers Erected by the Majordeveloped Countries in 1983.” Journal of Development Economics 32 (2): 337–368. doi:10.1016/0304-3878(90)90042-A.
- Lee, J.W., and P. Swagel. 1997. “Trade Barriers and Trade Flows Across Countries and indUsitcies.” The Review of Economics and Statistics 79 (3): 372–382. doi:10.1162/003465300556968.
- Martin, W., and C. S. Pham. 2020. “Estimating the Gravity Model When Zero Trade Flows are Frequent and Economically Determined.” Applied Economics 52 (26): 2766–2779. doi:10.1080/00036846.2019.1687838.
- Nguyen, D. B., A. Bouët, and F. Traoré. 2022. “On the Proper Computation of Ad Valorem Equivalent of Non-Tariff Measures.” Applied Economics Letters 29 (4): 298–302. doi:10.1080/13504851.2020.1864273.
- Rodrik, D. 1995. “Political Economy of Trade Policy.” Handbook of International Economics 3: 1457–1494. doi:10.1016/S1573-4404(05)80008-5.
- Santos Silva, J. M. C. 2016. “PPML with Panel data”, Comment on Statalist, Statcorp. Accessed 16 December 2021. https://www.statalist.org/forums/forum/general-stata-discussion/general/1349625-ppml-with-panel-data.
- Santos Silva, J. M. C., and S. Tenreyro. 2006. “The Log of Gravity.” The Review of Economics and Statistics 88 (4): 641–658. doi:10.1162/rest.88.4.641.
- Shepherd, B. 2016. The Gravity Model of International Trade: A User Guide (An Updated Version). Bangkok: United Nations Economic and Social Commission for Asia and the Pacific. https://hdl.handle.net/20.500.12870/71.
- Trefler, D. 1993. “Trade Liberalization and the Theory of Endogenous Protection: An Econometric Study of US Import Policy.” The Journal of Political Economy 101 (1): 138–160. doi:10.1086/261869.
- UNCTAD, M. A. S. T. 2019. International classification of non-tariff measures: 2019 version, New York: United Nations Publications. https://unctad.org/webflyer/international-classification-non-tariff-measures-2019-version
- UNCTAD TRAINS. 2019. TRAINS: Global Database on Non-Tariff Measures, United Nations Conference on Trade and Development, Geneva. Accessed 25 January 2019.
- USITC. 2021. Global Economic Impact of Missing and Low Pesticide Maximum Residue Levels, Vol. 2, Washington DC: United States International Trade Commission. publication number 5160
- WTO 2023. EPing SPS & TBT Platform, World Trade Organization, Geneva, accessed 18 Feb 2023. https://epingalert.org/en/Search/Index.
- Xiong, B., and J. Beghin. 2014. “Disentangling Demand-Enhancing and Trade-Cost Effects of Maximum Residue Regulations.” Economic Inquiry 52 (3): 1190–1204. doi:10.1111/ecin.12082.
- Yue, C., J. Beghin, and H. Jensen. 2006. “Tariff Equivalent of Technical Barriers to Trade with Imperfect Substitution and Trade Costs.” American Journal of Agricultural Economics 88 (4): 947–960. doi:10.1111/j.1467-8276.2006.00908.x.
- Zeileis, A., and T. Lumley. 2022. Sandwich: Robust Covariance Matrix Estimators, R Package Version 3.0-1. Accessed 8 December 2022. https://sandwich.r-forge.r-project.org/.