
 ?Mathematical formulae have been encoded as MathML and are displayed in this HTML version using MathJax in order to improve their display. Uncheck the box to turn MathJax off. This feature requires Javascript. Click on a formula to zoom.
ABSTRACT
Capsule: Diversionary feeding reduced Hen Harrier Circus cyaneus nestlings’ natural food intake by half. Red Grouse Lagopus lagopus scotica chicks constituted 0–4% of all nestling food items. Annually, this reduced annual grouse chick production by 0–6%.
Aim: To quantify proportions of diversionary and natural food (including grouse) delivered to Hen Harrier nestlings in relation to brood size, male status and natural prey abundance.
Methods: We recorded diversionary food provisioned to 25 Hen Harrier broods (2008–15) and studied the diet of 15 broods using observations from hides, nest cameras and regurgitated pellet analysis. Variation in nestling diet was analysed using compositional analysis.
Results: Hen Harriers took 76% of diversionary food provided. Depending on assessment method, average nestling diet was 44–53% diversionary food, 39–55% natural prey (including 24–45% passerines, 4–15% small mammals, 0–4% grouse chicks) and 0–9% unknown items. The amount of diversionary food consumed was not influenced by male status, brood size or natural prey abundance. The number of Red Grouse chicks delivered annually was 34–100% lower than expected under unfed conditions, however, the confidence intervals associated with these estimates were large.
Conclusion: Diversionary food influenced Hen Harrier nestling diet and reduced the number of Red Grouse chicks taken relative to modelled predictions. It may help reduce conflict between Hen Harrier conservation and Red Grouse shooting, but only if overall grouse productivity is thereby maintained or increased.
Conflicts between wildlife conservation and other human interests (‘conservation conflicts’; Redpath et al. Citation2013) are an increasing and challenging problem (Conover Citation2002, Thompson et al. Citation2010, Redpath et al. Citation2015). In parts of Europe, conflict has emerged between gamebird management and raptor conservation, especially in areas where gamebirds are of economic importance, as raptors may reduce the numbers of gamebirds available for hunting (Valkama et al. Citation2005, Park et al. Citation2008).
One well-documented example is the conflict between the conservation of raptors, particularly Hen Harriers Circus cyaneus, and Red Grouse Lagopus lagopus scotica shooting in Britain (Thirgood & Redpath Citation2008, Thompson et al. Citation2009). All raptors are protected under British law and several species, including the Hen Harrier, are also listed under Annex 1 of the European Community Birds Directive (2009/147/EC). Nevertheless, the conservation status of Hen Harriers and other raptors, such as the Peregrine Falco peregrinus and Golden Eagle Aquila chrysaetos, is constrained in some regions by illegal killing on grouse moors as they are perceived as a risk to shooting interests (Etheridge et al. Citation1997, Whitfield et al. Citation2004, Sim et al. Citation2007, Amar et al. Citation2012, Whitfield & Fielding Citation2017). This conflict has focused particularly on the Hen Harrier, as they can limit Red Grouse numbers and reduce shooting bags so that ‘driven’ grouse shooting, a frequent practice in the UK requiring high densities, becomes economically unviable (Redpath & Thirgood Citation1999, Thirgood et al. Citation2000b, New et al. Citation2012). In contrast to ‘walked-up’ shooting, which usually occurs at lower gamebird densities, driven shooting is associated with greater management intensity (e.g. habitat management, predator and parasite control) to deliver the greater densities required (Sotherton et al. Citation2009). In Britain, driven grouse shooting is considered an important economic factor (Sotherton et al. Citation2009) that helps maintain Heather Calluna vulgaris moorland (Robertson et al. Citation2001), which is an internationally important habitat (Thompson et al. Citation1995), although some aspects are contentious with respect to their deemed environmental impacts (summarized in Thompson et al. Citation2016, but see Sotherton et al. Citation2017). The legal control of generalist predators (e.g. Red Fox Vulpes vulpes and Carrion Crow Corvus corone) on grouse moors not only benefits Red Grouse, but also other birds of high conservation concern such as Eurasian Curlew Numenius arquata, European Golden Plover Pluvialis apricaria and Black Grouse Tetrao tetrix (Tharme et al. Citation2001, Warren & Baines Citation2004, Baines et al. Citation2008, Fletcher et al. Citation2010, Douglas et al. Citation2014). Hen Harriers, being ground-nesting, may also benefit from fewer predators, particularly foxes (Baines & Richardson Citation2013, Ludwig et al. Citation2017). However, on a larger scale, this benefit is out-weighed by the negative effects of illegal control (Etheridge et al. Citation1997, Green & Etheridge Citation1999, Whitfield et al. Citation2008, Fielding et al. Citation2011).
Focusing solely on law enforcement has to-date not stopped the illegal killing of raptors, and it is evident that other approaches that seek to reduce the impact of raptors on Red Grouse, and thus the motivation for killing raptors, are required (Redpath et al. Citation2010). Several such mitigation measures have been suggested and include habitat manipulation, reducing Hen Harrier densities or brood management (Thirgood et al. Citation2000a, Redpath et al. Citation2010). However, the least controversial technique has been to provide diversionary food to Hen Harrier broods, which, when experimentally tested, resulted in 64–94% fewer grouse chicks fed to harrier broods (Redpath et al. Citation2001c). Diversionary feeding has also been used successfully to reduce predation by Common Buzzard Buteo buteo and European Sparrowhawk Accipiter nisus on Pheasants Phasianus colchicus at release pens (Parrott Citation2015).
In this study, we investigated the uptake of diversionary food by Hen Harriers in relation to natural prey abundance, harrier brood size, and whether male harriers simultaneously provisioned one or more broods. Natural prey for breeding Hen Harriers includes passerines, small mammals, grouse and wader chicks, and young Rabbits Oryctolagus cuniculus, with the relative importance of these varying between studies (Redpath et al. Citation2001a, Amar et al. Citation2003). As the relative abundance of prey species affects raptor diets (Graham et al. Citation1995, Nielsen Citation1999, Redpath & Thirgood Citation1999), we hypothesized that the uptake of diversionary food will be higher when the abundance of natural prey is low, when Hen Harrier broods contain more chicks (Dijkstra et al. Citation1990), or when a male has more than one brood to provision (Redpath et al. Citation2001c, Redpath et al. Citation2006). We also examined the frequency of scavenging of diversionary food by other predators. Finally, we assessed the number of grouse chicks taken by Hen Harriers in comparison with the number of chicks expected to be taken without diversionary feeding, and whether any reduction was sufficient, in combination with a wider programme of grouse moor management, to achieve our primary management objective of increasing grouse density to a level which would sustain economically viable driven shooting.
Methods
Study area
The study was conducted between 2008 and 2015 at Langholm Moor, southwest Scotland (55.219°N 2.885°W), as part of a larger project to help resolve conflict between raptor conservation and Red Grouse shooting (Langholm Moor Demonstration Project Citation2014). The 115 km2 site, dominated by Heather moorland and acid grassland, included most of the Langholm-Newcastleton Hills Special Protection Area (notified in 2001 for breeding Hen Harriers) and Site of Special Scientific Interest (notified in 1985 for the upland breeding bird and habitat assemblage). The core Red Grouse habitat extended over approximately 30 km2 of Heather moorland where Heather was either dominant or co-dominant in the sward.
In 2008, management was re-established on Langholm Moor aiming to restore driven Red Grouse shooting, which last occurred in 1996 (Redpath & Thirgood Citation1997). The project employed five gamekeepers to manage Heather by rotational burning and cutting, and to legally cull generalist predators such as Red Fox, Stoat Mustela erminea, Weasel Mustela nivalis and corvids (except Raven Corvus corax), whilst agri-environment funds from the Scottish Rural Development Programme were used to help restore Heather habitat extent for Red Grouse by reducing numbers of grazing Sheep Ovis aries. However, the habitat restoration was not fully put into place until 2011, when sheep were removed from 38 km2 of Heather moorland and acid grassland.
Between 1950 and 1996, when shooting ended, on average 1815 (± 176 se) Red Grouse were shot per annum (Redpath & Thirgood Citation1997), thus, the management objective was to harvest 2000 grouse in any one year of the project’s ten-year duration. We calculated that this would require an average pre-shooting density of 200 birds km−2 within the 30 km2 of Heather habitat and for a third of those birds to be shot. Achieving this would demonstrate progression towards financial viability of the shoot (Langholm Moor Demonstration Project Citation2014).
The study was not experimental but predetermined by the objectives of the Demonstration Project. As the recovery of the Red Grouse population was a key priority, all Hen Harrier broods received diversionary food, thus precluding comparison with broods simultaneously not receiving diversionary food.
Diversionary feeding
Hen Harrier nests were located in April-June by observing birds displaying, nest-building, transporting prey or performing food-passes (Hardey et al. Citation2013). At nests with polygamous males, the female which laid eggs first was classified as the primary female, the other as the secondary female; we also recorded one tertiary female. Nests were visited at least three times: during incubation to record clutch size, within a week after hatching to record the number of chicks hatched and shortly before fledging to record the number of chicks reared. Between 2008 and 2015, there were 32 nesting attempts, of which 7 failed before hatching (including the tertiary female). Twenty-five attempts successfully hatched chicks, of which 108 fledged (mean ± se = 4.3 ± 0.3 chicks per successful attempt). All nestlings were fitted with British Trust for Ornithology numbered metal rings; in addition, 67 chicks were individually marked with either patagial tags or colour rings, and 15 were fitted with satellite transmitters by Natural England.
Diversionary food was provided post-hatching in 2008–15 to all 25 broods following methods given in Redpath et al. (Citation2001c). Two or three feeding posts were erected during the late-incubation period approximately 20 m from each nest. Once chicks hatched, diversionary food (dead day-old poultry chicks Gallus gallus domesticus and rats Rattus norvegicus in a ratio of 3:1, both with a colour of white to distinguish them from natural prey) was provided daily for up to 60 days until the harrier chicks dispersed from the vicinity of the nest. Hen Harrier chicks fledge at around 35 days but usually remain close to the nest site for another 25 days (Redpath & Thirgood Citation1997). The provision of diversionary food started on average 3 (± 3 sd) days after hatching. Two nests were found 17 and 21 days after hatching, thus diversionary feeding started later at these nests. In five cases where the adults did not take food from the feeding posts within the first five days, some food items were also placed on the nest edge to encourage acceptance, until the diversionary food was taken from the posts. The amount of food provided increased with brood age, from approximately 40 g per chick per day in week one to 185 g in week five and thereafter (see guidance in Scottish Natural Heritage Citation2010). Any food remaining on the posts the next day was removed. To assess the uptake of diversionary food, we recorded the number of food items provided and those remaining per day per nest site. No Hen Harriers abandoned their chicks despite daily visits to provide diversionary food.
Redpath et al. (Citation2001c) found low scavenging rates by other predators, which was supported by observations during the early project years. In 2014, however, we observed Ravens taking diversionary food at two nest sites and Short-eared Owls Asio flammeus removing food at night. Hence, trail cameras (Spypoint Tiny-W3, GG Telecom, Canada) were set up a week after hatching at the feeding posts at six nests in 2015 and maintained until feeding stopped, to determine the amount of diversionary food consumed by harriers and scavenged by other birds.
Hen Harrier nestling diet
Prey fed to Hen Harrier chicks was quantified for 15 broods by up to three methods: observations from a hide, nest cameras and regurgitated pellet analysis (). Prey was classified as either diversionary or natural. Some prey items could not be identified, for example when the female or nestlings obstructed the camera, and were classified as unknown. Natural prey was further categorized as passerine, small mammal, grouse or other (Redpath & Thirgood Citation1999).
Table 1. Hen Harrier broods provided with diversionary food 2008–15. Male status: 1 = monogamous, 2 = polygamous (* with tertiary female); female status: 1 = monogamous, 2 = primary female of a polygamous male, 3 = secondary female of a polygamous male. # excluded from analysis.
Between 2008 and 2012, prey deliveries to seven nests were observed from a hide, which had been gradually moved closer to the nest during incubation. At hatching, the hide was 5–7 m from the nests (i.e. at an equal distance to the nests as in a previous study; Redpath et al. Citation2001c). Each brood was observed for a mean (± se) of 41 ± 1 hours, with at least one 6-hour watch per week until fledging.
Between 2010 and 2015, a solar-powered high-resolution camera (VB60EH-VF, Outersight UK) was placed 0.5–1 m from eight nests for a mean (± se) of 15 ± 3 days after hatching and disguised with heather. In 2010–13 the camera was set up for an average of nine days per nest, covering the later chick-rearing period (starting at a mean of 19 days and ending at a mean of 31 days after hatching). In 2014 and 2015, cameras covered on average 30 days per nest (from a mean of 8 days to a mean of 36 days after hatching), providing 77% of all video recordings between 2010 and 2015.
In six of the eight years (2008–10 and 2013–15), 14 nests and a circle of approximately 5 m radius around each one were searched for regurgitated pellets after chicks fledged (mid-July to mid-August). In addition, any pellets seen during earlier nest visits were collected (June–July). The 204 pellets collected were dried and frozen until the contents were examined. Mammal hairs and bones were identified using Yalden (Citation2009) and Teerink (Citation1991), and feathers using Brown et al. (Citation2003). Diversionary chicks and rats were distinguished from natural prey by the presence of white feathers or fur. Each prey item was assumed to represent one individual unless it was evident that more were present, e.g. when two skulls were in the same pellet (Redpath et al. Citation2001a). For each nest in each year, the percentage of each prey type (diversionary food, passerine, small mammal, grouse, unknown; pooled across pellets), as well as the proportion of pellets containing each prey type, were calculated (Redpath et al. Citation2001a).
For each brood and method, we calculated the proportions of prey types in the diet. Prey delivery rates were calculated for each brood as prey items delivered per 100 hours for nest cameras and hide watches. For each method, the proportions of prey types and prey delivery rates were then presented as means ± se across broods.
Abundance of key prey species
Passerine abundance was estimated annually in 20 Breeding Bird Survey (BBS) squares located within the study area. In each square, the observer walked two parallel 1 km transects, each 250 m from the side of the square and thus separated by 500 m, recording all birds seen or heard (Harris et al. Citation2015). Counts were conducted twice per annum, between mid-April and mid-May (early count), and between mid-May and mid-June (late count). The ‘passerine index’ was calculated as the mean number of Meadow Pipits Anthus pratensis and Sky Larks Alauda arvensis encountered per km on both counts, these being the main passerine species delivered to Hen Harrier nests during an earlier study (Redpath & Thirgood Citation1997).
Field Vole Microtus agrestis abundance was estimated annually through snap-trapping in late March to early April (Redpath et al. Citation1995). Fifty unbaited traps were placed at 5 m intervals over two nights along each of ten transects, giving a total of 1000 trap nights per annum. The ‘vole index’ was calculated as number of voles caught per 100 trap nights.
Red Grouse abundance (birds km−2) was estimated twice annually on ten 0.5 km2 count areas. Pre-breeding densities were estimated in March and post-breeding densities in July. Within each area, the observer walked along parallel transects 150 m apart with a pointer dog quartering the ground on either side of the transect line (mean ± se transect length per count area = 3.3 ± 0.2 km). To ensure comparability with Red Grouse densities from a previous study at the same site (Redpath & Thirgood Citation1997, Redpath et al. Citation2001c) we used total numbers counted. We used the post-breeding counts to calculate average brood size (including females with no chicks as broods of zero) and density of grouse chicks (chicks km−2) in July. To estimate the density of grouse chicks nearer the time when most Hen Harrier chicks were hatching (late May–early June), we calculated a ‘May grouse chick index’ following Redpath & Thirgood (Citation1997), using the average brood size at hatching from radio-tagged Red Grouse females (N = 12–23 per annum):As there were no radio-tagged females in 2008, we used the average brood size at hatching in 2009–15 for the 2008 brood size estimate.
The total number of grouse chicks available in late May within the study area (= annual grouse chick production) was calculated based on 30 km2 of suitable grouse habitat. However, as using numbers counted underestimates ‘true’ density, we repeated this calculation using distance sampling estimates (Buckland et al. Citation2001, Warren & Baines Citation2011). When grouse were located, the number of birds and their perpendicular distance to the transect line was measured. July count data were analysed separately for each year using the program DISTANCE 6.0 (Thomas et al. Citation2010). We used the conventional distance sampling analysis engine with a half-normal key function and cosine adjustment, and selected models giving the best fit on minimum Akaike’s Information Criterion (AIC) scores and χ2 goodness-of-fit tests (Warren & Baines Citation2011). The models provided detection probabilities, expressed as effective strip width (ESW), which was used to calculate the number of grouse chicks per km2 in July for each count area:We then calculated May grouse chick density and annual grouse chick production as above. For analysis, we used both the ‘traditional’ estimate for annual grouse chick production, for ease of comparison with previous studies, and the distance sampling estimate.
Accordingly, we also calculated the distance sampling estimates for the overall grouse spring and July density, which included grouse counted on an additional 18 line transects distributed across the study site (mean ± se transect length = 2.0 ± 0.2 km).
Data analysis
We compared the uptake of diversionary food, i.e. the proportion of food removed from the posts, between nests with polygamous males and nests with monogamous males using a generalized linear model with binomial error and logit link. The number of food items provided was included as binomial total, the number of food items taken from the posts as a response variable, and male status as a factor. Two broods were excluded as we did not have complete data about the amount of food taken from the posts for the whole feeding period. We also tested for differences between nests with primary and secondary females of polygamous males, using female status as a factor. However, all further analysis using diet data included male instead of female status, as the sample size was too low to distinguish between primary and secondary females of polygamous males (). To test whether the acceptance of diversionary food changed over the years, we used linear mixed models with either the ‘annual mean proportion of food removed from the posts’ (p) transformed into a logit ln(p/1−p) or the ‘mean number of days until the food was accepted’ as dependent variables and year as a linear covariate. Year was also included as a random factor as each year could contribute data from different nests.
To analyse which factors influenced the proportion of diversionary food in Hen Harrier nestling diet we used compositional analysis (Aitchison Citation1986). For each brood, the proportion of diversionary food was calculated for each method: identified prey items (N = 2250) were categorized as either diversionary or natural food, and the two values were transformed into one log-ratio ln(diversionary/natural), replacing any zero with 0.01 (Aebischer et al. Citation1993). Because there were two categories only, the transformation was the same as a logit transformation ln(p/(1−p)) of the proportion p of diversionary food. For evaluating diet from pellets, we only included broods with a minimum of ten identified prey items (Whitfield et al. Citation2009; ).
To test for differences in the proportion of diversionary food in nestling diet between methods and years we used a linear mixed model with normal errors, the log-ratio as the dependent variable, and method and year as independent factors. Brood was included as a random effect as the same brood could contribute data from multiple methods. To analyse the effect of male status, defined as either monogamous or polygamous (only one male had more than two females) and brood size on the proportion of diversionary food in the diet, we then included male status and brood size as further independent variables in the model.
To test whether the abundance of the main prey (passerines, small mammals and grouse) varied between years, we analysed annual variation in each prey index using Poisson regression models with the original count data as a response variable, offset adjustments to transform into the respective indices, and year and count area as explanatory variables. We then assessed whether the proportion of diversionary food in nestling diet was affected by availability of natural prey. To avoid pseudo-replication by multiple nests within the same year, we calculated annual means of diet compositions for each method, i.e. separately for hide watches, nest cameras and pellets, which were transformed into annual log-ratio values ln(diversionary food/natural prey). We then used a linear mixed model with each log-ratio as a dependent variable, weighted by the number of broods to take into account the effect of sample size on the accuracy of the means, with method (hide watch, nest camera and pellets) and prey availability indices (passerine, vole and grouse) as independent variables. Year was included as a random factor as each year could contribute data from different methods.
To test whether the proportion of grouse chicks in the natural diet of Hen Harrier nestlings varied between methods and years, we transformed the proportion of grouse and other natural prey items into one log-ratio ln(grouse/other natural prey) for each nest, and used this as dependent variable in a linear mixed model, with method and year as fixed explanatory factors and brood as a random factor.
As the spread of days covered by nest cameras during the chick-rearing period differed between harrier broods, we estimated the effect of week after hatching using a generalized linear model with Poisson distribution and log link function, including the number of grouse chicks delivered per week (= number of grouse chicks per hour × 15 hours daylight × 7 days) after hatching as a dependent variable, and brood and week after hatching as independent factors. This was then used to predict the number of grouse chicks provisioned to each brood across the full 60-day brood-rearing period and calculate the average chick delivery rate per hour. The number of grouse chicks fed to harrier broods in each year was estimated according to Redpath & Thirgood (Citation1997): number of grouse chicks per hour × 15 hours daylight (per day) × number of harrier nests × 60 days (hatching to dispersal). For pellets, we used the annual mean prey delivery rate obtained from hide watches and nest cameras to estimate the total number of prey items fed to harrier broods in each year (prey items per hour × 15 hours daylight × number of harrier nests × 60 days), and then applied the annual proportion of grouse in pellets among all pooled prey items to calculate the number of grouse chicks fed to harrier broods.
We also estimated the theoretical number of grouse chicks that harriers were expected to feed to their broods without diversionary feeding, using two different approaches: one by Redpath & Thirgood (Citation1999) and one by Amar et al. (Citation2004). As both were based on June grouse chick densities, we multiplied May grouse chick densities by 0.741 (se = 0.046), the mean reduction rate between May and June chick densities in 1995 and 1996 (Redpath & Thirgood Citation1997). The standard errors associated with June grouse chick densities were each calculated as the standard error of a product following Seber (Citation1982). The Redpath & Thirgood (Citation1999) approach estimated the delivery rate of grouse chicks in relation to grouse chick density, when harriers are unfed, using a sigmoid curve (Holling Type 3 functional response) as follows:
We used this equation to calculate the expected delivery rate of grouse chicks in 2008–15 based on the respective June grouse chick densities, and then estimated the number of grouse chicks annually fed to harrier broods as above. The second approach followed Amar et al. (Citation2004), who incorporated the percentage of Heather cover within 2 km of a Hen Harrier nest to estimate the same quantity via an exponential relationship:
Heather cover within a radius of 2 km around each nest was measured as the percentage of dwarf shrub heath obtained from the Land Cover Map 2007 (Morton et al. Citation2014). We used this equation to calculate the expected delivery rate for each individual harrier brood, estimated the corresponding number of grouse chicks fed, then summed the numbers within year to obtain a total annual number. We approximated the standard error associated with both estimates from the standard errors of the equation coefficients (provided by Redpath & Thirgood (Citation1999), and derived from the F-statistics in Amar et al. (Citation2004)) using Taylor series linearization (Seber Citation1982); this method is commonly used for complex variance calculations and uses a local linear approximation of nonlinear relationships, which is obtained through differentiation (Seber Citation1982). For presentation, standard errors were transformed into confidence intervals.
All analyses were conducted in GenStat 17.1 (VSN International Citation2014). We calculated Wald statistics, which were transformed into F-statistics where exact transformations existed. The level of significance was set at 0.05, and all means are given ± one standard error.
Results
Uptake of diversionary feeding
Between 2008 and 2015 approximately 5600 rats and 18 400 poultry chicks were provided as diversionary food to 25 Hen Harrier broods. Broods were fed for on average 47 ± 2 days, and diversionary food was taken from the feeding posts on 90 ± 4% of these days (including two nests where food was taken only when put directly into the nest). In total, 76 ± 5% of the diversionary food had been removed from the feeding posts before the next day. It took on average 4.3 ± 1.2 days until the food was accepted; at 14 out of 25 nests the food was taken on the first day, at nine nests food was only taken after 8.0 ± 2.5 days, and at two nests the adults never took food, although the chicks ate the diversionary food placed directly into the nest by project staff and later took food directly from the feeding posts. The proportion of food taken from the posts did not change significantly over the years (slope 0.40 ± 0.28; χ2 = 1.96, df = 1, P = 0.18), but the number of days until the food was accepted tended to decline by one day per year (−1.00 ± 0.52; χ2 = 3.69, P = 0.07). Food was accepted on the first day not only by individually marked local recruits, but also some unringed external recruits (e.g. in 2014, when the number of breeding females increased from 2 to 12; Ludwig et al. Citation2017). The uptake of diversionary food did not differ between nests with polygamous males (85 ± 5% of the diversionary food taken, n = 8, range 59–100%) and nests with monogamous males (72 ± 6% taken, n = 15, range 22–100%; F1,21 = 2.13, P = 0.16). Among the nests of polygamous males, there was no significant difference in food taken from the posts at nests of primary females (83 ± 7%, n = 5) and secondary females (89 ± 10%, n = 3; F1,7 = 0.28, P = 0.62).
The trail cameras set up at the feeding posts of six nests in 2015 provided 1288 pictures of food being taken. Of these, 93% of the food was taken by Hen Harriers (77 ± 7% female, 21 ± 6% male, and 2 ± 2% unsexed) and 7% by Ravens. Male Hen Harriers took food at all nests (four monogamous and one polygamous male, who took food from the feeding posts of each of the two broods he tended). Of the scavenging events by Ravens, 89% occurred after fledging of harrier chicks, i.e. over 4 weeks after hatching.
Hen Harrier nestling diet
In total, 370 prey deliveries were observed during 290 hours of hide watches at seven nests, a rate of 128.3 ± 10.0 items per 100 hours. The delivery rate of diversionary food was 55.4 ± 7.7 items per 100 hours. On average 44 ± 5% of all prey items were diversionary food (36 ± 4% chicks and 8 ± 2% rats), 52 ± 6% were natural prey (45 ± 6% passerine, 4 ± 1% small mammal, and 3 ± 3% lizard), and 4 ± 2% were unidentified (). No grouse chicks were identified during the hide watches.
Figure 1. Mean (±se) proportion of prey items identified during hide watches (n = 7 nests), nest cameras (n = 8 nests) or in regurgitated pellets (n = 10 nests). The total amount of diversionary food (df) includes both poultry chicks and rats.
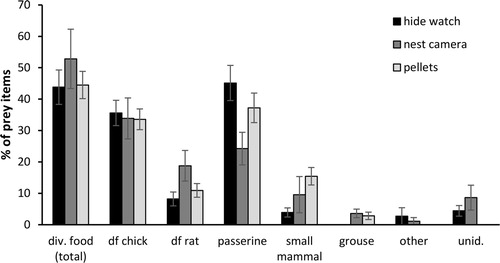
Nest cameras provided 1365 hours of video recordings (171.0 ± 55.2 hours per nest, n = 8 nests), during which 1392 prey items were delivered to broods; a rate of 116.7 ± 23.5 prey items per 100 hours. Diversionary food was delivered at a rate of 67.6 ± 25.6 items per 100 hours. On average 53 ± 10% of prey items were diversionary food (34 ± 7% poultry chicks and 19 ± 5% rats), 39 ± 7% were natural prey (24 ± 5% passerine, 10 ± 6% small mammal, 4 ± 1% grouse chicks and 1 ± 1% other prey, e.g. wader chicks and mustelids) and 9 ± 4% were unidentified (). In total, 25 grouse chicks were identified on nest camera footage.
A total of 204 regurgitated pellets were collected at 14 nests, from which 556 prey items were identified. 87% of pellets contained diversionary food (81% poultry chicks, 29% rats), 69% passerine, 40% small mammal and 8% grouse. At nests with a sufficient number of pellets collected (n = 10 nests, 538 prey items), on average 45 ± 4% of the identified prey items were diversionary food (34 ± 3% poultry chicks, 11 ± 2% rats) and 55 ± 4% were natural prey (37 ± 5% passerine, 15 ± 3% small mammal, and 3 ± 1% grouse chicks). In total, 17 grouse chicks were identified in pellets.
Effect of prey abundance, male status and brood size on brood diet
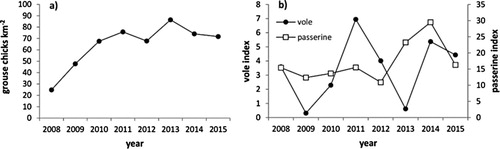
Prey availability varied significantly between years, with no correlation between prey indices (all r < 0.52, P > 0.19). Grouse chick abundance increased between 2008 and 2010 and then remained approximately similar across all other years, being highest in 2013 (F7,70 = 19.36, P < 0.001; (a)). Vole indices cycled, peaking in 2011 and 2014 and crashing in 2009 and 2013 (F7,70 = 9.11, P < 0.001; (b)). The passerine index was stable with 11–16 birds encountered per km in most years, with the exception of increased abundance in 2013 and 2014 (F7,139 = 30.53, P < 0.001; (b)). However, consumption of diversionary food by Hen Harrier broods did not vary in relation to natural prey abundance (N = 17 method-years; passerine: = 1.31, P = 0.31; vole:
= 0.52, P = 0.51; grouse:
= 2.96, P = 0.16) or method of diet assessment (
= 0.21, P = 0.90). The proportion of diversionary food in brood diet was also not affected by male status (N = 25 method-nests;
= 1.79, P = 0.22), brood size (
= 1.78, P = 0.21), method (
= 0.00, P = 1.00) or year (
= 15.62, P = 0.11).
Figure 2. Annual variation in prey abundance (2008–15): (a) May Red Grouse chick index (grouse chicks km−2, n = 10 count areas), (b) Vole index (voles caught per 100 trap nights, n = 10 trap lines) and passerine index (mean number of Meadow Pipits and Sky Larks encountered per km, n = 20 1 × 1-km squares)
Delivery rate of grouse chicks
With no grouse chicks identified during hide watches, the proportion of grouse chicks in the diet varied significantly between methods ( = 18.47, P < 0.001). Cameras or pellets confirmed grouse in the diet of five out of seven broods where hide watches were conducted. Thus, the number of grouse delivered to Hen Harrier nests was estimated separately for each method.
According to nest cameras, grouse chicks were delivered at a mean (± se) rate of 2.5 ± 0.8 per 100 hours, with provisioning rates peaking in mid to late June when grouse chicks were approximately four to five weeks old (week 25–26 of the year; ). The total number of grouse chicks delivered to harrier broods in each year () represented on average 1.7% of the annual grouse chick production (range 0.7–4.2%). Pellets indicated similar provisioning rates, representing on average 2.4% of the annual chick production (range 0–6.2%). However, when the annual grouse chick production was calculated based on distance sampling estimates instead of total numbers counted, these proportions were reduced by approximately 30% (cameras: mean 1.2%, range 0.3–3.0%; pellets: mean 1.6%, range 0–4.5%).
Figure 3. Seasonal change in grouse chick delivery rates as observed by nest cameras (n = 8 broods). Data points represent mean delivery rates per Hen Harrier brood and week of year. As hatch dates varied, not every brood contributed data to each week.
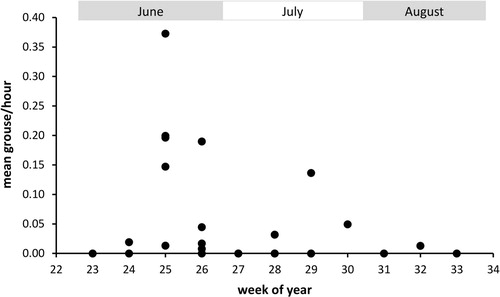
Table 2. Grouse chicks taken by Hen Harriers when given diversionary food (‘fed’) by method of diet assessment (total number and % of those available in May). All values are means, with 95% confidence intervals given in brackets. As the calculation of grouse chicks taken by Hen Harriers was based on predicted delivery rates across the whole 60-day period (see methods), years with only one nest also have an associated CI.
Without diversionary feeding, Hen Harriers would have been expected to provision on average 15% (following Redpath & Thirgood Citation1999, range: 0.3–55%) or 29% (following Amar et al. Citation2004, range 8–78%) of the annual Red Grouse chick production. In comparison with the estimates based on Redpath & Thirgood (Citation1999), diversionary feeding apparently reduced the total number of grouse chicks provisioned to Hen Harrier broods in 2008–15 on average by 82% according to nest cameras (range 54–99%), by 81% according to pellets (range 34–100%), and by 100% according to hide watches (). Using the estimates based on Amar et al. (Citation2004), the reductions were estimated at 92% according to nest cameras (range 80–99%), 93% according to pellets (range 85–100%) and 100% according to hide watches. However, the confidence intervals associated with these estimates were very large, and in some cases included 0–100% ().
Table 3. Numbers of Red Grouse chicks expected to be taken by Hen Harriers under unfed conditions following Redpath & Thirgood (Citation1999) and Amar et al. (Citation2004), and reductions in grouse chick numbers taken by fed Hen Harriers in comparison to unfed conditions, by method of diet assessment (excluding hide watches as all delivery rates were zero). All values are means, with 95% confidence intervals given in brackets.
Red Grouse densities
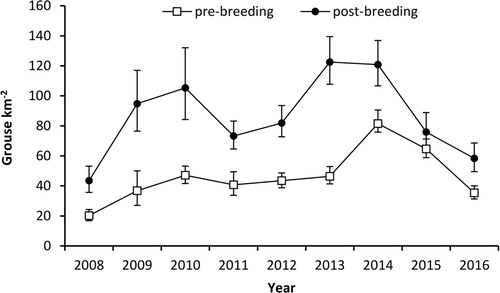
Between 2008 and 2014, pre- and post-breeding densities of grouse derived from distance sampling increased by 9% and 8% per annum, respectively, but declined by 28% and 26% per annum between 2014 and 2016 (). Based on the low spring density of 35 birds km−2 in 2016 and average mortality rates in 2009–15 (27% adult summer mortality, 46% overwinter mortality), we estimated that a productivity of 4.5 young per adult would be needed within the final two years of the 10-year project to reach the target of 200 Grouse km−2 and the management objective. As the average Red Grouse productivity at Langholm was 1.6 young per adult (range 0.8–2.5), this was deemed unrealistic and the management, including diversionary feeding, ceased prematurely in spring 2016.
Figure 4. Annual variation in pre- and post-breeding Red Grouse densities (birds km−2) 2008–16 derived from distance sampling. Error bars represent 95% confidence intervals.
Discussion
Three-quarters of diversionary food provided was taken from the feeding posts, mostly by Hen Harriers and particularly by the female (see also Redpath et al. Citation2001c). The proportion of diversionary food taken did not increase over the years, but the time until acceptance tended to decrease by one day per year. However, most breeding birds were unmarked, so we could not test whether birds reluctant to accept the food were showing any habituation effects in subsequent years. As Hen Harriers defend the immediate surroundings of their nest (Hardey et al. Citation2013), scavenging by other species, largely Ravens, was infrequent and almost entirely after fledging. Observations in previous years indicated occasional visits by Carrion Crows, Rooks Corvus frugilegus and Short-eared Owls, while mammalian predators, gulls Larus sp. or other raptors were not observed.
Diversionary food formed 44–53% of Hen Harrier brood diet, which is comparable to the 47% observed during an earlier study at the same site (Redpath et al. Citation2001b). In contrast to our hypotheses, diversionary food consumption was unrelated to natural food availability, brood size or male status.
Delivery of grouse chicks
All Hen Harrier broods were provided with diversionary food, preventing comparison of diet with unfed broods in the same year. Grouse chicks formed only 0–4% of Hen Harrier brood diet overall. Annually, this represented 0–6% of the annual Red Grouse chick production, and 0–2% averaged across years. This is low compared to the 12% grouse in nestling diet observed during 1992–96, when no harrier broods were given supplementary food (Redpath & Thirgood Citation1999). In 1995/96, Hen Harriers took 28% of the annual Red Grouse chick production (Redpath et al. Citation2001c). However, in 1998/99 the proportion of grouse chicks in the diet of unfed broods was 5% (Redpath et al. Citation2001b), equivalent to 6.5% of annual grouse chick production, which may have been partly a result of lower grouse chick density during these years (53.4 ± 10) compared to earlier years (75.8 ± 3.4) (Redpath et al. Citation2001c). Average Red Grouse chick density in our study was intermediate at 67.9 ± 8.0.
No grouse chicks were seen delivered to Hen Harrier nests during hide watches. By comparison, Redpath et al. (Citation2001c) reported a rate of 0.5 chicks per 100 hours with the same method at fed broods in 1998/99. Nest cameras and pellet analysis showed higher proportions of grouse in the diet (4% and 3%, respectively), and the average provisioning rate of 2.5 grouse chicks per 100 hours observed by nest cameras was considerably higher than that observed by Redpath et al. (Citation2001c). When diet was assessed by multiple methods at the same nest, both cameras and pellets revealed grouse in the diet of five out of seven broods, whereas none was identified during hide watches. This underestimation of grouse predation rates by hide watches may have been related to the limited number of observation hours. However, we also cannot exclude an observer effect as the analysis of camera recordings was done by a different person than the two hide watch observers (see Acknowledgements).
The estimated number of grouse chicks taken by supplementary fed Hen Harriers was lower than expected under unfed conditions, although the scale of the observed reduction varied with the method of diet assessment, the method of estimating grouse chick delivery rates at unfed nests, and year. While hide watches suggested a 100% reduction in grouse chick delivery rates, cameras and pellet analysis indicated an average reduction of 82% (range 54–99%) and 81% (range 34–100%) when estimates for unfed nests were calculated following Redpath & Thirgood (Citation1999), and an average reduction of 92% (range 80–99%) and 93% (range 85–100%), respectively, when using the estimates based on Amar et al. (Citation2004). The estimated reduction was larger in the latter than in the former case because the Amar et al. (Citation2004) equation produced higher annual estimates of grouse chick delivery rates than the Redpath & Thirgood (Citation1999) equation in all years. This was probably because of a combination of the exponential nature of the Amar et al. (Citation2004) equation as well as instances of annual grouse chick density and % Heather cover exceeding those used to generate the equation. Thus for 52% (13 out of 25) of Hen Harrier nests in this study, the delivery rate calculated using the Amar et al. (Citation2004) equation was higher than the maximum delivery rate of 0.18 observed in the original Amar et al. (Citation2004) data. By contrast, none of the delivery rate estimates produced by the Redpath & Thirgood (Citation1999) equation exceeded 0.18, because of the sigmoid nature of the curve. In our study, results obtained using the Redpath & Thirgood (Citation1999) equation seem thus more reliable than those obtained using the Amar et al. (Citation2004) equation. Excluding hide watches, our annual reduction rates were comparable to the 64–94% observed by Redpath et al. (Citation2001c) although the inter-annual variation was greater in our study, which may be explained by a combination of fewer Hen Harrier nests per year and a longer study period of eight rather than two years. Hence, diversionary feeding seemed effective in reducing predation on Red Grouse chicks. It must be stressed, however, that the large confidence intervals associated with these estimates mean that the scale of the reduction remains uncertain.
Success of diversionary feeding
Using success criteria suggested by Kubasiewicz et al. (Citation2016), diversionary feeding of Hen Harriers was partially successful, meeting two of the three criteria: the uptake of diversionary food was high, with diversionary food constituting almost half of brood diet, and food provision lowered annual grouse chick delivery rates by 34–100% relative to modelled predictions. Nevertheless, feeding Hen Harriers alongside grouse moor management did not collectively result in the third criterion being met, in that there were insufficient grouse to deliver the management objective of economically viable driven shooting. However, as this study was not experimental, we could not disentangle the potential benefits of diversionary feeding on grouse densities from those of other management components.
Despite a three-fold increase since 2008, the peak post-breeding estimates of 123 and 121 Red Grouse km−2 in 2013 and 2014, derived from distance sampling, fell short of the threshold of 133 birds km−2 at which driven shooting occurred elsewhere (Elston et al. Citation2014) and the project’s target of 200 birds km−2. When using the traditional density estimates, these peaks in 2013 and 2014 were however comparable to those in 1993 and 1994, when driven grouse shooting produced bags of 523 and 284 birds, respectively (Redpath and Thirgood Citation1997). However, this was followed by decreases in both spring densities and bag size in the next three years (Redpath & Thirgood Citation1997), after which shooting ceased altogether. Thus, with the benefit of hindsight, no shooting occurred in 2013 or 2014. Despite this conservative approach, Red Grouse density decreased in 2015 (Ludwig et al. Citation2017), and predictive modelling using mean rates of productivity and survival indicated no realistic chance of attaining the target density within the remaining two years of the project (Ludwig et al. unpubl. data).
Redpath et al. (Citation2001c) also found no benefit of diversionary feeding of Hen Harriers on post-breeding grouse density or productivity, despite a 64–94% reduction in annual grouse provisioning rates to fed Hen Harrier broods; however, only half of the broods were fed. From this, New et al. (Citation2012) implied that diversionary feeding may be unsuitable as a stand-alone mitigation technique at Langholm, but instead may be effective when applied alongside other management actions. By combining diversionary feeding with habitat improvement and control of predators and grouse parasites, we tested and rejected this suggestion, having found no overall sustained increase in Red Grouse numbers to a level that would permit economically viable driven shooting. However, grouse recovery may have been constrained by multiple interacting factors, including predation by other grouse-eating raptors (Valkama et al. Citation2005, Park et al. Citation2008, Francksen et al. Citation2017), the impact of inclement weather, especially on chicks (Erikstad Citation1985), insufficient progress with habitat recovery (Miller et al. Citation1966), or, in 2015, increased Red Fox and Carrion Crow indices and the discontinuation of parasite worm control in Red Grouse (Ludwig et al. Citation2017).
Diversionary feeding of Harriers may still help to restore or maintain driven shooting on other moors (New et al. Citation2012). However, stakeholders may be resistant to adopting this technique without better evidence that it can be an integrated component of grouse moor management that contributes to commercially sustainable harvesting.
Endnotes – author contribution to data collection
Observer turn-over varied during this long-term study, and fieldwork involved some of the authors as well as additional field assistants. The authors contributed to data collection in the following ways: AM and PK carried out hide watches, collected pellets and recorded passerine and vole abundance in 2008–12. AM, CB and SL set up nest cameras. RF analysed video data and pellets, and DBu and SR contributed to recording passerine abundance. Grouse counts were conducted by DBu, SL and DBa.
Acknowledgements
All fieldwork was conducted under SNH Schedule 1 licence. We are grateful to K. Bell, T. Chamberlain, P. Golder, K. Hazelwood, M. Hotson, A. McWilliam, T. Pringle, E. Rooney, A. Walton and J. White for assistance with Hen Harrier monitoring and other fieldwork. We also thank H. Greetham and E. Trevail for their help with analysing nest camera recordings and pellets, A. Johnstone, S. Lester and J. Smith for feeding Hen Harriers, and T. Lightly for providing an additional nest camera in 2015. Comments of D. Thompson, J. Wilson, S. Redpath, P. Whitfield and an anonymous reviewer helped to improve earlier drafts of this manuscript.
ORCID
Sonja C. Ludwig http://orcid.org/0000-0003-3209-0568
Staffan Roos http://orcid.org/0000-0002-4088-2875
Additional information
Funding
References
- Aebischer, N.J., Robertson, P.A. & Kenward, R.E. 1993. Compositional analysis of habitat use from animal radio-tracking data. Ecology 74: 1313–1325. doi: 10.2307/1940062
- Aitchison, J. 1986. The Statistical Analysis of Compositional Data. The Blackburn Press, London.
- Amar, A., Redpath, S.M. & Thirgood, S.J. 2003. Evidence for food limitation in the declining hen harrier population on the Orkney Islands, Scotland. Biol. Conserv. 111: 377–384. doi: 10.1016/S0006-3207(02)00306-3
- Amar, A., Arroyo, B., Redpath, S.M. & Thirgood, S.J. 2004. Habitat predicts losses of red grouse to individual hen harriers. J. Appl. Ecol. 41: 305–314. doi: 10.1111/j.0021-8901.2004.00890.x
- Amar, A., Court, I.R., Davison, M., Downing, S., Grimshaw, T., Pickford, T. & Raw, D. 2012. Linking nest histories, remotely sensed land use data and wildlife crime records to explore the impact of grouse moor management on peregrine falcon populations. Biol. Conserv. 145: 86–94. doi: 10.1016/j.biocon.2011.10.014
- Baines, D., Redpath, S.M., Richardson, M. & Thirgood, S.J. 2008. The direct and indirect effects of predation by Hen Harriers Circus cyraneus on trends in breeding birds on a Scottish grouse moor. Ibis 150: 27–36. doi: 10.1111/j.1474-919X.2008.00848.x
- Baines, D. & Richardson, M. 2013. Hen harriers on a Scottish grouse moor: multiple factors predict breeding density and productivity. J. Appl. Ecol. 50: 1397–1405. doi: 10.1111/1365-2664.12154
- Brown, D., Ferguson, R., Lawrence, J. & Lees, M. 2003. Tracks and Signs of the Birds of Britain and Europe: An Identification Guide. Christopher Helm, London.
- Buckland, S.T., Anderson, D.R., Burnham, K.P., Laake, J.L., Borchers, D.L. & Thomas, L. 2001. Introduction to Distance Sampling. Oxford University Press, Oxford.
- Conover, M. 2002. Resolving Human-Wildlife Conflicts: The Science of Wildlife Management. Lewis Publishers, CRC Press LLC, Boca Raton.
- Dijkstra, C., Bult, A., Bijlsma, S., Daan, S., Meijer, T. & Zijlstra, M. 1990. Brood size manipulations in the kestrel (Falco tinnunculus): effects on offspring and parent survival. J. Anim. Ecol. 59: 269–285. doi: 10.2307/5172
- Douglas, D.J.T., Bellamy, P.E., Stephen, L.S., Pearce–Higgins, J.W., Wilson, J.D., Grant, M.C. & Fuller R. 2014. Upland land use predicts population decline in a globally near-threatened wader. J. Appl. Ecol. 51: 194–203. doi: 10.1111/1365-2664.12167
- Elston, D.A., Spezia, L., Baines, D., Redpath, S.M. & Elphick C. 2014. Working with stakeholders to reduce conflict – modelling the impact of varying hen harrier Circus cyaneus densities on red grouse Lagopus lagopus populations. J. Appl. Ecol. 51: 1236–1245. doi: 10.1111/1365-2664.12315
- Etheridge, B., Summers, R.W. & Green, R.E. 1997. The effects of illegal killing and destruction of nests by humans on the population dynamics of the hen harrier Circus cyaneus in Scotland. J. Appl. Ecol. 34: 1081–1105. doi: 10.2307/2405296
- Erikstad, K.E. 1985. Growth and survival of willow grouse chicks in relation to home range size, brood movements and habitat selection. Ornis Scand. 16: 181–190. doi: 10.2307/3676629
- Fielding, A., Haworth, P., Whitfield, P., McLeod, D. & Riley, H. 2011. A conservation framework for hen harriers in the United Kingdom. JNCC Report 441. Joint Nature Conservation Committee, Peterborough.
- Fletcher, K., Aebischer, N.J., Baines, D., Foster, R. & Hoodless, A.N. 2010. Changes in breeding success and abundance of ground-nesting moorland birds in relation to the experimental deployment of legal predator control. J. Appl. Ecol. 47: 263–272. doi: 10.1111/j.1365-2664.2010.01793.x
- Francksen, R.F., Whittingham, M.J., Ludwig, S.C., Roos, S. & Baines, D. 2017. Numerical and functional responses of Common Buzzard Buteo buteo on a Scottish grouse moor. Ibis 159:541–553. doi: 10.1111/ibi.12471
- Graham, I.M., Redpath, S.M. & Thirgood, S.J. 1995. The diet and breeding density of Common Buzzards Buteo buteo in relation to indices of prey abundance. Bird Study 42: 165–173. doi: 10.1080/00063659509477162
- Green, R. E. & Etheridge, B. 1999. Breeding success of the hen harrier Circus cyaneus in relation to the distribution of grouse moors and the red fox Vulpes vulpes. J. Appl. Ecol. 36: 472–483. doi: 10.1046/j.1365-2664.1999.00419.x
- Hardey, J., Crick, H., Wernham, C., Riley, H., Etheridge, B. & Thompson, D. 2013. Raptors: A Field Guide for Surveys and Monitoring. The Stationery Office, Edinburgh.
- Harris, S.J., Massimino, D., Newson, S.E., Eaton, M.A., Balmer, D.E., Noble, D.G., Musgrove, A.J., Gillings, S., Procter, D. & Pearce-Higgins, J.W. 2015. The Breeding Bird Survey 2014. BTO Research Report 673. British Trust for Ornithology, Thetford.
- Kubasiewicz, L.M., Bunnefeld, N., Tulloch, A.I.T., Quine, C.P. & Park, K.J. 2016. Diversionary feeding: an effective management strategy for conservation conflict? Biodivers. Conserv. 25: 1–22. doi: 10.1007/s10531-015-1026-1
- Langholm Moor Demonstration Project. 2014. The Langholm Moor Demonstration Project: Seven Year Review – December 2014. www.langholmproject.com.
- Ludwig, S.C., Roos, S., Bubb, D. & Baines, D. 2017. Long-term trends in abundance and breeding success of red grouse and hen harriers in relation to changing management of a Scottish grouse moor. Wildl. Biol. 2017: wlb.00246.
- Miller, G.R., Jenkins, D. & Watson, A. 1966. Heather performance and red grouse populations. I. Visual estimates of heather performance. J. Appl. Ecol. 3: 313–326. doi: 10.2307/2401255
- Morton, R. D., Rowland, C. S., Wood, C. M., Meek, L., Marston, C. G. & Smith, G. M. 2014. Land Cover Map 2007 (vector, GB) v1.2. NERC Environmental Information Data Centre.
- New, L.F., Buckland, S.T., Redpath, S. & Matthiopoulos, J. 2012. Modelling the impact of hen harrier management measures on a red grouse population in the UK. Oikos 121: 1061–1072. doi: 10.1111/j.1600-0706.2011.19958.x
- Nielsen, Ó.K. 1999. Gyrfalcon predation on ptarmigan: numerical and functional responses. J. Anim. Ecol. 68: 1034–1050. doi: 10.1046/j.1365-2656.1999.00351.x
- Park, K.J., Graham, K.E., Calladine, J. & Wernham, C.W. 2008. Impacts of birds of prey on gamebirds in the UK: a review. Ibis 150: 9–26. doi: 10.1111/j.1474-919X.2008.00847.x
- Parrott, D. 2015. Impacts and management of common buzzards Buteo buteo at pheasant Phasanius colchicus release pens in the UK: a review. Eur. J. Wildlife Res. 61: 181–197. doi: 10.1007/s10344-014-0893-1
- Redpath, S.M. & Thirgood, S.J. 1997. Birds of Prey and Red Grouse. The Stationery Office, London.
- Redpath, S.M. & Thirgood, S.J. 1999. Numerical and functional responses in generalist predators: hen harriers and peregrines on Scottish grouse moors. J. Anim. Ecol. 68: 879–892. doi: 10.1046/j.1365-2656.1999.00340.x
- Redpath, C.J., Thirgood, S.J. & Redpath, S.M. 1995. Evaluation of methods to estimate field vole Microtus agrestis abundance in upland habitats. J. Zool. 237: 49–55. doi: 10.1111/j.1469-7998.1995.tb02745.x
- Redpath, S.M., Clarke, R., Madders, M. & Thirgood, S.J. 2001a. Assessing raptor diet: comparing pellets, prey remains, and observational data at hen harrier nests. Condor 103: 184–188. doi: 10.1650/0010-5422(2001)103[0184:ARDCPP]2.0.CO;2
- Redpath, S.M., Thirgood, S.J., Leckie, F., Lock, K.A. & Campbell, S. 2001b. Management trial to reduce hen harrier predation on red grouse at Langholm in 1998 and 1999: the effect of providing hen harriers with supplementary food. Scottish National Heritage Commissioned Report F99AC419.
- Redpath, S.M., Thirgood, S.J. & Leckie, F.M. 2001c. Does supplementary feeding reduce predation of red grouse? J. Appl. Ecol. 38: 1157–1168. doi: 10.1046/j.0021-8901.2001.00683.x
- Redpath, S.M., Leckie, F.M., Arroyo, B., Amar, A. & Thirgood, S.J. 2006. Compensating for the costs of polygyny in hen harriers Circus cyaneus. Behav. Ecol. Sociobiol. 60: 386–391. doi: 10.1007/s00265-006-0176-2
- Redpath, S.M., Amar, A., Smith, A., Thompson, D. & Thirgood, S.J. 2010. People and nature in conflict: can we reconcile hen harrier conservation and game management? In Baxter, J. & Galbraith, C.A. (eds) Species Management: challenges and solutions for the 21st century, 335–350. The Stationary Office, Edinburgh.
- Redpath, S.M., Young, J., Evely, A., Adams, W.M., Sutherland, W.J., Whitehouse, A., Amar, A., Lambert, R.A., Linnell, J.D., Watt, A. & Gutiérrez, R.J. 2013. Understanding and managing conservation conflicts. Trends Ecol. Evol. 28: 100–109. doi: 10.1016/j.tree.2012.08.021
- Redpath, S.M., Gutiérrez, R.J., Wood, K.A. & Young, J.C. 2015. Conflicts in Conservation: navigating towards solutions. Cambridge University Press, Cambridge.
- Robertson, P.A., Park, K.J. & Barton, A.F. 2001. Loss of heather Calluna vulgaris moorland in the Scottish uplands: The role of red grouse Lagopus lagopus scoticus management. Wildl. Biol. 7: 11–16. doi: 10.2981/wlb.2001.004
- Scottish Natural Heritage. 2010. Diversionary Feeding of hen Harriers on Grouse Moors – A Practical Guide. Scottish Natural Heritage, Perth.
- Seber, G.A.F. 1982. Estimation of Animal Abundance and Related Parameters. Griffin, London.
- Sim, I.M.W., Dillon, I.A., Eaton, M.A., Etheridge, B., Lindley, P., Riley, H., Saunders, R., Sharpe, C. & Tickner, M. 2007. Status of the Hen Harrier Circus cyaneus in the UK and Isle of Man in 2004, and a comparison with the 1988/89 and 1998 surveys. Bird Study 54: 256–267. doi: 10.1080/00063650709461482
- Sotherton, N., Tapper, S. & Smith, A. 2009. Hen harriers and red grouse: economic aspects of red grouse shooting and the implications for moorland conservation. J. Appl. Ecol. 46: 955–960. doi: 10.1111/j.1365-2664.2009.01688.x
- Sotherton, N., Baines, D. & Aebischer, N.J. 2017. An alternative view of moorland management for red grouse Lagopus lagopus scotica. Ibis 159: 693–698. doi: 10.1111/ibi.12489
- Teerink, B.J. 1991. Atlas and Identification Key: hair of West-European mammals. Cambridge University Press, Cambridge.
- Tharme, A.P., Green, R.E., Baines, D., Bainbridge, I.P. & O'Brien, M. 2001. The effect of management for red grouse shooting on the population density of breeding birds on heather-dominated moorland. J. Anim. Ecol. 38: 439–457. doi: 10.1046/j.1365-2664.2001.00597.x
- Thirgood, S. & Redpath, S. 2008. Hen harriers and red grouse: science, politics and human–wildlife conflict. J. Appl. Ecol. 45: 1550–1554. doi: 10.1111/j.1365-2664.2008.01519.x
- Thirgood, S.J., Redpath, S.M., Newton, I. & Hudson, P.J. 2000a. Raptors and Grouse: conservation conflicts and management solutions. Conserv. Biol. 14: 95–104. doi: 10.1046/j.1523-1739.2000.99013.x
- Thirgood, S.J., Redpath, S.M., Rothery, P. & Aebischer, N.J. 2000b. Raptor predation and population limitation in red grouse. J. Anim. Ecol. 69: 504–516. doi: 10.1046/j.1365-2656.2000.00413.x
- Thomas, L., Buckland, S.T., Rexstad, E.A., Laake, J.L., Strindberg, S., Hedley, S.L., Bishop, J.R.B., Marques, T.A. & Burnham, K.P. 2010. Distance software: design and analysis of distance sampling surveys for estimating population size. J. Appl. Ecol. 47: 5–14. doi: 10.1111/j.1365-2664.2009.01737.x
- Thompson, D.B.A., MacDonald, A.J., Marsden, J.H. & Galbraith, C.A. 1995. Upland heather moorland in Great Britain: a review of international importance, vegetation change and some objectives for nature conservation. Biol. Conserv. 71: 163–178. doi: 10.1016/0006-3207(94)00043-P
- Thompson, P.S., Amar, A., Hoccom, D.G., Knott, J. & Wilson, J.D. 2009. Resolving the conflict between driven-grouse shooting and conservation of hen harriers. J. Anim. Ecol. 46: 950–954. doi: 10.1111/j.1365-2664.2009.01687.x
- Thompson, D.B.A., Reed, T.M., Stroud, J., Christie, M.F.B. & Stroud, D.A. 2010. The nature of human-wildlife conflicts across Europe – a review. In Baxter, J. & Galbraith, C.A. (eds) Species Management: challenges and solutions for the 21st century, 303–334. The Stationary Office, Edinburgh.
- Thompson, P.S., Douglas, D.J.T., Hoccom, D.G., Knott, J., Roos, S. & Wilson, J.D. 2016. Environmental impacts of high-output driven shooting of red grouse Lagopus lagopus scotica. Ibis 158: 446–452. doi: 10.1111/ibi.12356
- Valkama, J., Korpimäki, E., Arroyo, B.E., Beja, P., Bretagnolle, V., Bro, E., Kenward, R.E., Mañosa, S., Redpath, S.M., Thirgood, S.J. & Viñuela, J. 2005. Birds of prey as limiting factors of gamebird populations in Europe: a review. Biological Reviews 80: 171–203. doi: 10.1017/S146479310400658X
- VSN International. 2014. GenStat for Windows 17th Edition. VSN International, Hemel Hempstead.
- Warren, P. & Baines, D. 2004. Black grouse in northern England: stemming the decline. Br. Birds 97: 183–189.
- Warren, P. & Baines, D. 2011. Evaluation of the distance sampling technique to survey red grouse Lagopus lagopus scoticus on moors in northern England. Wildl. Biol. 17: 135–142. doi: 10.2981/10-085
- Whitfield, D.P. & Fielding, A.H. 2017. Analyses of the fates of satellite tracked golden eagles in Scotland. Scottish Natural Heritage Commissioned Report No. 982.
- Whitfield, D.P., Fielding, A.H., McLeod, D.R.A. & Haworth, P.F. 2004. The effects of persecution on age of breeding and territory occupation in golden eagles in Scotland. Biol. Conserv. 118: 249–259. doi: 10.1016/j.biocon.2003.09.003
- Whitfield, D.P., Fielding, A.H. & Whitehead, S. 2008. Long-term increase in the fecundity of hen harriers in Wales is explained by reduced human interference and warmer weather. Anim. Conserv. 11: 144–152. doi: 10.1111/j.1469-1795.2008.00164.x
- Whitfield, D.P., Reid, R., Haworth, P.F., Madders, M., Marquiss, M., Tingay, R. & Fielding, A.H. 2009. Diet specificity is not associated with increased reproductive performance of Golden Eagles Aquila chrysaetos in Western Scotland. Ibis 151: 255–264. doi: 10.1111/j.1474-919X.2009.00924.x
- Yalden, D.W. 2009. The Analysis of Owl Pellets, 4th edn. The Mammal Society, Southampton.