
ABSTRACT
1. The hypothesis behind the study was that a high dietary starch level (HS) would lead to impaired gut health compared to a low-starch diet (LS) in Eimeria-challenged broilers. The effects of two diets with different starch to fat ratios on intestinal histomorphometry, Clostridium perfringens counts and toxin profile, necrotic enteritis prevalence and abundance of short-chain fatty acids (SCFAs) were examined.
2. A total of 1,920 one-day-old Ross 308 broiler chickens were fed one of two isocaloric diets formulated either with high (32:1) or low (2:1) starch to fat ratios from d 10 to 29 of age. Each treatment group had 12 pen replicates containing 80 broilers each. On d 17, the chickens were challenged with Eimeria vaccine strains. Samples were collected on d 16, 21–23 and 29.
3. Whereas villus length increased gradually throughout the study in the HS group, a peak level was reached on d 21–23 in the LS group. On d 29, the HS group had significantly longer villi than the LS group.
4. Caecal SCFA concentrations were higher in the HS group compared to the LS group on d 16. In both groups, the SCFA level peaked on d 21–23, with the most pronounced increase seen in the LS group.
5. The C. perfringens netB:cpa ratio increased from d 16 to 29 in the HS group. C. perfringens counts and necrotic enteritis prevalence were similar between the two groups.
6. Diet affected the dynamics of small intestinal villus length and caecal SCFA abundance. These findings suggest that structural remodelling of the small intestine is an adaptation to different dietary starch levels, and that caecal SCFA abundance is associated with the availability of substrate for the microbiota in the posterior intestinal segments. Chickens adapted to higher levels of dietary starch might be more robust against Eimeria infections due to increased mucosal surface area. Studies with other dietary starch sources are required to clarify the impact of dietary starch levels on intestinal health in Eimeria–challenged broilers.
Introduction
Energy in broiler diets is mainly provided by carbohydrate and fat sources. Starch is, due to availability and cost-efficiency, often considered the primary source of energy, and is typically provided from cereals which, quantitatively, are the most important components in modern poultry diets (Svihus Citation2014; Zaefarian et al. Citation2015). Hence, the proportion of carbohydrates in the diet is much higher for modern broilers than for their wild ancestors. It has been estimated that insects can comprise more than 50% of the diet in wild jungle fowl chicks (Klasing Citation2005), and fat is, therefore, a more important energy-providing nutrient in an omnivore versus a granivore diet (Barker et al. Citation1998).
Intensive artificial selection through breeding for efficiency and growth have resulted in modern broiler breeds with a larger appetite and increased voluntary feed intake per day (Tallentire et al. Citation2016). The ability of broilers to digest nutrients does not necessarily always match their feed intake, and excessive undigested nutrients may reach the lower intestines (Svihus Citation2011). Substrate preferences differ between microorganisms, and the intestinal microbiota composition is largely determined by nutrient availability and chemical composition of the digesta (Apajalahti et al. Citation2004). As an example, the bacterium Clostridium perfringens (associated with necrotic enteritis in broilers) produces enzymes necessary to break down and utilise starch and sugar (Groves and Grounlund Citation1969; Shih and Labbe Citation1996), and the risk of necrotic enteritis has been linked to specific dietary carbohydrate sources (Annett et al. Citation2002; Kaldhusdal and Hofshagen Citation1992; Kaldhusdal and Skjerve Citation1996; Riddell and Kong Citation1992). Dietary fat sources may influence the growth of C. perfringens, and it has been shown that animal fat can increase C. perfringens counts compared to vegetable oil (Knarreborg et al. Citation2002). Consequently, it is possible to influence the growth of potentially pathogenic bacteria through dietary manipulation.
Furthermore, it is well established that coccidiosis caused by Eimeria spp. impairs intestinal health in its own right, and is an important predisposing factor for intestinal C. perfringens proliferation and the development of necrotic enteritis in broilers (Hermans and Morgan Citation2007). Eimeria spp. infections are common in commercial flocks, and display a dynamic pattern characterised by low infection levels in the youngest chicks and a peak infection level at an age interval that varies with Eimeria spp., farming system and health management. Short-chain fatty acids (SCFAs) are produced in the posterior intestine mainly from microbial fermentation of carbohydrates which escape absorption in the small intestine (Morrison and Preston Citation2016). There are numerous effects associated with SCFAs, and some of them are involved in host energy metabolism, energy supply, intestinal function and epithelial cell morphology (den Besten et al. Citation2013; Scheppach Citation1994). The amount and type of fermentable substrates reaching the lower intestinal segments affects the composition of the intestinal microbiota and, hence, the SCFA concentration and profile (Cummings and Macfarlane Citation1991). Undigested dietary carbohydrates primarily lead to the formation of volatile fatty acids; acetate, propionate and butyrate (Wong et al. Citation2006). A specific diet that leads to increased production of SCFAs lowers the pH in the intestine, which could create a favourable environment for some microbes and disadvantageous conditions for others (den Besten et al. Citation2013).
The ability to digest and absorb carbohydrates is believed to be highly adaptable in poultry (Murugesan et al. Citation2014; Suvarna et al. Citation2005), and the digestive capacity of the intestine can be increased through the expansion of surface area which occurs with lengthening of villi (Moran Citation1985). The turnover rate of small intestinal epithelium in chickens allows for rapid adjustments of crypts and villi, ensuring that chickens can adapt quickly to altered nutrient availability (Imondi and Bird Citation1966).
The following study was based on the hypothesis that a HS diet would result in excessive amounts of undigested starch reaching the distal part of ileum and caecum, which could affect the count and toxin gene profile of C. perfringens and the prevalence of necrotic enteritis. Based on the considerations above, it was expected that the different macronutrient contents in the HS and the LS diet would influence small intestinal histomorphometry and production of SCFAs. The objective of this study was to investigate the effects of two diets with different starch to fat ratios on intestinal histomorphometry, C. perfringens counts and toxin profile, occurrence of necrotic enteritis and abundance of short-chain fatty acids (SCFAs) in Eimeria-challenged broiler chickens. Effects on nutrient digestibility and production performance have been discussed in an accompanying paper (Itani et al. Citationin press).
Materials and methods
Animals and housing
The experiment was approved by the national animal research authority (Norwegian Food Safety Authority, approval ID 8824), and performed in accordance with national and international guidelines for the care and use of experimental animals. The housing, management and environment are described in detail in an accompanying paper (Itani et al. Citationin press). Briefly, 1,920, one-day-old Ross 308 broiler chickens were obtained from a commercial hatchery (Nortura Samvirkekylling, Våler, Hedmark, Norway) and housed in floor pens on new wood shavings in a climate-controlled poultry research facility (Scandinavian Poultry Research, Våler, Hedmark, Norway). Water and feed were provided ad libitum.
Diets & experimental design
From d 0 to d 9, all chickens were fed a common commercial starter diet containing 366 g/kg starch (mostly derived from wheat) and 61 g/kg fat (mostly derived from soybean oil and animal fats), providing a starch to fat ratio of 6:1. On d 10, the chickens were randomly divided into two treatment groups, both comprising 12 pens with 80 chickens each with a balanced male to female distribution per pen. During the experimental period from day 10 to day 29, chickens in the two treatment groups were fed either a high starch to fat ratio (HS; ratio of 32:1) or a low starch to fat ratio (LS; ratio of 2:1) diet. The diets were formulated to be isocaloric by replacing wheat starch in the HS diet by rapeseed oil and silica sand in the LS diet. Both diets were pelleted and formulated to meet or exceed the Ross 308 nutrition specifications (Aviagen Citation2014). All diets were free from in-feed antimicrobials, including antibacterial growth promoters and anticoccidials. More details on diet composition and feed processing are described in the accompanying paper (Itani et al. Citationin press).
On d 17, chickens in both treatment groups were challenged orally with a 10-fold dose of the vaccine Paracox-5 vet. (MSD Animal Health, Boxmeer, the Netherlands) containing live, sporulated oocysts from five attenuated strains of Eimeria spp. (one precocious line each of Eimeria acervulina [approximately 5750 oocysts per broiler], Eimeria mitis [approximately 11,500 oocysts], and Eimeria tenella [approximately 5750 oocysts], and two precocious lines of Eimeria maxima [approximately 3450 oocysts]) administered through the drinking water. On d 16, 21–23 and 29, 12 chickens per treatment group (one chicken from each replicate pen) were randomly selected and euthanised by a cranial blow immediately followed by cervical dislocation before necropsy and sample collection.
Morphometric analysis
Unopened intestinal segments of approximately 1 cm taken from the transition between duodenum and jejunum at the end of the duodenal loop were collected during necropsy on d 16, 21–23 and 29. The samples were fixed in 10% neutral-buffered formalin solution. Formalin-fixed intestinal tissue samples were embedded in paraffin and sectioned at 5 µm. Standard protocols for haematoxylin and eosin staining of histological paraffin sections were followed. Villus length and crypt depth were measured using a microscope (Nikon Eclipse 80i, Nikon Instruments Europe B.V., Amsterdam, the Netherlands) fitted with a digital camera (Nikon DS-Ri1, Nikon Instruments Europe B.V.) using the image software NIS-Elements D v4.40 (Nikon Instruments Europe B.V.). Villus length was measured from the tip of the villus to the crypt-villus junction. Crypt depth was measured from the base to the crypt-villus junction. The mean of ~10 measured villi and crypts per chicken was calculated. Only clearly defined and fully finger-shaped villi were included and histological sections of suboptimal quality not suitable for morphometric analysis were excluded. Mean villus length, crypt depth and villus:crypt ratio in each treatment group were calculated.
Clostridium perfringens quantification and toxin gene analysis
On d 21, 22 and 23 (d 4, 5 and 6 after Eimeria challenge, respectively) caecal samples (1.0–2.0 g) were collected in sterile stomacher bags and immediately subjected to cultivation in order to quantify C. perfringens. Briefly, caecal samples were diluted 1:100 in peptone saline water (0.1% peptone, Difco Laboratories Inc., Detroit, MI, USA, and 0.85% NaCl) and homogenised for 30 seconds (Bagmixer 400 CC, Interscience, Saint Nom, France). Serial dilutions were made with non-buffered peptone water until a dilution of 10−6 was reached. Aliquots of 100 µl from the dilutions 10−2, 10−4 and 10−6 were plated onto sheep blood agar plates and incubated anaerobically at 37°C for 24 hours (Genbox anaer, Biomérieux, Marcy-l’Étoile, France). Single colonies with double haemolysis were counted, and colony-forming units per gram (cfu/g) of caecal content was calculated. Typical colonies were selected for pure cultivation and confirmed as C. perfringens by a matrix-assisted laser desorption ionisation time-of-flight (MALDI-TOF) mass spectrometer (Bruker Daltonics, Bruker Corp., Billerica, MA, USA).
Caecal contents were collected in 1.5 ml Eppendorf tubes and immediately put on dry ice during necropsy on d 16, 21–23 and 29. Samples were stored at −80°C until further processing. DNA was extracted from 200 mg of caecal content using a QIAamp DNA Stool Mini Kit (Qiagen, Hilden, Germany) according to the manufacturer’s instructions with some modifications. After adding 1.4 ml of ASL lysis buffer, the samples were homogenised on a vortexer, followed by heat treatment at 70°C for 5 min. The total suspension from each sample was transferred into Precellys 2.0 ml homogenisation tubes pre-filled with 0.1 mm ceramic beads (Bertin Technologies, Montigny-le-Bretonneux, France). Mechanical lysis was done with a Precellys 24 homogeniser (Bertin Technologies) for 2 × 30 seconds at 6800 rpm. Samples were centrifuged for 1 min at 14.000 rpm in order to pellet both the beads and large particles. The supernatant was transferred into new 2 ml tubes and heated at 70°C for 5 min. One InhibitEX tablet was added to each sample, and, for the rest of the procedure, the protocol provided by the manufacturer was followed. DNA yields were measured with the Qubit double-stranded DNA Broad-Range Assay Kit on a Qubit 2.0 fluorometer (Thermo Fisher Scientific, Waltham, MA, USA) following the manufacturer’s instructions. The purity of the DNA extracts was determined by measuring the ratios of absorbance at 260/280 and 260/230 using a NanoDrop 2000 spectrophotometer (Thermo Fisher Scientific). DNA was stored at −20°C until use.
The relative abundances of the C. perfringens pathogenicity-associated necrotic enteritis toxin B-like gene (netB) and the omnipresent alpha toxin gene (cpa) were analysed using a multiplex real-time qPCR in order to determine the ratio of presumptively pathogenic to total C. perfringens (netB:cpa ratio) in intestinal samples. The qPCR assay used primers and probes as described previously (Albini et al. Citation2008; Schlegel et al. Citation2012) with some modifications (). C. perfringens strain 56 (CP56) was used as positive control, and nuclease-free water was used as negative control. The CP56 was originally isolated from the gut of a broiler chicken with severe necrotic enteritis lesions, and the strain has previously been classified as a netB toxin positive strain (Gholamiandekhordi et al. Citation2006). The cpa gene served as an internal positive control for each PCR reaction due to its presence on the chromosome of all C. perfringens isolates (Songer Citation1996). Each reaction was performed in duplicate in a 25 µl total reaction mixture containing 12.5 µl Brilliant III Ultra-Fast qPCR Master Mix (Agilent Technologies, Santa Clara, California, US), 20 µM of primers and probes, and 3 µl of the DNA sample. A Bio-Rad CFX-96 real-time PCR instrument (Bio-Rad Laboratories Inc., Hercules, California, US) was used. The qPCR conditions were 1 cycle at 50°C for 10 min and 1 cycle at 95°C for 5 min, followed by 48 cycles at 95°C for 30 s and 60°C for 1 min. Data analysis was performed using Bio-Rad CFX Manager 3.1 (Bio-Rad Laboratories Inc.) and Microsoft Office Excel 2016 (Microsoft, Redmond, Washington, US). The standard curve was based on data from serial 10-fold dilutions (10°–10−4) of DNA from CP56. Amplification efficiency for both PCRs were calculated from these titrations to confirm that it was within the range of 90–110%. The slope and shape of amplification curves were inspected and quantification cycle (Cq) thresholds above 40 were excluded from the analysis. The threshold lines were set at the same level for both PCRs, at a point above the background fluorescence and in the beginning of the exponential phase. The amplification signals from the target genes in the undiluted positive control CP56 overlapped at this point, indicating that the ratio of netB to cpa, based on Cq values for this positive control, was 1:1. The percentage of netB-positive samples was calculated based on the presence or absence of the netB gene signal. The relative abundances of the cpa and the netB genes were determined from the standard curve, and the netB:cpa ratios in caecal samples were calculated by dividing the relative netB abundance by the relative cpa abundance.
Table 1. Primers and probes used for qPCR analysis
Short chain fatty acids
Caecal samples were collected in Eppendorf tubes and immediately put on dry ice during necropsy on d 16, 21–23 and 29. Samples were stored at −80°C until further analysis. The SCFA concentrations in the caecal samples were determined according to a previously described method (De Weirdt et al. Citation2010). In short, SCFAs were extracted using diethyl ether, and 2-methylhexanoic acid (99%) was added to each sample as internal standard. The extracts were analysed using a GC-2014 gas chromatograph (Shimadzu, BB ‘s-Hertogenbosch, the Netherlands), equipped with a capillary fatty-acid free EC-1000 EconoCap column (Alltech, Laarne, Belgium).
Necrotic enteritis
The small intestine of 12 chickens (one per replicate pen) per treatment were opened longitudinally and inspected for pathological changes indicating necrotic enteritis on d 16, 21, 22, 23 and 29. A modified necrotic enteritis scoring system was used (Lovland et al. Citation2004). If no macroscopic mucosal ulcers, depressions or pseudomembranes were present, the chickens were classified as ‘necrotic enteritis negative’. Identification of minimum one mucosal ulcer, depression or pseudomembrane resulted in classification as a ‘necrotic enteritis positive’ chicken.
Gizzard scores
Gizzards from 12 chickens per treatment (one per pen replicate) on d 16, 21, 22, 23 and 29 were opened, emptied and carefully washed in order to inspect the gizzard linings. A score for each gizzard was given on the basis of score 0 for no visible erosions (negative), 1 for definite erosions with restricted or focal distribution (mild), 2 for multiple erosions with widespread distribution but more than 50% normal mucosa remaining (moderate) and 3 for erosions covering more than 50% of the gizzard surface area (severe).
Statistical analysis
Samples were collected from one chicken from each replicate pen (12 chickens per treatment group) on each sampling occasion. Initially, data from all variables were checked for normality and homogeneity of variance using Shapiro-Wilk test and Variance-comparison test, respectively. If the criteria for using parametric testing were fulfilled (normal distribution and homogeneity of variance), an independent two-sample t-test was used. If the assumptions of normality and/or homogeneity of variance were violated, the non-parametric Mann-Whitney U test (Wilcoxon rank-sum test) was used. For categorical data, Fisher’s exact test was used. Choice of statistical tests for each outcome variable are given in the results sections and/or in tables and figures. Differences between means were considered significant at P < 0.05. Statistical analyses were performed using Stata version 14.2 (StataCorp LLC, College Station, TX, USA) and graphics were made using R version 3.5.3 (R Foundation for Statistical Computing, Vienna, Austria).
Results
Morphometric analysis
There was no significant difference in mean villus length, crypt depth or villus:crypt ratio in the duodenojejunal junction between the two groups on d 16 and 21–23 (, t-test). On d 29, chickens fed the HS diet had longer villi compared to chickens fed the LS diet (P < 0.001). There was no difference in mean crypt depth on d 29. As a result of the difference in villus length, the mean villus:crypt ratio on d 29 was higher in chickens fed the HS diet compared to chickens fed the LS diet (P = 0.037).
Table 2. Effect of dietary starch to fat ratios on intestinal histomorphometry on days 16, 21–23 and 29.1.
The length of villi in the HS group increased gradually from d 16 to day 29 (). This increase was most pronounced between d 16 and d 21–23 (25% increase, P = 0.001, t-test). In the LS group, villus length increased strongly from d 16 to d 21–23 (39% increase, P < 0.001, t-test), but decreased in the period from d 21–23 to 29 (13% decrease, P = 0.045, t-test).
Clostridium perfringens quantification and toxin gene analysis
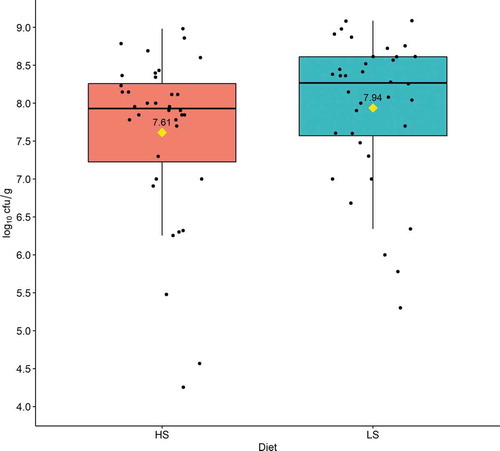
There was no significant difference in caecal C. perfringens counts (cfu/g) between the two treatment groups between d 21–23 (P = 0.098, Mann-WhitneyU test) ().
Figure 1. Effect of dietary starch to fat ratios on caecal Clostridium perfringens counts (log10 cfu/g) during days 21–23. Boxplots with medians indicated by horizontal lines and means indicated by diamonds. Based on samples from 36 chickens per diet. HS: high starch to fat ratio diet; LS: low starch to fat ratio diet. cfu/g = colony forming units per gram
The qPCR analysis revealed that all caecal samples from both treatment groups were cpa-positive. The frequency of samples with presence of the netB gene was calculated (). From d 16 to d 29, the overall percentage of netB-positive caecal samples in both treatment groups increased from 79% to 100% (P = 0.05, Fisher’s exact test). There was no statistically significant effect of diet on netB prevalence at any time point or in the overall experimental period.
Table 3. The percentage of netB-positive and netB-negative caecal samples.1.
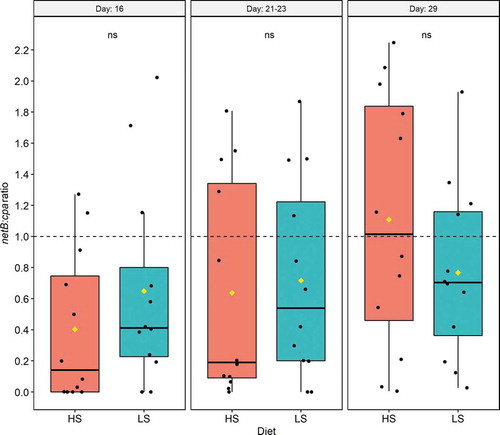
The netB:cpa ratio was similar () in the two treatment groups on d 16 (P = 0.354), d 21–23 (P = 0.624) and d 29 (P = 0.299). In the HS group, the netB:cpa ratio increased from d 16 to 29 (P = 0.018, Mann-Whitney U test), indicating that the relative abundance of netB genes present in caecal samples from chickens fed the HS diet increased to a greater extent than the relative abundance of cpa genes in this period. The HS group on d 29 was the only subgroup with mean and median netB:cpa ratio above 1.0, indicating that the relative abundance of netB was higher than the relative abundance of cpa in this group at this time point.
Figure 2. Effect of dietary starch to fat ratios on the Clostridium perfringens netB:cpa ratio in caecal samples on days 16, 21–23 and 29
Short chain fatty acids
On d 16, caecal samples from chickens fed the HS diet had higher levels of acetic acid (P = 0.016) and propionic acid (P = 0.006) compared to caecal samples from chickens fed the LS diet (). This resulted in higher total SCFA concentration (P = 0.016) in the caecum from chickens fed HS diet at this time point.
Table 4. Effect of dietary starch to fat ratios on short chain fatty acids (SCFAs; µmol/g) in caecum.1.
The dynamic development of total caecal SCFA concentration was similar in the two diet groups, with a maximum level reached on d 21–23. The increase from d 16 to d 21–23 was significant in the LS group (P < 0.001, t-test).
Necrotic enteritis
The overall prevalence of necrotic enteritis on d 16 was 8.3% (2/24 chickens). In the period following Eimeria challenge (d 21–23) the prevalence was 16.7% (6/36 chickens) in the HS group and 13.9% (5/36 chickens) in the LS group. This difference in necrotic enteritis prevalence was non-significant (P > 0.05, Fisher’s exact test). On d 29, no mucosal ulcers, depressions or pseudomembranes indicating necrotic enteritis were detected in the small intestine of any of the chickens examined.
Gizzard scores
On d 16, the mean gizzard score was 2.0 and 1.75 in the HS and LS group, respectively (P = 0.508, t-test). During the days following Eimeria challenge (d 21, 22 and 23), the overall median gizzard score was 3 in both treatment groups (P = 0.489, Mann-Whitney U test). At the end of the experiment on d 29, the mean gizzard score was 2.7 in chickens fed the HS diet and 2.8 in chickens fed the LS diet (P = 0.368, t-test). There was no effect of diet on gizzard scores in the experiment.
Discussion
The use of intestinal C. perfringens counts as an indicator of gastrointestinal health in this study is based on this bacterium’s association with gizzard erosions (Novoa-Garrido et al. Citation2006), necrotic enteritis (Kaldhusdal and Hofshagen Citation1992) and growth depression (Stutz and Lawton Citation1984) in broiler chickens. C. perfringens produces amylases and has the capacity to break down and utilise starch (Shih and Labbe Citation1996). Any undigested starch reaching lower gut regions could thus encourage overgrowth of this opportunistic pathogen. In spite of the higher starch content in the HS diet, this diet did not lead to higher caecal C. perfringens counts than the LS diet at d 21–23. As shown in the accompanying paper, the concentration of starch in ileal digesta tended to be higher on d 16 (28% more starch, P = 0.067), and was clearly higher on d 29 (31% more starch, P = 0.015) in the HS group compared to the LS group (Itani et al. Citationin press). These findings indicated that more undigested starch reached the lower intestinal regions in chickens fed the HS diet, but the difference in ileal substrate availability at these time points did not affect caecal C. perfringens counts significantly during the most critical time interval after Eimeria spp., challenge (d 21–23). This result was in agreement with the lack of difference in overall gizzard scores and necrotic enteritis frequency between chickens fed the two diets. Neither of the treatment groups in this study had very high levels of starch in the ileum on the day before Eimeria spp. challenge (80 and 58 g/kg in the HS and LS group, respectively) unlike chickens in another study (222 g/kg) which had poor starch digestibility (Svihus and Hetland Citation2001). The relatively low levels of starch, and limited substrate availability in the posterior gut regions, could explain the lack of difference in important gut health variables between the treatment groups in this study. The presence of other microbes outcompeting C. perfringens in their use of starch as fermentation substrate is an additional or alternative possible explanation for the lack of impact of diet on caecal C. perfringens counts and necrotic enteritis prevalence.
In chickens, C. perfringens type G (previously designated type A) has been reported as the predominant toxinotype causing necrotic enteritis (Rood et al. Citation2018, Van Immerseel et al. Citation2004). The alpha-toxin-encoding gene cpa is present on the chromosome of all types of C. perfringens strains (Petit et al. Citation1999), and was used as an indicator of total C. perfringens abundance in caecal samples in a quantitative PCR (qPCR) assay in this study. Another toxin, the pore-forming plasmid-encoded toxin designated NetB, is believed to be a key virulence factor associated with necrotic enteritis in chickens (Keyburn et al. Citation2008). The current trial showed a relatively high percentage of netB-positive caecal samples on d 16 prior to Eimeria spp. challenge in (). In a previous study, netB-positive C. perfringens strains were present in a commercial broiler house prior to placement of one-day-old broilers (Engstrom et al. Citation2012). From this background, it seems reasonable to suggest that netB-positive C. perfringens strains could have been present in the environment from placement of the one-day-old broilers in the current study. The frequency of netB-positive caecal samples increased from 16 to 29 d of age. Although no necrotic enteritis was detected on d 29, all caecal samples were netB-positive at this age. A possible explanation was that netB-positive strains were transmitted from broilers with subclinical necrotic enteritis to healthy birds, and eventually colonised the intestine of all broilers independent of health status. The interpretation of the presence of the netB gene with regard to pathogenicity of C. perfringens can be complex, and previous studies showed that netB-positive C. perfringens strains alone are apparently not enough to cause disease without predisposing factors being present (Keyburn et al. Citation2010; Yang et al. Citation2019).
The significant increase in netB:cpa ratio from d 16 to day 29 in the HS group implied that the relative abundance of netB increased to a greater extent than the relative abundance of cpa in this period. Since a significant increase in netB:cpa ratio was not present in the LS group, it was possible that diet and starch level played a role in this development. As mentioned before, C. perfringens can utilise starch, which was available in larger amounts in ileal contents in the HS group compared to the LS group (Itani et al. Citationin press). Thus, starch may have predisposed birds towards intestinal colonisation by netB-positive C. perfringens in this study. The netB:cpa ratio has been suggested as a faecal marker to monitor subclinical necrotic enteritis in broilers (Goossens et al. Citation2019). The current study was not designed to compare netB:cpa ratios in groups with and without necrotic enteritis, but the results demonstrated that the netB:cpa ratio was not directly associated with prevalence of necrotic enteritis at the time of sampling. It is, however, possible that this ratio can be useful as an indicator of previous necrotic enteritis occurrence in the examined flock. More work is required to determine the use of this marker.
In addition to age-related lengthening of intestinal villi in broilers (Alshamy et al. Citation2018), villus length and development are influenced by feed composition and nutrient availability (Moran Citation1985). Elongation of villi increases the absorptive surface of the intestine and augments the amount of brush border enzymes available to break down oligosaccharides originating from the activity of amylase on dietary starch in the anterior small intestine. Hence, increased villus length and consequently expansion of the mucosal surface area is considered an important mechanism in adaptation to higher starch levels in the diet (Moran Citation1985). The difference in villus length between the HS and LS group on d 29 supported this view.
The development of villus length was similar in chickens fed the LS and HS diets during the time interval between d 16 and d 21–23. This similarity might have been associated with the Eimeria spp. challenge on d 17, considering that lengthening of villi as a compensatory mechanism following Eimeria acervulina infection has been described previously (Fernando and Mccraw Citation1973). However, the two diet groups showed clearly distinct developments in villus length from d 21–23 to d 29. The decrease in villus length in the LS group was in contrast to the continued increase of villus length in the HS group. Both groups were challenged with Eimeria spp. and samples were taken at the same age. The difference in villus length development between d 21–23 and d 29 was thus most likely related to the impact of nutrients and diet. Digestion of fat and fatty acids is believed to occur mainly in the jejunum and the upper ileum (Tancharoenrat et al. Citation2014), while the greatest part of starch digestion occurs in the duodenum and jejunum (Osman Citation1982; Riesenfeld et al. Citation1980). Intestinal adaptation to increased levels of fat in the diet, such as raised expression of fatty acid binding proteins in epithelial cells (Krogdahl Citation1985), is thus likely to primarily take place in more posterior regions of the small intestine than adaption to increased starch levels. The results from this study suggested that a diet containing a higher level of starch stimulates villus elongation in the duodenojejunal junction to a larger extent than a diet containing less starch and more vegetable fat.
The higher total caecal SCFA concentration in chickens fed the HS diet compared to chickens fed the LS diet on d 16 implied a larger number of SCFA-producing bacteria in the intestines of this group (den Besten et al. Citation2013). The dynamic development of total caecal SCFA concentration showed a similar trend in both the HS and the LS group, with an initial increase and a maximum level reached during d 21–23, followed by a moderate and non-significant decrease towards the end of the experiment (). The increase in total SCFA concentration from d 16 to d 21–23 was, on average, 18% in the HS group and 58% in the LS group, which suggested a more considerable increase in activity of SCFA-producing bacteria in the LS group. A possible explanation for this may be that the infection process following exposure of both groups to the same dose of Eimeria spp. on d 17 affected a smaller area of available digestive surface in the HS group than in the LS group, since the HS group (from d 10) adjusted to the higher level of dietary starch by the relative increase of intestinal surface area and villus length in the anterior small intestine (Moran Citation1985). A reduction in starch digestibility associated with Eimeria spp. challenge (Amerah and Ravindran Citation2015) could have affected the HS group to a lesser extent compared to the LS group, due to the larger remaining functional intestinal surface area. Consequently, more starch potentially reached posterior gut regions in the LS group in this period (data not shown), resulting in larger amounts of substrates accessible for SCFA-producing bacteria and a more pronounced increase in total SCFA concentration. This reasoning was supported by the fact that starch digestibility was improved from d 16 to 29 in the HS group but not in the LS group (data presented in the accompanying paper Itani et al. Citationin press).
There was no clear-cut difference in necrotic enteritis prevalence, caecal C. perfringens counts or gizzard scores between chickens fed the two diets in this study. The hypothesis that a HS diet would lead to unfavourable effects on intestinal health in broiler chickens compared to a LS diet was not confirmed in this study. As discussed in the accompanying paper, feed processing and the physical form of starch sources were potentially confounding factors (Itani et al. Citationin press). The unintentionally higher extent of starch gelatinisation and the use of isolated wheat starch in the HS diet could have contributed to the relatively small difference in ileal starch level between the two groups, in spite of the marked difference in dietary starch content (45% in HS and 23% in LS). Taking this into account, the current data cannot be used to reject the hypothesis that high levels of dietary starch may impair intestinal health in broiler chickens.
In conclusion, there was an impact of diet on the length of anterior small intestinal villi and abundance of SCFAs in the caecum. A possible explanation for the difference in villus morphology was that the two groups had to adapt to distinct dietary macro-nutrient ratios, which required different ways of extracting energy from the feed. Due to ongoing adaptation to higher levels of dietary starch through villus elongation and increased mucosal surface (Moran Citation1985), chickens fed the HS diet were conceivably less vulnerable to the loss of absorptive capacity caused by the Eimeria spp. challenge. Chickens fed the LS diet had to rapidly adjust to loss of absorptive function in a larger proportion of the duodenal-jejunal mucosal surface in the period following challenge, and apparently accelerated the lengthening of villi in order to maintain nutrient absorption capacity. This structural remodelling of the intestine was energy-demanding, and this cost was reflected in reduced weight gain during d 15 to 24 and poorer accumulated feed conversion in the LS group (Itani et al. Citationin press). The reduction in absorptive capacity of chickens fed the LS diet was underpinned by the more pronounced increase in total caecal SCFA concentration from d 16 to d 21–23 in this group, which strongly suggested that more undigested starch reached lower gut regions and were available for bacterial fermentation in this period. Collectively, these results suggested that chickens which were adapted to a diet with a higher level of starch were better prepared to cope with intestinal damage caused by a mild to moderate Eimeria spp. challenge affecting the anterior small intestine, compared to chickens fed a diet with a lower level of starch. This hypothesis was supported by the fact that the LS group had clearly poorer production performance during d 15–24 (Itani et al. Citationin press), an age interval that included peak oocyst excretion following Eimeria spp challenge. However, because the study was not designed to investigate the relationship between dietary starch level and Eimeria infections, this hypothesis needs to be tested experimentally.
Acknowledgments
The authors thank Tone M. Fagereng, Øyvor Kolbjørnsen, Siri K. Sjurseth and Torfinn Moldal at the Norwegian Veterinary Institute and Evy Goossens at Ghent University for their skilled assistance in the conduct of this study.
Disclosure statement
The authors declare no conflict of interest.
Additional information
Funding
References
- Albini, S., I. Brodard, A. Jaussi, N. Wollschlaeger, J. Frey, R. Miserez, and C. Abril. 2008. “Real-time Multiplex PCR Assays for Reliable Detection of Clostridium Perfringens Toxin Genes in Animal Isolates.” Veterinary Microbiology 127 (1–2): 179–185. doi:10.1016/j.vetmic.2007.07.024.
- Alshamy, Z., K. C. Richardson, H. Hunigen, H. M. Hafez, J. Plendl, and S. A. L. Masri. 2018. “Comparison of the Gastrointestinal Tract of A Dual-purpose to A Broiler Chicken Line: A Qualitative and Quantitative Macroscopic and Microscopic Study.” PLoS One 13 (10): e0204921. doi:10.1371/journal.pone.0204921.
- Amerah, A. M., and V. Ravindran. 2015. “Effect of Coccidia Challenge and Natural Betaine Supplementation on Performance, Nutrient Utilization, and Intestinal Lesion Scores of Broiler Chickens Fed Suboptimal Level of Dietary Methionine.” Poultry Science 94 (4): 673–680. doi:10.3382/ps/pev022.
- Annett, C. B., J. R. Viste, M. Chirino-Trejo, H. L. Classen, D. M. Middleton, and E. Simko. 2002. “Necrotic Enteritis: Effect of Barley, Wheat and Corn Diets on Proliferation of Clostridium Perfringens Type A.” Avian Pathology 31 (6): 598–601. doi:10.1080/0307945021000024544.
- Apajalahti, J., A. Kettunen, and H. Graham. 2004. “Characteristics of the Gastrointestinal Microbial Communities, with Special Reference to the Chicken.” Worlds Poultry Science Journal 60 (2): 223–232. doi:10.1079/Wps200415.
- Aviagen. 2014. “308 Nutrition Specifications.”.Aviagen, Scotland, UK. Accessed 10 February 2017. http://tmea.staging.aviagen.com/assets/Tech_Center/Ross_Broiler/Ross-308-Broiler-Nutrition-Specs-2014r17-EN.pdf
- Barker, D., M. P. Fitzpatrick, and E. S. Dierenfeld. 1998. “Nutrient Composition of Selected Whole Invertebrates.” Zoo Biology 17 (2): 123–134. doi:10.1002/(Sici)1098-2361(1998)17:2<123::Aid-Zoo7>3.0.Co;2-B.
- Besten, D., G. K. Van Eunen, A. K. Groen, K. Venema, D. J. Reijngoud, and B. M. Bakker. 2013. “The Role of Short-chain Fatty Acids in the Interplay between Diet, Gut Microbiota, and Host Energy Metabolism.” Journal of Lipid Research 54 (9): 2325–2340. doi:10.1194/jlr.R036012.
- CUMMINGS, J. H., and G. T. MACFARLANE. 1991. “The Control and Consequences of Bacterial Fermentation in the Human Colon.” Journal of Applied Bacteriology 70 (6): 443–459. doi:10.1111/j.1365-2672.1991.tb02739.x.
- Engstrom, B. E., A. Johansson, A. Aspan, and M. Kaldhusdal. 2012. “Genetic Relatedness and netB Prevalence among Environmental Clostridium Perfringens Strains Associated with a Broiler Flock Affected by Mild Necrotic Enteritis.” Veterinary Microbiology 159 (1–2): 260–264. doi:10.1016/j.vetmic.2012.03.024.
- Fernando, M. A., and B. M. Mccraw. 1973. “Mucosal Morphology and Cellular Renewal in the Intestine of Chickens following a Single Infection of Eimeria Acervulina.” Journal of Parasitology 59 (3): 493–501. doi:10.2307/3278782.
- Gholamiandekhordi, A. R., R. Ducatelle, M. Heyndrickx, F. Haesebrouck, and F. V. A. N. Immerseel. 2006. “Molecular and Phenotypical Characterization of Clostridium Perfringens Isolates from Poultry Flocks with Different Disease Status.” Veterinary Microbiology 113 (1–2): 143–152. doi:10.1016/j.vetmic.2005.10.023.
- Goossens, E., G. Debyser, C. Callens, B. Devreese, F. Haesebrouck, M. Flügel, S. Pelzer, F. Thiemann, R. Ducatelle, and F. V. A. N. Immerseel. 2019. “Identification of Faecal Diagnostic Markers for Intestinal Barrier Failure and Subclinical Necrotic Enteritis.” 6th International conference on Poultry Intestinal Health p. 59. Auditorium Del Massimo, Via Massimiliano Massimo, 1 – 00144 Roma, Italy.
- Groves, D. J., and A. F. Grounlund. 1969. “Glucose Degradation in Clostridium Perfringens Type A.” Journal of Bacteriology 100 (3): 1420–1423. doi:10.1128/JB.100.3.1420-1423.1969.
- Hermans, P. G., and K. L. Morgan. 2007. “Prevalence and Associated Risk Factors of Necrotic Enteritis on Broiler Farms in the United Kingdom; a Cross-sectional Survey.” Avian Pathology 36 (1): 43–51. doi:10.1080/03079450601109991.
- Immerseel, V., F., . J. DE Buck, F. Pasmans, G. Huyghebaert, F. Haesebrouck, and R. Ducatelle. 2004. “Clostridium Perfringens in Poultry: An Emerging Threat for Animal and Public Health.” Avian Pathology 33 (6): 537–549. doi:10.1080/03079450400013162.
- Imondi, A. R., and F. H. Bird. 1966. “The Turnover of Intestinal Epithelium in the Chick.” Poultry Science 45 (1): 142–147. doi:10.3382/ps.0450142.
- ITANI, K., S. Granstad, M. KALDHUSDAL, L. T. Mydland, and B. Svihus. IN PRESS. “Varying Starch to Fat Ratios in Pelleted Diets: I. Effects on Nutrient Digestibility and Production Performance in Eimeria–challenged Broiler Chickens.” British Poultry Science. doi:10.1080/00071668.2020.1782349
- KALDHUSDAL, M., and M. HOFSHAGEN. 1992. “Barley Inclusion and Avoparcin Supplementation in Broiler Diets. 2. Clinical, Pathological, and Bacteriological Findings in a Mild Form of Necrotic Enteritis.” Poultry Science 71 (7): 1145–1153. doi:10.3382/ps.0711145.
- KALDHUSDAL, M., and E. SKJERVE. 1996. “Association between Cereal Contents in the Diet and Incidence of Necrotic Enteritis in Broiler Chickens in Norway.” Preventive Veterinary Medicine 28 (1): 1–16. doi:10.1016/0167-5877(96)01021-5.
- Keyburn, A. L., T. L. Bannam, R. J. Moore, and J. I. Rood. 2010. “NetB, a Pore-forming Toxin from Necrotic Enteritis Strains of Clostridium Perfringens.” Toxins (Basel) 2 (7): 1913–1927. doi:10.3390/toxins2071913.
- Keyburn, A. L., J. D. Boyce, P. VAZ, T. L. Bannam, M. E. Ford, D. Parker, A. Di Rubbo, J. I. Rood, and R. J. Moore. 2008. “NetB, a New Toxin that Is Associated with Avian Necrotic Enteritis Caused by Clostridium Perfringens.” PLoS Pathogens 4 (2): e26. doi:10.1371/journal.ppat.0040026.
- Klasing, K. C. 2005. “Poultry Nutrition: A Comparative Approach.” Journal of Applied Poultry Research 14 (2): 426–436. doi:10.1093/japr/14.2.426.
- Knarreborg, A., M. A. Simon, R. M. Engberg, B. B. Jensen, and G. W. Tannock. 2002. “Effects of Dietary Fat Source and Subtherapeutic Levels of Antibiotic on the Bacterial Community in the Ileum of Broiler Chickens at Various Ages.” Applied and Environmental Microbiology 68 (12): 5918–5924. doi:10.1128/aem.68.12.5918-5924.2002.
- Krogdahl, A. 1985. “Digestion and Absorption of Lipids in Poultry.” Journal of Nutrition 115 (5): 675–685. doi:10.1093/jn/115.5.675.
- Lovland, A., M. Kaldhusdal, K. REDHEAD, E. Skjerve, and A. LILLEHAUG. 2004. “Maternal Vaccination against Subclinical Necrotic Enteritis in Broilers.” Avian Pathology 33 (1): 83–92. doi:10.1080/0379450310001636255.
- Moran, E. T. 1985. “Digestion and Absorption of Carbohydrates in Fowl and Events through Perinatal Development.” Journal of Nutrition 115 (5): 665–674. doi:10.1093/jn/115.5.665.
- Morrison, D. J., and T. Preston. 2016. “Formation of Short Chain Fatty Acids by the Gut Microbiota and Their Impact on Human Metabolism.” Gut Microbes 7 (3): 189–200. doi:10.1080/19490976.2015.1134082.
- Murugesan, G. R., L. F. Romero, and M. E. Persia. 2014. “Effects of Protease, Phytase and a Bacillus Sp. Direct-fed Microbial on Nutrient and Energy Digestibility, Ileal Brush Border Digestive Enzyme Activity and Cecal Short-chain Fatty Acid Concentration in Broiler Chickens.” 12 PLoS One 9 (7): e101888. doi:10.1371/journal.pone.0101888.
- Novoa-Garrido, M., S. Larsen, and M. Kaldhusdal. 2006. “Association between Gizzard Lesions and Increased Caecal Clostridium Perfringens Counts in Broiler Chickens.” Avian Pathology 35 (5): 367–372. doi:10.1080/03079450600924150.
- Osman, A. M. 1982. “Amylase in Chicken Intestine and Pancreas.” Comparative Biochemistry and Physiology B 73 (3): 571–574. doi:10.1016/0305-0491(82)90076-1.
- Petit, L., M. Gibert, and M. R. Popoff. 1999. “Clostridium Perfringens: Toxinotype and Genotype.” Trends in Microbiology 7 (3): 104–110. doi:10.1016/s0966-842x(98)01430-9.
- Riddell, C., and X. M. Kong. 1992. “The Influence of Diet on Necrotic Enteritis in Broiler Chickens.” Avian Diseases 36 (3): 499–503. doi:10.2307/1591740.
- Riesenfeld, G., D. Sklan, A. Bar, U. Eisner, and S. Hurwitz. 1980. “Glucose Absorption and Starch Digestion in the Intestine of the Chicken.” Journal of Nutrition 110 (1): 117–121. doi:10.1093/jn/110.1.117.
- Rood, J. I., V. Adams, J. Lacey, D. Lyras, B. A. Mcclane, S. B. Melville, R. J. Moore, et al. 2018. “Expansion of the Clostridium Perfringens Toxin-based Typing Scheme.” Anaerobe 53: 5–10. doi:10.1016/j.anaerobe.2018.04.011.
- Scheppach, W. 1994. “Effects of Short Chain Fatty Acids on Gut Morphology and Function.” Gut 35 (1 Suppl): 35–38. doi:10.1136/gut.35.1_suppl.s35.
- Schlegel, B. J., V. J. NOWELL, V. R. PARREIRA, G. SOLTES, and J. F. PRESCOTT. 2012. “Toxin-associated and Other Genes in Clostridium Perfringens Type A Isolates from Bovine Clostridial Abomasitis (BCA) and Jejunal Hemorrhage Syndrome (JHS).” Canadian Journal of Veterinary Research 76 (4): 248–254.
- Shih, N. J., and R. G. Labbe. 1996. “Characterization and Distribution of Amylases during Vegetative Cell Growth and Sporulation of Clostridium Perfringens.” Canadian Journal of Microbiology 42 (7): 628–633. doi:10.1139/m96-086.
- Songer, J. G. 1996. “Clostridial Enteric Diseases of Domestic Animals.” Clinical Microbiology Reviews 9 (2): 216–234. doi:10.1128/CMR.9.2.216.
- Stutz, M. W., and G. C. Lawton. 1984. “Effects of Diet and Antimicrobials on Growth, Feed Efficiency, Intestinal Clostridium Perfringens, and Ileal Weight of Broiler Chicks.” Poultry Science 63 (10): 2036–2042. doi:10.3382/ps.0632036.
- Suvarna, S., V. Christensen, D. ORT, and W. Croom. 2005. “High Levels of Dietary Carbohydrate Increase Glucose Transport in Poult Intestine.” Comparative Biochemistry and Physiology. Part A, Molecular & Integrative Physiology 141 (3): 257–263. doi:10.1016/j.cbpb.2005.03.008.
- Svihus, B. 2011. “Limitations to Wheat Starch Digestion in Growing Broiler Chickens: A Brief Review.” Animal Production Science 51 (7): 583–589. doi:10.1071/An10271.
- Svihus, B. 2014. “Starch Digestion Capacity of Poultry.” Poultry Science 93 (9): 2394–2399. doi:10.3382/ps.2014-03905.
- Svihus, B., and H. HETLAND. 2001. “Ileal Starch Digestibility in Growing Broiler Chickens Fed on a Wheat-based Diet Is Improved by Mash Feeding, Dilution with Cellulose or Whole Wheat Inclusion.” British Poultry Science 42 (5): 633–637. doi:10.1080/00071660120088461.
- Tallentire, C. W., I. Leinonen, and I. Kyriazakis. 2016. “Breeding for Efficiency in the Broiler Chicken: A Review.” Agronomy for Sustainable Development 36 (4): 66. doi:10.1007/s13593-016-0398-2.
- Tancharoenrat, P., V. Ravindran, F. Zaefarian, and G. Ravindran. 2014. “Digestion of Fat and Fatty Acids along the Gastrointestinal Tract of Broiler Chickens.” Poultry Science 93 (2): 371–379. doi:10.3382/ps.2013-03344.
- Weirdt, D., R., . S. Possemiers, G. Vermeulen, T. C. Moerdijk-Poortvliet, H. T. Boschker, W. Verstraete, and T. V. D. Wiele. 2010. “Human Faecal Microbiota Display Variable Patterns of Glycerol Metabolism.” FEMS Microbiology Ecology 74 (3): 601–611. doi:10.1111/j.1574-6941.2010.00974.x.
- Wong, J. M., R. D. E. Souza, C. W. Kendall, A. Emam, and D. J. Jenkins. 2006. “Colonic Health: Fermentation and Short Chain Fatty Acids.” Journal of Clinical Gastroenterology 40 (3): 235–243. doi:10.1097/00004836-200603000-00015.
- Yang, W. Y., Y. J. Lee, H. Y. Lu, S. L. Branton, C. H. Chou, and C. Wang. 2019. “The netB-positive Clostridium Perfringens in the Experimental Induction of Necrotic Enteritis with or without Predisposing Factors.” Poultry Science 98 (11): 5297–5306. doi:10.3382/ps/pez311.
- Zaefarian, F., M. R. Abdollahi, and V. Ravindran. 2015. “Starch Digestion in Broiler Chickens Fed Cereal Diets.” Animal Feed Science and Technology 209: 16–29. doi:10.1016/j.anifeedsci.2015.07.020.