
 ?Mathematical formulae have been encoded as MathML and are displayed in this HTML version using MathJax in order to improve their display. Uncheck the box to turn MathJax off. This feature requires Javascript. Click on a formula to zoom.
Abstract
The full population of England and Wales employers and own-account business proprietors is estimated using population censuses 1851–1911. The main contribution of the article is a method of mixed single imputation to overcome the challenge of non-responses to the census 1851–1881. This method is compared with alternatives. Downloads of all data allow replication. The method is used to track trends in proprietor numbers and entrepreneurship rates to reassess the ‘decline of Victorian entrepreneurship’, onset of the ‘U’-shaped trough of the twentieth century, the ‘climacteric’ of 1901, and compositional changes by sector and sex. There is strong sector and gender diversity, with changes in female participation major drivers of overall trends. Proprietor numbers show slow increases of employers, and rapid rise and then decline of own-account, with a turning point after 1901. The methodology and turning point is compared and confirmed against the 1921 census and national and local trade directories.
Current affilition for Piero Montebruno: Geographical Research Economist at the Centre for Economic Performance, London School of Economics and Political ScienceSupplemental data for this article is available online at https://doi.org/10.1080/00076791.2021.1894134.
1. Introduction
As noted by numerous commentators, we have lacked adequate statistics of business proprietorship in nineteenth- and early twentieth-century Britain. Hannah (Citation2007, p. 415) likened this period to a ‘statistical dark age’ while Jeremy (Citation1998, p. 331) concluded that secular comparisons are not to be trusted. There has previously been no ‘truth’ data available to understand the scale of the business population and changes of its composition. This has prevented reliable overviews of business history for the period. However, the release of an electronic version of the individual-level manuscript census data for 1851–1911 allows the data gap to be filled using the original census responses. Each census asked business proprietors to identify themselves in some way. From 1891 until modern censuses the question asked people to define themselves as employers, own-account proprietors or workers. The potential of these censuses for the 1891–1911 period has been demonstrated in Bennett, Smith et al. (2018). An initial methodology for covering the earlier censuses for 1851–1881, which identified employers and only partially covered own-account, has been used in Bennett, Smith et al. (2019). This article extends that 1851–1881 methodology, presents alternatives, and tests robustness of the estimates.
The study has two aims: first, to develop and test alternative methodologies for 1851–1881 to join up with 1891–1911, to estimate the whole population of proprietors for the entire period 1851–1911. The second aim is to use these new estimates to reassess key elements of previous literature. The article is primarily methodological, but it also seeks to show the value of the data by addressing three previous research debates that have been stymied by lack of full national data: the so-called ‘declinism’ of the Victorian period; the evolution of Victorian entrepreneurship into a ‘U’-shaped trough over the twentieth century with the associated onset of a ‘climacteric’ around 1900; and reassessing compositional effects on sector markets and gender participation.
A key contribution is making available a means to examine the entire business population, not just large-scale firms: to include what Payne (Citation1988, p. 22) described as the ‘regiments of the anonymous’. Smaller firms have been subject to little analysis at a scale beyond case studies. Yet, as Hannah (Citation2007, Citation2014) observes, small businesses were remarkably persistent, while Marshall (Citation1919, p. 314), thought that for this period they were ‘the representative firm in most industries and trades’, a belief echoed by Pollard (Citation1968, p. 233). Whilst studies of larger firms have characterised much British business history (Çrouzet, Citation1985; Hannah, Citation1983, Citation2014; Jeremy, Citation1991; Landes, Citation1969; Nicholas, Citation1999, Citation2000; Wardley, Citation1999), such studies have significant dangers of selection bias towards the large, successful and those with surviving records. As Nye (Citation1991) argues, if all struggling, failed and would-be entrepreneurs were included, the probability of success would be better understood. The article shows the advantages of whole-population data for overcoming such biases.
The study first summarises the three main debates addressed. It then details how the 1851–1881 censuses collected information, and how methodologies can be developed for identifying the population of proprietors. The resulting proprietor data is deposited at the UK Data Service (UKDS) as The British Business Census of Entrepreneurs (BBCE) (Bennett et al., Citation2020). The following section of the article briefly addresses the three debates by examining trends in entrepreneur numbers, rates, and composition. The article then evaluates the robustness of estimates by comparing with the main whole-population comparator available: national and local trade directories. The discussion is confined to England and Wales but can be extended using the full BBCE data to include Scotland.
2. How new data can give new insights to debates on the British business population
The new information on business proprietors that is developed here provides a valuable resource that can contribute to a wide range of debates in business history. Because of the challenges of using the census data the study is primarily methodological. But it also illustrates the value of the data by showing how it opens up new insights into three key debates. The first is reassessment of claims about the decline of British entrepreneurism over the Victorian period. Explanations for Britain’s relative economic decline after 1870 have frequently been argued to derive from a decline in entrepreneurship (for critical reviews see Edgerton, Citation1997; Tomlinson, Citation2009). Some argue that business proprietors became focussed on property ownership and the trappings of gentility, at the expense of the ‘entrepreneurial ideal’, as Perkin put it (Perkin, Citation1969, p. 436; see also Wiener, Citation1981; Coleman & Macleod, Citation1986). Others have argued that British entrepreneurs failed because they were too conservative, remaining in control of family firms too long, which limited their growth potential (Chandler, Citation1990; Rubinstein, Citation2006). Yet others argue that many proprietors were adequate managers, but failed to press for improvements of the institutional environment which would have allowed Britain to compete in the global economy of the twentieth century (Lazonick, Citation1983), or were too focussed on short term and easy paths (Landes, Citation1969).
Given previous data limitations it is not surprising that it has been difficult to assess the truth of these claims. Inevitably the sources used, based on aggregate data, case studies of a handful of firms, or recourse to literary sources pick up only strands of the larger whole. It has not been previously possible to consider the general population of firms, or whether the behaviour of case study firms was common. Even amongst the largest firms, only a handful have left archives of the kind that allow analysis of whether or not their proprietors abandoned the ‘entrepreneurial idea’, suffered from sub-standard management, or failed to recognise the changing global economy. In this sense previous authors have been unable to adequately understand the selection biases and characteristics of case studies within the behaviour of the population as a whole. This has inevitably led to arguments that are unsustainable. For example, how can the allure of gentility have led people away from the ‘entrepreneurial ideal’ when the new data show that small and medium-sized firms were the vast majority, increased in numbers over the period rather than declined, with increasing rates of involvement by the population, and were mostly run by individuals who were unlikely to come into contact with the institutions that encouraged such a culture, and were more likely to be affected by the changing opportunities of waged labour than aspiring to ‘gentility’?
The second debate addressed here is related to ‘declinism’ and has been important in modern research on small firms and business policy: that a ‘U’-shaped distribution developed over the mid-twentieth century, with declines in small business and self-employment numbers occurring sometime early in the century and then being reversed only by recent growth. From this, various policy conclusions have been drawn as to causes. In Britain the declining limb of the ‘U’-shape appears to have been first noted by Clark (Citation1957). It has been confirmed as a trend in most advanced economies and has been used by Wennekers et al. (Citation2010) and Caree et al. (Citation2007) to suggest that across many countries entrepreneurship changed as a result of shifts in the sector composition of economic development: primarily, that as agricultural proprietorship declined this shed labour that fuelled expansion of other sectors. However, perhaps more important in Britain was the contemporaneous recognition in the Macmillan Committee Report (1931), echoed in the benchmark Bolton Report (1971), that small businesses were suffering from the effects of industrial concentration into large firms which starved small firms of access to capital and other resources. Previously there has been no detailed research possible on how these twentieth century trends originated, when the precise timing of downturn occurred, and how important were changes in sector composition such as farming. The trends can now be properly assessed with the data this article develops.
A discussion in economics related to this ‘U’-shaped ‘slowdown’ in British economic growth is sometimes referred to as a ‘climacteric’, as reviewed by Feinstein (Citation1997, p. xi). One of the earliest contributions by Bowley (Citation1920, p. 26) noted that growth of average money incomes was slow or negative after 1900. Lewis (Citation1978, pp. 128–134) argued that Britain was either unable or too slow to develop remedies because of intensified strength of competition from Germany and the USA, and Phelps Brown and Handfield-Jones (Citation1952, pp. 122–128) found that decline occurred in most manufacturing and agriculture, ascribing it to a slowdown of growth of industrial production compared to money incomes ‘about the turn of the century’.
However, like the ‘U’-shape, Feinstein (Citation1997, pp. xi–xii) noted it was unresolved how far the slowdown occurred at all, actually occurred from around 1900, or was sufficiently marked to merit a title such as ‘climacteric’. McCloskey (Citation1970) suggested that although there was some slowdown this was more an adjustment of growth rates to the resources available and the technological opportunities rather than stagnation. Feinstein’s (Citation1972) data on aggregate sector GDP suggested compositional change: decline in real rate of growth in industrial production from the 1870s offset by growth in services until about 1899, after which continued growth of the UK economy began to rely increasingly on offsetting a national slowdown by income for abroad. This indicates that the 1901 census should mark a turning point in the domestic economy towards a ‘U’-shaped distribution for the rest of the twentieth century. However, the debate has been left largely unresolved since the 1980s because the available aggregate data was limited. The new data presented here allow insights into the extent and form of these changes that has not been previously possible.
Sector composition and participation by different types of people, the third theme assessed here, are important fields to which estimates of the full proprietor population estimates contribute a range of new insights. The UK census is limited in the detail it offers on industry and business structures (it is unfortunate that the census administrators did not follow US counterparts who introduced questions on capital and motive power into their censuses from the 1830s). But the UK census is good at indicating sector and demographic composition. The analysis here uses 13 aggregate sectors.Footnote1 Sectors are generally accepted as the main nexus of market competition and adjustment, and hence compositional change, as used by Marshall (Citation1919), Clapham (Citation1932), Kirzner (Citation1973, pp. 89–101) and Ekelund and Hébert (Citation1983). They also fit into wider narratives regarding the shifting structure of modern industrial economies particularly between agriculture, industry and services (Broadberry, Citation2014; Kuznets, Citation1966; Lee, Citation1984; Shaw-Taylor & Wrigley, Citation2014; Tomlinson, Citation2016). Sectors show the specific fields in which larger firms gained increasing advantages from economies of scale, mechanisation and managerial developments, squeezing out smaller proprietors, as argued by Chandler (Citation1962, Citation1990) and Taylor (Citation1911). But Chandlerian processes were far from uniform. For example, employment figures in agriculture fell but entrepreneur numbers did not. Having information on proprietor numbers gives new scope to assess these long-standing debates about productivity, occupational structure and firm organisation. In addition, data on interactions with changing household structure, female labour force participation, and composition of proprietorship by sex can address important debates in contemporary business history about the extent of female entrepreneurship (Aston, Citation2016; Kay, Citation2009) and evolving social structures (Smith et al., Citation2021a). Assessment of female participation has been bedevilled by poor recording in historical records. The UK census has its own limitations for assessing female participation (Anderson, Citation1999; Higgs, Citation1987), but these are radically reduced by using the original records rather than published census tables that clerically screened much women’s work (Higgs, Citation2015; Wilkinson, Citation2016; van Lieshout et al., Citation2019; You, Citation2020). The census is generally as good as, or better than, other sources for identifying women as proprietors.
3. The population census as a source for business history
The original manuscripts of the UK population census that are now digitally available are the records processed centrally by the census administrators: the General Register Office (GRO). The surviving records 1851–1901 are the Census Enumerators’ Books (CEBs), and for 1911 from the original householder returns. These records were passed to The National Archives (TNA) where they were scanned and transcribed by various commercial genealogy suppliers. The transcripts used for most years derive from FindMyPast (FMP), and for 1881 from the Genealogical Society of Utah (GSU). These have been processed and coded to produce a census database deposit now available at UKDS: The Integrated Census Microdata (I-CeM).Footnote2 The data in this article derive from I-CeM, but are enhanced by the authors in the BBCE deposit to identify and code proprietors, re-code occupations to main business activity, and infill major truncations in FMP transcriptions for 1851 and 1861 using the original CEB records and an additional genealogy database from S&N: The Genealogist.Footnote3 No data for 1871 is yet in I-CeM, but this has been input into BBCE from S&N,Footnote4 although this is only for employers so that 1871 data informs only part of the analysis below.
The later censuses (1891–1911) included an explicit question on ‘employment status’ which identifies all individuals as we require: as employers or own account proprietors, and also explicitly identifies workers. This question has continued into modern censuses in a similar format, although historically it had some flaws which require some re-weighting, as described elsewhere (Bennett, Smith et al., 2018).
In the earlier censuses (1851–1881) the question on employment status was more narrowly focussed on employers. In 1861 the census asked:
In TRADES, MANUFACTURES, or other Business, the Employer must, in all cases, be distinguished. – Example: ‘Carpenter – Master, employing 6 men and 2 boys;’inserting always the number of persons of the trade in their employ, if any, on April 8th [the date of the census]
Similar instructions were used for other years 1851–1881. However, the GRO published few table from the data for non-farmers; only a summary for 1851, selective tables for 1891–1911, and nothing for 1861–1881. This deficiency limited Clapham (Citation1932, p. 35) to very brief discussion of the published tables.
Census responses to these questions created long occupation descriptors. For example, Robert Shaw of Colne, Lancashire was returned in 1881 as ‘Magistrate Cotton Spinner and Manufacturer employing about 1200 workpeople & farming 94 acres, employing 2 men’.Footnote5 This string did not explicitly state ‘employer’, but that status is indicated by the stated employees. All strings have to be searched for this type of content for any employees, and statements of ‘master’, ‘proprietor’, ‘owner’, ‘partner’, etc.Footnote6 These strings were searched algorithmically and, following extensive hand checking, this identified large numbers of proprietors. However, not all employers answered fully, and it was inevitable from the unsatisfactory question design that few own-account proprietors responded.
However, by using the original responses in the digital records and modern methods of post-response supplementation it is possible to use the characteristics of those proprietors who did respond in order to supplement the data on those who did not, as well as using insights from the much fuller later census responses. The supplementation method developed below follows modern census post-response editing (Lyberg & Kasprzyk, Citation1997, pp. 355–358), which was first applied in the 1950s to correct biases in the US census (US Bureau of Census, 1950; Jabine & Tepping, Citation1973). In the UK this was first applied to the occupation question used in this article in the 1961 census, and is now standard (ONS, Citation2019).Footnote7 Similar methods are now routinely applied to a wide range of censuses internationally and to other surveys (see Peress, Citation2010; Rubin, Citation1987, Citation1996; Weeks et al., Citation2018; Zhang et al., Citation2013). Post-survey editing has been little used for historic censuses on the scale required here; for example little attempt has yet been made to adjust and scale-up surviving sample responses from the US Census of Manufactures to give national estimates. Supplementation adjustments are particularly necessary for the format of the proprietor question used in British censuses 1851–1881. Modern analyses show that this format has two of the highest prevalences for non-response: open reporting (Conrad et al., Citation2016, pp. 77–80), and targeting the self-employed who find difficulty in accurate reporting for the smallest establishments with multi-attribute activity (Martin et al., Citation1994: and ).
Table 1. Total proprietor numbers (000 s) 1851–1881 for 13 sectors.
Table 2. Entrepreneurship rates: total numbers of employers, own account, and all proprietors as percentage of all economically active, 1851–1911.
4. Supplementation methodology
Supplementation to identify non-responses aims to provide a continuous series of data that can track proprietor numbers on a consistent basis over the entire period 1851–1911. The methodology identifies response/non-response characteristics of proprietors compared to workers from the later censuses 1891–1911 (as reported in Bennett, Smith et al., 2018) to supplement responses in 1851–1881. Although entrepreneurial characteristics may have changed, the characteristics of those proprietors who responded had similar response probabilities over time; e.g. lawyers and many professions were less likely to respond fully to question in 1891–1911, and this was similar in 1851–1881. More generally, the non-response categories in the earlier censuses closely mirror those of the later censuses.
This is due to the design characteristics of the main census questions, which changed little over time. The least likely to give full responses were those who were not head of the household, especially relatives of the family of the head, because they were not replying in the census directly - it was the head who replied for them. Also less likely to respond fully were individuals living in remoter rural areas, in the densest parts of major cities (locations that were more difficult to survey), and those in occupational sectors such as professions, mining and retailing where multiple census instructions for these categories throughout the period confused respondents (see Bennett, Smith et al., 2019, pp. 64–73). The result is that largely consistent flaws allow the full response patterns available in the later census (by demographic characteristics, sector, and location type) to be used to estimate probable proprietor or worker status in the earlier censuses. It should be emphasised that this type of approach is essential because there is no alternative ‘truth’ data for the whole population collected at this scale, although useful large-scale material is available from trade directories, which is used to test robustness below.
We use the supplementation approach summarised by Rubin (Citation1987, Citation1988), that accurate covariates of proprietor/worker status are observed for all individuals in the census, which is itself a valid full population coverage not a survey, and the values we want to estimate for proprietor status occur in the occupational descriptors for all respondents and non-respondents. Our aim is a supplementation that allows users of our data to get the results from analysis of the incomplete data that would be valid if there were no missing responses, based on the same model posited for the missing data as for the complete data (Rubin, Citation1996, p. 476). The method is a single imputation technique, but tested against alternatives using other assumptions, tests of residuals, and against the only other available large-scale source of directories. The supplementation follows five stages.Footnote8
First, the respondent categories 1851–1881 were identified directly where possible from their occupation strings, such as Robert Shaw above. Several kinds of employers can be extracted, termed here ‘extraction Groups’. These Groups were tagged to a status as either employer, own account, or worker as follows:
Group 1: tagged as employer if stated employees;
Group 2: farmers stating ‘employer’ but with no stated employees, tagged as own account; non-farm ‘employers’ with no employees identified by supplementation.
Group 3: anyone stating ‘master’ but giving no employees, tagged as own account.
Group 4: ‘farmer’ not stating employees or acres, tagged as worker (unless they had other business activities in a portfolio).
Group 5: ‘farmer’ stating acres but no employees, tagged as worker if they had under two acres (the normal size for a smallholder working on other farms).Footnote9 If stating over two acres, tagged as employers if the acreage was large enough normally to require workers in that location, otherwise tagged as own account.Footnote10
Group 6: ‘owners’ or ‘proprietors’ of assets such as mines/quarries, ships/barges (but excluding land/house owner), tagged as employers or own account based on their strings where possible, otherwise by supplementation.
These Groups tag actual responses by proprietor status for all farmers and many other proprietors directly from their census descriptor strings without supplementation (just under 400,000, and about 40 per cent of the final estimated total). Farmers are fully tagged and do not need supplementation because an additional census question for farm acres gives sufficient direct information.
The second stage of the method was to tag the remaining population where the responses were definitely workers (e.g. labourers, servants etc.) or non-economically active. This was implemented for a fine mesh of 844 census occupational categories, or sub-occodes.Footnote11 This filtering directly established that 75 per cent of the economically active correctly did not respond to the census question as ‘employers’ or own account (6–8 million people); they were excluded from proprietor non-response supplementation.
The third stage developed a ‘preferred method’ of supplementation for the remaining non-respondents (Method 1). This was a logit regression estimated from the 1891 census response categories of proprietors and workers applied to the earlier censuses. This estimates the probability of individuals over 1851–81 being in similarly defined response categories using the 1891 logit coefficients. The logit used a wide range of variables to distinguish response categories that differentiate between proprietors and workers (see Appendix). Initially this was done for all proprietors (employers and own account together vs. workers). A similar logit was then applied to separate employer response characteristics from own account. Each logit estimate was developed separately for 844 occupational categories. This method is ‘preferred’ since it is the most direct probabilistic method to distinguish category responses. Further details of the estimates and comparison with alternatives are given in the Appendix.
The fourth supplementation stage was to test robustness by comparing four other alternative supplementations for each of 844 sub-occodes. The preferred logit using 1891 response characteristics is Method 1. Method 2 was a similar logit regression but using 1901 data, with the same covariates. This tests sensitivity of the 1891 responses against 1901. Method 3 was non-statistical, using 1891 extrapolation ratios of respondents to non-respondents for employers, own account, and workers for 1851–1881 in each 844 category. This assumes simple ‘organic growth’ which is plausible in some situations since many proprietors were actually the same people between census years, others were the same business run by new proprietors, and new entrants often tend to increase in proportion to increases in population. Method 4 was identical to Method 3 but used the 1901 respondent ratios. Method 5 was a ‘tailored logit’ that exploits the range of probabilities estimated by Method 1. This ‘tailors’ each respondent/non-respondent probability by selecting logit cut-offs to match the probability ranges for each 844 occupation, whereas Method 1 averages the cut-offs. The method is summarised in the Appendix. It is expected to be less accurate for estimating total non-response numbers, but should identify specific individuals more accurately.
The fifth stage of supplementation compares the preferred Method 1 with Methods 2–4, and with contemporary sources and existing secondary literature, as summarised in the Appendix. This allows substitution between estimation methods as an ‘intelligence-led’ approach; i.e. using secondary sources to guide choices. This is essential given lack of ‘truth’ data to train the estimator. It is referred to as Supplement 1 below. Method 5, referred to as Supplement 2 below, is retained as an independent alternative estimation comparator. This intelligence-led approach follows Rubin’s (Citation1988, p. 81) stricture that well-designed single imputation techniques are perfectly acceptable if checked against alternatives. To allow replication, all the decisions for each sub-occode are available as supplementary materials accompanying Bennett, Montebruno et al. (2018) and Bennett et al. (Citation2019a); the actual people identified by Supplementation 1 and 2 are given in the BBCE data deposit as EMPSTATUS_NUM and EMPSTATUS_IND.
4.1. Internal checks
The alternative methods are compared in : separately for all proprietors, employers, and own account. This offers internal checks. External checks using other data sources are already built into the intelligence-led approach, but are supplemented by comparisons with trade directories later in the article. The intelligence-led final estimate (shown as Supplement 1 in the figure) derives from the logit estimates for 1891 and 1901 (Methods 1 and 2). These are shown in the figure for rounded (R) and unrounded (UR) alternatives, depending on how decimal probabilities are counted; with the UR including all small decimal values. The figure also shows the ratio extrapolations (Methods 3 and 5). The tailored cut-off method is Supplement 2 (individual estimates). Additionally, the figure shows the number in ‘extracted’ Groups 1–6 directly tagged from census responses before supplementation. The Figure gives aggregate numbers, but the actual estimates are for each of the 844 sub-occodes.
Figure 1. Comparison of supplementation estimates of proprietor numbers 1851–81, joined to 1891–1911 data, showing the estimation range for alternatives (R: rounded; UR: unrounded; and extrapolation ratios). The chosen supplementation methods are in bold Supplement 1: intelligence-led; Supplement 2: tailored logit. The tagged census responses are shown at the foot for ‘extracted’ 1851–81 (full 1871 data unavailable).
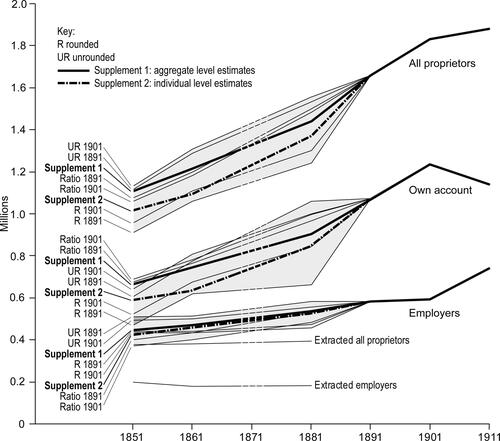
Although the figure appears complex its key features stand out. First, and most important, the main trends are very similar whatever alternative estimate is used. Hence, although precise numbers will carry a level of uncertainty, which can be quite large in some of the 844 sub-occodes, in aggregate the trends for the period of a general increase and then sharp decline after 1901 have a fairly narrow range of possibilities; and this is the basis for the interpretations which we draw out later.
Second, reliance on the tagged census extractions alone results in substantial under-estimation of proprietor numbers. Responding employers were about one half of the fully supplemented numbers in 1851, and for all proprietors it was about a third. This under-estimation, without adjustment, would result in a huge leap in numbers between 1881 and 1891 which is implausible. Third, despite the limitations, the actual extracted census responses capture a slower rate of increase in own-account proprietors and slight decrease in employers 1851–1861 which is largely confirmed by the supplementation estimates.
Fourth, the choice rules between methods used for the intelligence-led approach in Supplement 1 lead to a convergence in most cases towards the median for total numbers between the range of estimates, except in 1851 and 1861 for own account (and hence the total), where the estimates are towards the top of the range of alternatives. Fifth, the range between rounded estimates (R: lower bound) for the logit, and those with many low decimal probabilities (UR: upper bound), is wide for own account, but narrow for employers, as expected since the employer extraction Groups are more complete in the census. However, the choice of rounding is one of the most sensitive aspects: how far we accept very small indications of proprietor characteristics (UR) from the logit, as opposed to requiring a probability that exceeds 0.5 (R). This effect can be clearly seen for the grocers’ example in Appendix ; it strongly favours using rounded estimates which ignore small probabilities of proprietorship, except in maker-dealer categories. Finally, the trends evident for alternative comparator estimates based on tailored cut-offs (Supplement 2) are very similar to Supplement 1, providing a level of internal consistency check. They are 5–10 per cent lower overall than the intelligence-led aggregate estimates, almost entirely deriving from own account with low probabilities of proprietorship, reflecting the higher level of uncertainty for these respondents.
Taken together these features indicate that, while there are inevitable uncertainties in the supplementation, alternatives based on different plausible assumptions about developments over the period give similar general trends.Footnote12 The main differences between methods are for own account, within which the range is most strongly affected by the supplementation chosen for maker-dealers.Footnote13
5. Overview of sector trends, rates, and gender
The primary purpose of this article is methodological, to establish estimates of the proprietor population for 1851–1881 that can link with 1891–1911. Here brief commentary on the long-running debates about Victorian entrepreneurship extends and updates the discussion in Bennett, Smith et al. (2019, pp. 94–98). The article then turns to external robustness checks.
5.1. Aggregate numbers
The new estimates of proprietor numbers 1851–1881 are given in together with the 95 per cent bounds of the estimates, expanding the internal checks outlined in the Appendix and above. The supplementation gives ‘point’ estimates of the total-count for each sex in each sector; the bounds give the confidence interval within which the point estimate in each sector should fall.Footnote14 An important point is that the confidence bounds are very narrow, which reflects that many census responses were accurate (the tagged extracted), most supplementation is applied to individuals who are well-defined by their response characteristics resulting in a narrow range of possibilities (as indicate for the 872 sub-occode ‘grocers’ in ), and the data size is large, which results from the narrow standard errors with high z-values for the logit (see Appendix ).
Table A1. Logit estimates for probability of responding as proprietor in 1891; *** p ≥ 0.01; # indicates interaction variables; z-values for the logit are equivalent to t-tests in normal regression.
The estimates in are a key output from this article. They allow the early census estimates of proprietor numbers to be joined up with the later years (as given in Bennett, Smith et al., 2018). The mid-point estimates are shown for the aggregate as Supplement 1 in . Over the whole of 1851–1911 total entrepreneur numbers increased steadily, although expansion slowed 1901–1911. But within this, employers increased more slowly throughout the period, and most slowly compared to all proprietors between 1861 and 1901, indicating that increasing own-account numbers mainly drove trends of total numbers. After 1901, however, the trends show a major reversal: own account fell absolutely and employer numbers began to increase more rapidly but were insufficient to prevent the growth rate for all proprietors markedly slowing down. It is this point which indicates a turning point and the beginning of any ‘U’-shape: before 1901 there is no indication of a ‘decline’ in aggregate entrepreneurship, but after 1901 there was a re-balancing from own-account proprietors towards those employing others.
This downturn was already evident in the estimates for 1891–1911 given by Bennett, Smith et al. (2018). The new estimates show that this downturn was a major reversal of long-established growth rather than a short-term response. Further confirmation of the significance of the 1901–1911 downturn is provided by comparison with the 1921 published census data. Own-account numbers, which declined by 8 per cent 1901–1911, declined by a further 12 per cent 1911–1921; whilst total proprietor numbers increased by a modest 3 per cent 1901–1911, they declined by 13 per cent 1911–1921.Footnote15 A turning point of proprietor numbers is therefore an early twentieth-century phenomenon not a Victorian decline. This timing fits with the economic arguments about a ‘climacteric’ about 1900, and confirms that it was indeed very significant, though the mainly own-account composition of this change is very different from previous interpretations that mainly focus on agriculture and manufacturing. It demonstrates the declinist narrative, when it addressed overall numbers, placed changes too early: it was clearly a post-1900 phenomenon, rather than occurring in the nineteenth century.
The sector estimates for 1851–1881 given in , joined up with the later censuses, are shown in . This allows the key compositional adjustments in sector markets to be examined. Within the steady increase of numbers up to 1901, maker-dealers were the largest group, the largest contributors to growth, and the largest contributors to dynamics with the largest decline in numbers after 1901. Their turning point in 1901 suggests changes in competitive conditions as maker-dealers experienced increasing competition from specialist manufacturing firms that were gaining advantages from economies of scale, as argued by Chandler (Citation1962, Citation1990) and Taylor (Citation1911). The retail aspect of maker-dealing was also affected by competition from specialist retailers (which shows had the most rapid growth), and multiple stores with branches across the country that displaced independent maker-dealer businesses, notably the expansion of firms like W. H. Smith, International Stores, and shoe chains (Alexander et al., Citation2003; Jefferys, Citation1954; Scott, Citation1994). Similar downturns also affected food sales, and personal services, though less marked than for maker-dealers.
Figure 2. Total entrepreneur numbers (000 s), 1851–1911, for 13 sectors; using supplement method 1 for 1851–81.
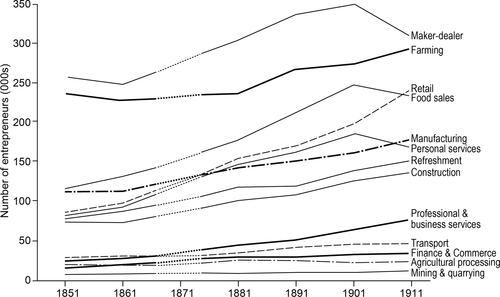
These changes throw doubt on the compositional inferences drawn by Wennekers et al. (Citation2010) or Clark (Citation1957). Farm numbers did not reduce, even though farm labour steadily declined. Increases in farmer numbers began in 1861–1871 and the new estimates indicate that numbers continued to increase. Also manufacturing numbers, though generally growing, declined slightly 1851–1861, and increased relatively slowly up to 1901. Any switch between farming and manufactures did not account for the greatest numerical changes in proprietorship. Looking at proprietor numbers gives an entirely different insight from the trends in occupation numbers that have dominated the previous literature. The largest growth in business numbers until 1901 was in retail and food sales, after which it was construction, professional and business services, and personal services. Hence, manufacturing was far from being the most important contributor to entrepreneurial change, either in numbers or growth rate. The suggestions that manufacturing consolidation and managerial changes of industrial entrepreneurship mainly drove business evolution (e.g. Chandler, Citation1990) were certainly important, but engaged in only one aspect of a much more varied process.
5.2. Entrepreneurship rates
It is essential to compare proprietor numbers against the rest of the working population which was growing steadily over the period. Rates here are compared to the total of all economically active, as shown in . The growth of manufacturing which has dominated the literature absorbed most waged labour in larger factories, with utilities, coal mines and transport undertakings also major employers in large enterprises. Proprietor numbers did not keep pace, resulting in the general rate of entrepreneurship, shown in the last row of the Table, declining slowly until a steeper drop after 1901. This gives weak evidence of a decline in entrepreneurship rates over the Victorian period, but only because numbers slightly lagged behind population growth. As Marshall (Citation1919, pp. 92–93) observed, the nineteenth century had ‘an unprecedented combination of advantages [that] enabled businessmen to make money even when they were not throwing themselves with energy’, which explains why later declines might more easily occur. But the new evidence of proprietorship rates does not support significant decline in proprietorship until after 1901. This further confirms the interpretation of a climacteric, with 1901–1911 showing the sharpest changes of the whole period.
Sector rates are divided into the separate elements for employers in the upper half of , and own account in the lower half. There are some constraints on the interpretation for sectors. For 1871 complete sector data are not available, except for farmers, as included in the table. Also, estimates of sector rates are over-estimated in some cases because some of the economically active cannot be accurately assigned to sectors (mainly general labourers and clerks): this mainly affects manufacturing, coal mining, some construction, and some finance. Nevertheless the main sector effects remain clear. Differences between sectors indicate the radical contrasts in firm size, with higher rates indicating high proportions of generally smaller businesses (as in retail), and lower rates indicating larger business sizes.
The most important feature of tends in employer rates was similarity across many sectors, generally echoing the slow change in the aggregate. Farming was the main exception to the rather stable and then slow decline up to 1901, confirming again that changes in entrepreneurship were not driven by changes in farming, as suggested by Clark (Citation1957), Kuznets (Citation1966), and Wennekers et al. (Citation2010), although shifts in workforce numbers saw a major occupational shift out of farming driven by technological changes and rising demands for labour elsewhere. The other main contrasts for employers from the pattern of stability and then slow decline up to 1901 were the steep decline of finance and commerce where larger firms were making important inroads.
For own-account proprietors there were much more marked changes. The general own-account rate, after a decline 1851–1861, rose slowly 1861–1901, before falling steeply 1901–1911 to give the fastest rate of change for the period (penultimate row of ). The turning point of 1901 in the general rate of proprietorship (bottom row) was thus chiefly a shift in own-account proprietors relative to employers. This is confirmed by comparison with the 1921 census. Own-account rates led the changes that occurred in the twentieth century and contributed the main part of the ensuing down-turning limb of the ‘U’-shape: they declined from 9 to 7 percent 1901–1911 and continued to decline to 6 percent in 1921. In comparison total entrepreneurship percentage rates (bottom row) peaked in 1891, reduced slightly in 1901, but fell steeply from 12.3 to 11.8 over 1901–1911, and reached 9.6 in 1921.
Trends in own-account rates had only minor sector contrasts, with refreshments and retail showing the strongest declines. This echoes the changes in numbers and is one of the largest contrasts with employer rates. It shows one of the largest organisational changes of the period to be the displacement of the single person shop or refreshment hostelry by larger establishments employing assistants, and by national chains with many branches of shops and pubs, in many cases as corporate businesses. For many sectors, however, own-account rates remained stable up to 1901, after which a large reductions in rates were widespread, though the main contributors to this downturn were maker-dealers, retail, food sales, personal services, and refreshments.
5.3. Gender
Sectors interact with other compositional effects such as sex. A key finding from the new data is that there are much higher numbers of female proprietors than found in previous studies (e.g. Aston, Citation2016; Kay, Citation2009), despite limitations of the census data. It is also clear that a significant aspect of aggregate and sector changes derived from changing female participation. As already shown in , women made up over 20 per cent of all proprietors in six sectors: manufacturing, maker-dealers, retail, personal services, food sales, and refreshments. also shows that despite higher uncertainties for female census recording, the bounds of the supplementation estimates in these categories were fairly narrow.
shows the rate of change in number of male and female proprietors abstracted from and joined up with 1891–1911. Changes are shown for two periods: the nineteenth century 1851–1901, and then the period of downturn 1901–1911. The rate of growth of female proprietorship over 1851–1901 was higher for women than men: 62 per cent compared to 54 per cent (bottom row). However, over 1901–1911 the pattern was dramatically different: male proprietorship continued to increase by 6 per cent, but women’s proprietorship decreased by 11 per cent. Thus the decline of female proprietorship was a dominant part of the downturn after 1901.
Table 3. Percentage change in number of male and female proprietors by sector 1851–1911.
The sector composition of this change over 1851–1901 was also remarkable. Whilst the concentration of women as proprietors was highest in six sectors, the change of these sectors was substantial. Five of the six main female sectors experienced growth of over 60 percent: maker-dealers, retail, personal services, food sales, and refreshments. This was almost all own-account growth since the employer proportion in these sectors was relatively small and mostly stable. In contrast, over the same period, only one male sector growth rate exceeded 36 per cent (which was for retail) and only four other sectors exceeded ten percent (farming, construction, manufacturing, and professional services). Hence, women were a key driver of changes in Victorian proprietor growth 1851–1901. Not only were most sectors of female entrepreneurship growing faster, but apart from retail, these were primarily in entirely different sectors from male-dominated industries. There were eight sectors with reductions in female participation 1851–1901, but apart from manufacturing, women were a small minority in all so that these reductions had limited effects on reducing the overall rate of female proprietorship.
Sector composition by sex was also important in the 1901–1911 downturn. The three main female sectors (maker-dealers, personal services, and food sales) lost 80,200 proprietors over 1901–1911, whilst the female aggregate lost only 61,400. The maker-dealers alone accounted for one half of all these losses. In comparison, male proprietorship was slower changing and more stable in the downturn over 1901–1911, with maker-dealers a major part of losses but one third that of women. Hence, the aggregate dynamics for the whole period were strongly affected by the growth of female participation, then its marked downturn after 1901.
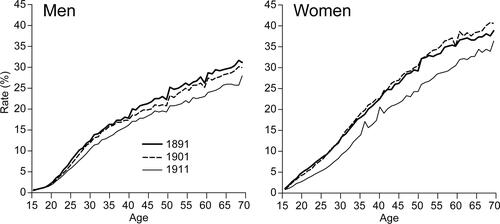
However, despite the strong sector contrasts, comparison of the pervasiveness of the downturn over 1901–1911 in shows that aggregate changes by sex were very similar. The rate of entrepreneurship was lower at younger ages for women, but higher for older. This remained similar between 1891 and 1901, but for 1911 there was a systematic drop in rates across all ages for both sexes, except for the very youngest men (under 22). But the female decline 1901–1911 was roughly twice that for men across all age groups.Footnote16 The lack of cohort effects over the 1901–1911 downturn indicates systemic changes not distinctive exits by older or other age groups.
Figure 3. Male and female entrepreneurship rates 1891–1911 by age, as a percentage of economically active by sex.
6. Comparison with trade directories
It is important to use external checks to confirm the methodology that the new estimates are comparable to those in other sources. However, no other source has a consistent definition and collection regime for business numbers at the national scale required over the period examined; as noted at the outset, there is no national ‘truth’ data. Most alternatives, such as Factory Returns and Board of Trade reports cover only a fraction of proprietors, are sectorally imbalanced, ignore the smallest firms, and have inconsistent coverage over time. Directories, however, come closest to full coverage and their value has been demonstrated in business history for local studies. Two sets of comparisons are made here: national and local.
National trade directories exist in a little-used series compiled by Kelly which aggregated their local directories for the whole country from 1869. These act as a good test of the aggregate census numbers since they cover all sectors, range over the important period of 1871 to 1911, and bridge the difficult divide between the later censuses, and early censuses (1851–1881) where supplementation has to be used. Hence, they provide a uniquely valuable resource for robustness checks. The Kelly directories were initially (Citation1869) compiled for seven broad sectors; three more began by Citation1877, with the last added for textiles in Citation1880.Footnote17 The total entries in England and Wales rise from over 900,000 in 1881, to over 1.3 million in 1911. This is about 70 per cent of the total proprietor numbers estimated here. Their entries were checked by the compilers against alternative sources, of which the published census, professional directories, Board of Trade, Inland Revenue, Factory Returns, and specialist sources are all quoted in the prefaces. Inconsistencies of coverage mainly result from expanding over time the range of sectors included, which can be overcome by aligning specific sub-sectors that were consistently covered.
The national directories are used here in two ways. First, to compare the total counts across all directory entries; and second to compare a sample of sub-sectors that can be aligned with census coding.Footnote18 The comparison of total counts is shown in for nine of the directories, and shippers contained in the directory for Merchants, Manufacturers and Shippers.Footnote19 Dates are shown for the best fits available to census dates leading to some irregularity of comparison points.
Figure 4. Trends of counts of all businesses in England and Wales listed in ten Post Office and Kelly sector directories for 1869–1922.
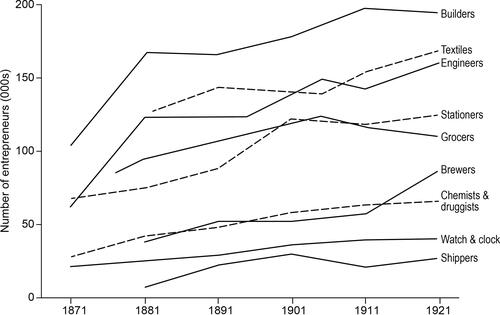
The figure confirms four important features of the general trends evident from census estimates. First, the steady increase in business numbers up to the early 1900s is similar to the census in most of the directory categories, and especially its steepness of growth in some sectors over 1870–1880 (notably builders and engineers, which both experienced radical change in business organisation over the period: builders from the emergence of large scale developer-builders, and engineers through its rapid professionalisation and increased demand for their skills).
Second, the directories confirm the declines after 1900: for 1901–1911 for stationers (which includes printers, newsagents, publishers and retailers) and shippers, and for different edition dates for 1905–1911 for engineers, and grocers (which included many manufacturers of colour, oil, dyes, etc., and dry salters). Third, the effect of a slowdown due to the trade depression in the 1890s, which is partially evident in the census (compare and ), is more clearly seen, especially for builders and engineers. Indeed, this slowdown is noted in several directory prefaces. Fourth, the directory comparisons carried forward to 1921 confirm the emergence of the declining limb of the twentieth century ‘U’-shape, mainly for builders, and grocers; as well as levelling of numbers for chemists, and watch & clock makers.
Unfortunately, these trends cannot be reliably converted to rates because precise matching to the rest of the economically active is impossible given the eclectic directory coverage. However, it is clear that in all sectors the upturn in numbers was too low to counteract the rapid expansion of the economically active. Hence, the levelling of directory numbers after 1901–1911 confirms the climacteric downturn and initiation of the twentieth-century long decline in entrepreneurship rates.
A second comparison is from a sample of 23 directory sub-sectors chosen because they approximately align to specific census occodes and represent contrasting sectors. This comparison focuses on employers rather than own account since directories cover the latter less fully. The comparisons quoted in focus on checking three aspects: first, that the early census data trends are comparable to the directory counts (these are shown in the first set of columns comparing changes 1871–1881);Footnote20 second, that the generally increasing trend carries across the divide between the two sets of census questions (shown for the second set of columns comparing 1881 and 1901); and third, how the downturn over 1901–1911 is reflected in 1911 directories in different sectors.
Table 4. Comparison of percentage change in counts for census employers, and directories, 1871–1911 for 23 sample sectors identified by I-CeM Occode number. Sources: 1871–1881 comparison uses extracted tagged employers only; 1881–1901 uses the supplemented data for 1881.
generally confirms the census analysis: the general upward trend 1871–1881 evident from the census in most sectors, and the start of a downturn in business numbers in the early 1900s. The directories also show that the divide between the early and later census questions is satisfactorily bridged by the supplemented data. Over 80–90 per cent of the sample sectors show the same direction of trend between the census and directories for each period, although there are certainly differences in magnitude: the census generally records larger changes (mainly as a result of directories’ poorer coverage of rural areas). The directories are also valuable in indicating that some of declines may have set in earlier than the census indicates, suggesting that the 1890s trade depression may have affected some retailing, wholesaling and manufacturers more severely, as well as some professions. Hence, while complex, the directory comparisons generally confirm the same trends as the census estimates.
In addition to national directories, local directories can be used to give more precise external checks of supplementation by matching actual individuals. This is piloted here for two contrasted locations in 1881 which both had farming and rural industries as well as commerce and manufacturing: Devizes in Wiltshire, a typical small market town which was prosperous but had a stable population of about 9,000 over the entire period, using Gillman’s Devizes Public Register and Business Directory; and Idle in Yorkshire, a township and small market centre between Bradford and Shipley with large manufacturers of woollens and worsteds, stone quarrying, and general trades with growing population (11,600 in 1851, reaching 13,400 in 1881), using White’s Clothing District Directory. Both were well-connected to a major canal and had rail access, but Devizes was a more self-contained centre for local markets, while Idle was part of the complex and dispersed industrial and textile development typical of the West Riding. The contrasts allow comparisons across rural and urban, stable and growing, with different sector mixes.
compares the directory content with the census after 1881 supplementation. The comparison of columns 1 plus 5, with 7, indicate that the numbers identified in the directories and census are close, with some discrepancies explained by a small number listed in directories being inactive or not proprietors in the census, although both sources were dated 1881. The directories do contain additional traders not identifiable as individuals in the census (about 8 per cent of the directory list), some of whom relate to companies that had their partners or directors elsewhere. On the other hand, the census had definite local employers or own-account proprietors not listed in the directory. Although only a small percentage, some were significant businesses, especially in Idle, where proprietors resident in Idle were not listed in the directory, whilst others with businesses elsewhere were. This is indicative of inconsistent treatment in directories.
Table 5. Trade directory listings for all proprietors in Devizes and Idle 1881; note sex in directories is sometimes impossible to infer resulting in potential for overestimating males (more precise in Devizes than Idle).
compares the census with the directories, before and after supplementation. It confirms that the supplemented census generally gives fuller coverage of proprietors, especially own account. However, before supplementation those extracted from census responses as employers or masters shown on the left side were about 20 per cent of the directory counts (compare ); whereas after supplementation, on the right of , estimates of the total proprietor population of 498 in Devizes and 609 in Idle, are 19 and 27 per cent higher than directories, respectively. This is mainly because directories include fewer own account traders, especially women. Census supplementation also gives separate estimates for employers, own account and workers which are not available from directories., and is particularly valuable in identifying a much larger number of female proprietors than recorded in the directories. Women are almost all the additional individuals identified in Devizes, and half of the additional in Idle.
Table 6. Census listing of proprietors in Devizes and Idle 1881: employers extracted and tagged, and after intelligence-led Supplementation 1.
More detailed comparisons demonstrate the challenges of supplementation. For ‘grocers’, for example, numbering 20 in Devizes and 69 in Idle, all census extracted employers matched individuals listed as ‘grocer’ in the directory, as did all but 2 and 3, respectively, of supplemented individuals. A further 6 census-identified grocers in Devizes and 24 in Idle were not shown in directories, of which 4 and 19 were estimated by supplementation (mainly partners not shown in directories). This shows good matching and demonstrates the advantages of sub-dividing occupations, as shown for grocers in Appendix . There is also close matching for farmers, most retailers and many maker-dealers, such as: bakers, confectioners, butchers, fruiterers, saddlers, victuallers, physicians, hairdressers, drapers, tailors, and cabinet makers. There is perfect matching of Devizes coal merchants, ironmongers, music teachers, solicitors, watchmakers, waste dealers, and other small trades, and near-perfect for Idle in the same trades.
For other sectors, the use of the same occupational descriptors by both proprietors and workers limits precise supplementation infills. For example, the numerical counts were similar for the generic descriptor ‘blacksmith’ between directories and the census, but only one person in each place was the same. Similarly many building trades such as carpenters, painters, plasterers have good numerical matches but poor identification of individuals (though plumbers were well matched in the supplemented). The largest challenge was in Idle where hundreds of ‘weavers’ and ‘spinners’ in wool and worsted were not differentiated between workers and proprietors; three spinners and two weavers identified in the directory were matched in the supplementation but only one employer extracted in Group 1. Similarly the large ‘stone mining’, ‘quarrying’ and ‘stone dressing’ trade in Idle has five 14 directory entries matched, which include all extracted. However, the directory ignores others known from local histories to be operating as small proprietors in a large and famous Idle industry at the time, which were estimated as 26 proprietors in the census supplementation.
An important aspect is that all-female categories listed in directories are exactly matched for 19 ‘dressmakers’, and 7 ‘milliners’ in Devizes, and 5 dressmakers, and 5 of 6 milliners in Idle. But the census also indicates a further 51 and 5 in Devizes, and 51 and 10 in Idle, respectively, who were proprietors, as well as differentiating the numerous workers. Hence, although there are imperfections, the local directory comparisons confirm good estimation by census extractions and supplementation, the wider coverage offered by the census especially of own account and women, but also the limitations for identifying proprietor status of specific individuals who have generalised occupational descriptors.
7. Assessment and conclusion
This article has sought to develop a methodology to supplement the census responses for employers and own-account proprietors in the early British censuses (1851–1881) to align them with later censuses. This provides an entry point for many areas of subsequent research by business historians. The fundamental contribution of the article is methodological: to develop estimates of the whole population of proprietors as a benchmark resource. A major part of the study has discussed what the original census responses provide, and the steps that are required to render these into consistent and robust estimates of the proprietor population. Whilst there are limitations that derive from the format of the original census process, the estimates have fairly narrow confidence bounds and small differences between alternatives, especially for employers. Moreover, the employer supplementation can be confirmed as robust against alternative large-scale estimates available from national directories, and the turning point of 1901–1911 is also confirmed by comparison against the 1921 census. A sample of local directories in 1881 also confirms the robustness of the supplemented estimates of proprietor numbers and that generally greater numbers of proprietors are identified in the census than in directories, especially women. However, the matching for specific individuals varies in quality, mainly weaker where generic descriptors like blacksmith, weaver, spinner or stone quarryman are used. However, many own account and female supplementations, which are expected to be difficult to estimate, match surprisingly well.
Given the imperfect design of the census questions there remain limitations. It is impossible to have totally reliable supplements for responses that were never given at the census date. However, the study overcomes most selection biases in much previous research and allows initiation of a new agenda for business research using whole-population data on proprietors. The alternative supplementations together with the tagged extractions of the original census responses are available in the BBCE data deposit; all supplementation decisions are provided at https://www.bbce.uk/. This will allow other researchers to replicate and explore improvements
The analysis of the new data demonstrates a strong contrast between the long-term steady increase in employer numbers, and the rise and then decline of own account. The developments had strong compositional effects by sector and gender, with the sector distribution showing that the own-account rise and then decline was mainly driven by numerical changes of men in maker-dealing, refreshments, and food sales, and by changes of women’s rate of own account proprietorship participation.
Many different analyses can be developed from these new data. We have focussed on three debates. We demonstrate that the Victorian period does not support the declinist contention: there was no major decline in proprietor numbers until 1901. The new estimates do show a slow decline of employer rates of entrepreneurship, with brief reversal in 1911. However, the decline is trivial compared to what happened over 1901–1921. The new estimates place decline later than previously claimed in the declinist literature, but accord better with the arguments about a ‘climacteric’ around 1901. The new estimates now allow historians to focus on actual proprietors and sectoral change, rather than relying on economic aggregates, case studies, or patchy literary evidence to generalise about motivations.
Since our analysis allows the first reasonably robust estimates of long-term entrepreneurship rates, it also allows inference about the origin of declines in these rates. Rather than declining entrepreneurship, it is now clear that the changes over 1851–1911 derived primarily from changes in the participation of the economically active in the waged labour market, and hence changes in industrial organisation towards concentration in larger firms. Extractions of workforce numbers directly from the employers’ census returns confirm previous knowledge (e.g. Gatrell, Citation1977; Hannah, Citation1983, Citation2007), as discussed more fully elsewhere (Bennett, Smith et al., 2019, pp. 113–116). They show mean, non-corporate firm size increasing from 7.3 to 11.8 over 1851–1881, with firms with over 500 employees increasing from only about 160 in 1851, accounting for 163,000 workers, to about 430 in 1881 employing over 450,000 workers. Those with over 50 employees increased from about 2,900 with 429,000 workers in 1851, to 5,800 firms with over 1.1 m workers in 1881. Hence, the actions of only a few hundred or few thousand large-firm proprietors who were expanding had most impact. In contrast, the much more numerous firm-size classes between 5 and 25 employees failed to expand at a rate equivalent to the economically active, resulting in their proportion of firms and workforce declining over the period. Hence, it was not the major firms and their entrepreneurs that were conservative or focussed outside the world of business, as suggested by Perkin (Citation1969), Wiener (Citation1981) and Rubinstein (Citation2006). Rather it was the slower development of small-medium firms. This was more a result of increasing large-firm dominance, which choked off the pipeline of smaller businesses, than entrepreneurial failure. This issue of firm-size shifts deserves further attention in future research.
What is clear is that the increasing dominance by large firms impacted the waged labour market. Partly this was a result purely of increasing numbers of firms that were very large that could absorb the expanding population. But in terms of effects on entrepreneurship, as indicated in the rate estimates, there were also major effects on incentives. Increasingly, waged employment in many of the numerically largest sectors (retail, manufacturing, agricultural produce) offered comparable or better pay than the profits to be earned in small and marginal firms (especially own-account proprietorship), and also usually gave greater stability and lower risk. This increased the incentives towards being a worker. The resulting very rapid expansion of the worker population appears to be the key factor that drove down the overall entrepreneurship rate at the end of the nineteenth century, and also the chief cause of the deepening ‘U’-shaped distribution of entrepreneurship rates through the first half of the twentieth century.
These changes also interplayed with expansion of the corporate sector which accounted for the overwhelming majority of the largest firms by the 1920s (Hannah, Citation1983, Citation2014). This article mainly engages with non-corporate proprietors because the census questions were imperfect at eliciting replies for corporate directors or managers and have to be supplemented in a different way, investigated article in future research. However, the effect of growth of corporations can be inferred from Feinstein’s (Citation1972) estimates. Non-corporate output continued to grow up to 1911, but was a rapidly decreasing share of total output compared to corporations.Footnote21 Given the trends in proprietor numbers evident in this study, it is clear that the slowdown 1901–1911 coincided with the rapid rise in corporate numbers and incomes which changed fundamentally the balance of incentives towards incorporation, and had critical influences on incentives to take waged posts as foremen or managers in larger firms rather than struggling as a proprietor on one’s own.
Many of the trends that we have highlighted have been previously observed, but our estimates now begin to measure the changes more precisely and unravel the sector composition. We can also date the tipping point when entrepreneurship rates began a steep decline to the period mainly after 1901. This confirms the starting point of the ‘U’-shaped pattern of the twentieth century. Clearly further research is required on the details: especially relative corporate and non-corporate roles, the dynamics of different parts of the firm-size distribution, and the relation between employers and own account in different sectors. The methodological developments presented here open the way for future researchers to explore these and other questions in a way not previously possible.
Acknowledgments
The database used for 1851–1911 derives from a Campop updated version of Schürer, K. and Higgs, E. (2014) The Integrated Census Microdata (I-CeM). Essex: UKDS, SN-7481. https://beta.ukdataservice.ac.uk/datacatalogue/doi/?id=7481. We are grateful to Kevin Schürer, Alice Reid and others at Campop for advice and permission to use this version. The figures were drawn by Phil Stickler. We are grateful for referee comments and various conference feedback on earlier versions of the text.
Disclosure statement
No potential conflict of interest was reported by the authors.
Additional information
Notes on contributors
Robert J. Bennett
Bob Bennett mainly researches on small business management, response to public policy and history of small business development from nineteenth century to present. Major recent books: The Age of Entrepreneurship (Routledge, 2020), History of chambers of commerce 1760-2011 (OUP, 2011), Documents of early chambers of commerce 1760-1839 (OUP & British Academy, 2018), and Small businesses policy (Routledge, 2014); previous books and papers on small businesses, statistics, and public policy. Recent papers in Business History, Economic History Review, Journal of Imperial and Commonwealth History, and Historical Methods. Since 1996 Professor of Geography, member of Cambridge Group for the History of Population and Social Structure, and Senior Associate of the Judge Business School, Cambridge, Emeritus since 2011.
Harry Smith
Harry Smith is a Research Associate at Kingston University working on the project Addressing Health: Morbidity, Mortality and Occupational Health in the Victorian and Edwardian Post Office, and formerly a Research Associate at the Cambridge Group for the History of Population and Social Structure. He has previously worked on the social history of the professions in nineteenth-century Britain. Recent publications include The Age of Entrepreneurship (Routledge, 2020) and articles in The History of the Family, Midland History and Business History.
Piero Montebruno
Piero Montebruno is a Research Economist at the Centre for Economic Performance, London School of Economics and Political Science, and formerly a Research Associate at the Cambridge Group for the History of Population and Social Structure, University of Cambridge. He previously was a part-time Research Assistant for the World Bank and Oxford University ‘Urbanisation in Developing Countries’ project. Historical co-authored papers include: ‘The population of non-corporate business proprietors in England and Wales 1891–1911’, Business History, ‘Households and entrepreneurship in England and Wales, 1851–1911’, History of the Family, and ‘Female entrepreneurship: business, marriage and motherhood in England and Wales, 1851–1911’, Social History.
Carry van Lieshout
Carry van Lieshout is a Lecturer in Geography at the Open University, and formerly a Research Associate at the Cambridge Group for the History of Population and Social Structure. Her work focuses on entrepreneurship and shareholding in late nineteenth and early twentieth-century Britain. Recent publications include The Age of Entrepreneurship (Routledge, 2020) and articles in Social History, Historical Methods and Business History.
Notes
1 The detailed definition of the 13 sector categories is based on census occupation codes (Bennett et al., Citation2017), which also gives a cross-index to other classifications, such as HISCO, Feinstein, or SIC which can be applied to the BBCE data deposit if users prefer; downloads of definitions at https://www.bbce.uk/
2 Schürer and Higgs (Citation2014), Higgs et al. (Citation2015); an earlier e-version for 1881 is also used: Woollard and Schürer (Citation2000).
3 See Bennett et al. (Citation2020). Note that about 3.7 per cent of 1861 records do not survive at TNA. The 1861 results have been up-weighted to maintain comparability of the aggregates.
4 van Lieshout et al. (Citation2018).
5 TNA, RG11 4163/91, 1881 Manuscript Census Enumerators Book.
6 See Bennett and Newton (Citation2015) for full search terms. ‘Director’ identified many corporate proprietors. These were not isolated as a separate category in supplementation, but are included in estimates through their status as employers, own account, and some as workers. Detailed analysis of directors is given in other publications.
7 In 1961 a post-enumeration survey gave the first estimates of census biases and used correction weights for some published occupational tables: see Census of Great Britain (Citation1961, pp. xiv–xx).
8 A full account of the stages given in Bennett, Montebruno et al. (2018) and Bennett et al. (Citation2019a); extended to Scotland in Smith et al. (Citation2021b).
9 See PP (Citation1888, 1895103).
10 Group 5 farmers were assigned as employers where acreage was larger than the average cut-off normally requiring employees to work a farm taking account of the local farming conditions (such as land quality, climate, and degree of access) in that RSD; see Montebruno et al. (Citation2019). A ‘mid-aggregate’ was used, following methods to separate employers and own account in farming where farm size is a truncated lognormal distribution: Allanson (Citation1992), Lund and Price (Citation1998).
11 The 844 sub-occodes split the 797 census occodes given in I-CeM into sub-categories that reflect concentrations of proprietors/non-proprietors in 1891-1901 using their occupational strings; see example in Appendix Figure A1. The I-CeM occodes are given in Higgs et al. (Citation2015); the full list of filtered categories and sub-occodes is given in Bennett, Montebruno et al. (2018).
12 Pilot experiments with other alternatives also confirm the supplementation estimates are comparable to results that can be achieved by various forms of machine learning (Montebruno et al., Citation2020). Perhaps the best improvements in future will lie with combining logit, machine learning and secondary evidence such as directories as piloted later in this article.
13 Further checks and tests in Bennett, Montebruno et al. (2018) and Bennett et al. (Citation2019a). The BBCE database deposit gives the alternatives so that other researchers can opt between them.
14 The confidence intervals are calculated by
where is the total-count estimator and
is the estimator of the variance of the total-count estimator, with,
a two-sided z statistic corresponding to a significance level of α = 0.05 with n − 1 degrees of freedom.
15 Comparison with published 1921 census tables, corrected for seasonal workers affected by 1921 June census date (see Bennett, Smith et al. 2019, Table 4.2).
16 Figure 3 also confirms that any effect of the mobilisation of males into the military that occurred prior to 1914, or changes in the incidence of retirement, was negligible over this period. Analysis of age and family structures for women is taken further in van Lieshout et al. (Citation2019).
17 See references for the directories under The Post Office (for nine directories), and Kelly (for two directories); the titles and coverage of the directories are eclectic with varied sub-sectors.
18 This is approximate: precise comparison of counts is impossible because directories generally list businesses, while the census gives proprietors, partners and directors, leading to generally larger counts than directories.
19 The Post Office Merchants, Manufacturers and Shippers directory contains many foreign agents and brokers which were often only a UK agency. Only shippers and merchants are consistent and well-defined entries in this directory comparable with the census.
20 The BBCE data deposit for 1871 infills I-CeM from S&N. The infill may be imperfect and underestimate employer numbers in 1871, hence exaggerating some growth estimates 1871–81.
21 Feinstein estimates (1972, Tables 23 and 29) for all-UK; further comparison in Bennett, Smith et al. (2019, pp. 129–132).
22 Anderson (Citation1999), Davidoff and Hall (Citation1997), Bennett et al. (Citation2019b).
23 Residuals tests reported in Bennett, Montebruno et al. (Citation2018a).
References
- Alexander, A., Shaw, G., & Hodson, D. (2003). Regional variations in the development of multiple retailing in England, 1890-1939. In J. Benson & L. Ugolini (Eds.), A nation of shopkeepers: Five centuries of British retailing (pp. 127–154). I.B. Tauris.
- Allanson, P. (1992). Farm size structure in England and Wales, 1939-89. Journal of Agricultural Economics, 43(2), 137–148. https://doi.org/10.1111/j.1477-9552.1992.tb00210.x
- Amemiya, T. (1981). Quantitative response models: A survey. Journal of Economic Literature, 19, 1483–1536.
- Amemiya, T. (1985). Advanced econometrics. Blackwell.
- Anderson, M. (1999). What can the mid-Victorian censuses tell us about variations in married women’s employment?Local Populations Studies, 62, 9–30.
- Aston, J. (2016). Female entrepreneurship in nineteenth-century England, engagement in the urban economy. Palgrave Macmillan.
- Bennett, R. J., Montebruno, P., Smith, H., & van Lieshout, C. (2018). Reconstructing entrepreneur and business numbers for censuses 1851-81 [Working Paper 9: ESRC project ES/M010953]. University of Cambridge. https://doi.org/10.17863/CAM.37738
- Bennett, R. J., Montebruno, P., Smith, H., & van Lieshout, C. (2019a). Reconstructing business proprietor responses for censuses 1851-81: A tailored logit cut-off method [Working Paper 9.2: ESRC project ES/M010953]. University of Cambridge. https://doi.org/10.17863/CAM.43891
- Bennett, R. J., Montebruno, P., Smith, H., & van Lieshout, C. (2019b). Entrepreneurial discrete choice: Modelling decisions between self-employment, employer and worker status [Working Paper 15: ESRC project ES/M010953]. University of Cambridge. https://doi.org/10.17863/CAM.37312
- Bennett, R. J., & Newton, G. (2015). Employers and the 1881 population census of England and Wales. Local Population Studies, 94(95), 29–49. https://doi.org/10.35488/lps95.2015.29
- Bennett, R. J., Smith, H., van Lieshout, C., & Newton, G. (2017). Occupations and occupational aggregation of census data 1851-1911. [Working Paper 5: ESRC project ES/M010953]. University of Cambridge, https://doi.org/10.17863/CAM.9874
- Bennett, R. J., Smith, H., & Montebruno, P. (2018). The population of non-corporate business proprietors in England and Wales 1891-1911. Business History, 62(8), 1341–1372. https://doi.org/10.1080/00076791.2018.1534959
- Bennett, R. J., Smith, H., van Lieshout, C., Montebruno, P., & Newton, G. (2019). The age of entrepreneurship: Business proprietors, self-employment and corporations since 1851. Routledge.
- Bennett, R. J., Smith, H., van Lieshout, C., Montebruno, P., & Newton, G. (2020). British Business Census of Entrepreneurs, 1851-1911. [Data collection] UK Data Service. SN: 8600. https://doi.org/10.5255/UKDA-SN-8600-2
- Bolton, J. E. (1971). Small firms: Report of the committee of inquiry on small firms [Cmnd 4811]. HMSO.
- Bowley, A. L. (1920). The change in in the distribution of the national income 1880-1913. Clarendon Press.
- Broadberry, S. (2014). The rise of the service sector. In R. Floud, J. Humphries, & P. Johnson (Eds.), The Cambridge economic history of modern Britain: Volume II, 1870 to the present (pp. 330–361). Cambridge University Press.
- Caree, M. A., Stel, A. v., Thurik, A. R., & Wennekers, S. (2007). The relations between economic development and business ownership revisited [Discussion Paper TI 2007-022.3]. Tinbergen Institute.
- Census of Great Britain. (1961). Occupation report. HMSO.
- Chandler, A. D. (1962). Strategy and structure: Chapters in the history of the industrial enterprise. MIT Press.
- Chandler, A. D. (1990). Scale and scope: The dynamics of industrial capitalism. Belknap Press.
- Clapham, J. H. (1932). An economic history of modern Britain, Vol. 2: Free trade and steel 1850-1886. Cambridge University Press.
- Clark, C. (1957). The conditions of economic progress (3rd) Macmillan.
- Coleman, D. C., & Macleod, C. (1986). Attitudes to new techniques: British businessmen, 1800—1950. The Economic History Review, 39(4), 588–611. https://doi.org/10.2307/2596485
- Conrad, F. G., Couper, M. P., & Sakshaug, J. W. (2016). Classifying open-ended reports: Factors affecting the reliability of occupation codes. Journal of Official Statistics, 32(1), 75–92. https://doi.org/10.1515/jos-2016-0003
- Çrouzet, F. (1985). The first industrialists. Cambridge University Press.
- Davidoff, L., & Hall, C. (1997). Family fortunes: Men and women of the English middle class 1780-1850 (Revised) Routledge.
- Edgerton, D. (1997). The decline of declinism. Business History Review, 71(2), 201–206. https://doi.org/10.2307/3116157
- Ekelund, R. B., & Hébert, R. F. (1983). A history of economic theory and method (2nd ed.). Mc-Graw Hill.
- Feinstein, C. H. (1972). National income, expenditure and output of the United Kingdom 1855–1965. Cambridge University Press.
- Feinstein, C. (ed.) (1997). Introduction: Themes in the economic development of the United Kingdom since 1870 (Vol. 1.). Edward Elgar.
- Gatrell, V. A. C. (1977). Labour, power and the size of firms in Lancashire Cotton in the second quarter of the nineteenth century. Economic History Review, 30(1), 95–139.
- Hannah, L. (1983). The rise of the corporate economy (2nd ed.). Methuen.
- Hannah, L. (2007). The “divorce” of ownership from control from 1900 onwards: Re-calibrating imagined global trends. Business History, 49(4), 404–438. https://doi.org/10.1080/00076790701295821
- Hannah, L. (2014). Corporations in the US and Europe 1790-1860. Business History, 56(6), 865–899. https://doi.org/10.1080/00076791.2013.837893
- Higgs, E. (1987). Women, occupations and work in the nineteenth-century censuses. History Workshop Journal, 23(1), 59–80. https://doi.org/10.1093/hwj/23.1.59
- Higgs, E. (2005). Making sense of the census revisited: Census records for England and Wales 1801-1901. Institute of Historical Research, National Archives.
- Higgs, E., Jones, C., Schürer, K., & Wilkinson, A. (2015). Integrated census microdata (I-CeM) guide (2nd ed.). Department of History, University of Essex.
- Higgs, E., & Wilkinson, A. (2016). Women, occupations and work in the Victorian censuses revisited. History Workshop Journal, 81(1), 17–38. https://doi.org/10.1093/hwj/dbw001
- Jabine, T. B., & Tepping, B. J. (1973). Controlling for the quality of occupation and industry data. Bulletin de L’Institute International de Statistique, 50, 360–392.
- Jefferys, J. B. (1954). Retail trading in Britain, 1850-1950: A study of trends in retailing with special reference to the development of co-operative, multiple shop and department store methods of trading. Cambridge University Press.
- Jeremy, D. J. (1991). The hundred largest employers in the United Kingdom, in manufacturing and non-manufacturing industries, in 1907, 1935 and 1955. Business History, 33(1), 93–111. https://doi.org/10.1080/00076799100000006
- Jeremy, D. J. (1998). A business history of Britain, 1900-1990s., Oxford University Press.
- Kay, A. C. (2009). The foundations of female entrepreneurship: Enterprise, home and household in London, c. 1800–1870. Routledge.
- Kelly & Co & (1869). The Post Office (afterwards Kelly’s) Directory of Chemists and Druggists …; afterwards Kelly’s Directory of the Chemical Industries …, Vol. 1. Kelly & Co.
- Kelly & Co & (1870). The Post Office (afterwards Kelly’s) Directory of the Engineers and Iron and Metal (& Motor) Trades …; later Kelly’s Directory of the Engineering, Hardware, Metal and Motor Trades, Vol. 1. Kelly & Co.
- Kelly & Co (1870). The Post Office (afterwards Kelly’s) Directory of the Building Trades …, Vol. 1. Kelly & Co.
- Kelly & Co (1870). The Post Office (afterwards Kelly’s) Directory of the Grocery & Oil & Color Trades: With which is included the tobacco and provision trades, and wholesale confectioners …, Vol. 1. Kelly & Co.
- Kelly & Co (1872). The Post Office (afterwards Kelly’s) Directory of the Leather Trades, Kelly & Co., Vol. 1.
- Kelly & Co (1872). The Post Office (afterwards Kelly’s) Directory of Stationers, Printers, Booksellers, Publishers, and Paper Makers … Kelly & Co., vol. 1.
- Kelly & Co (1872). The Post Office (afterwards Kelly’s) Directory of the Watch and Clock Trades, Goldsmiths and Jewellers …; afterwards Directory of the Watch, Clock and Jewellery Trades, Kelly & Co. vol. 1.
- Kelly & Co (1877). The Post Office Directory of the Brewers and Maltsters and other Trades connected therewith; (afterwards Kelly’s) Directory of the Wine and Spirit Trades, with which are included Brewers and Maltsters, and Other Trades connected therewith, of England, Scotland and Wales, and also the principal Wine Merchants, etc., on the Continent, Kelly & Co. vol. 1.
- Kelly & Co (1877). The Post Office Directory of the Merchants and Manufacturers of The United Kingdom, being a Guide to the Export, Shipping and Manufacturing Industries; afterwards Kelly’s Directory of the Merchants, Manufacturers and Shippers of The United Kingdom, Being a Guide to the Export and Import Shipping and Manufacturing Industries, Kelly and Co. vol. 1.
- Kelly & Co (1877). Kelly’s Directory of the Cabinet, Furniture (afterwards Furnishing) and Upholstery Trades … etc (Vol. 1). Kelly & Co.
- Kelly & Co (1880). Kelly’s Directory of the manufacturers of textile fabrics …; afterwards Directory of the Textile Industries … (Vol. 1). Kelly & Co.
- Kirzner, I. M. (1973). Competition and entrepreneurship. Chicago University Press.
- Kuznets, S. (1966). Modern economic growth: Rate, structure and spread. Yale University Press.
- Landes, D. S. (1969). The unbound Prometheus: Technological change and industrial development in West Europe from 1750 to the present. Cambridge University Press.
- Lazonick, W. (1983). Industrial organization and technical change: The decline of the British cotton industry. Business History Review, 57(2), 195–236. https://doi.org/10.2307/3114355
- Lee, C. H. (1984). The service sector, regional specialization, and economic growth in the Victorian economy. Journal of Historical Geography, 10(2), 139–155. https://doi.org/10.1016/0305-7488(84)90115-4
- Lesage, É., Haziza, D., & D’Haultfoeuille, X. (2019). A cautionary tale on instrumental calibration for the treatment of nonignorable unit nonresponse in surveys. Journal of the American Statistical Association, 114(526), 906–915. https://doi.org/10.1080/01621459.2018.1458619
- Lewis, W. A. (1978). Growth and fluctuations, 1870–1913. Allen and Unwin.
- Lund, P., & Price, R. (1998). The measurement of average farm size. Journal of Agricultural Economics, 49(1), 100–110. https://doi.org/10.1111/j.1477-9552.1998.tb01254.x
- Lyberg, L., & Kasprzyk, D. (1997). Post-survey processing and operations. In L. Lyberg, P. P. Biemer, M. Collins, E. de Leeuw, C. Dippo, N. Scwharz, & D. Trewin (Eds.), Survey measurement and process quality (pp. 353–370). Wiley.
- Macmillan Committee. (1931). Committee on finance and industry: Report [Chair Harold Macmillan, Cmd. 3897]. HMSO.
- Marshall, A. (1919). Industry and trade: A study of industrial technique and business organization; and their influence on the conditions of various classes and nations. Macmillan.
- Martin, J., Bushnell, D., Campanelli, P., & Thomas, R. (1994). A comparison of interviewer and office coding of occupations. Survey Methods Centre Newsletter, Social and Community Planning Research, 15, 18–25.
- McCloskey, D. N. (1970). Did Victorian Britain fail?The Economic History Review, 23(3), 446–459. https://doi.org/10.2307/2594615
- Montebruno, P., Bennett, R. J., Smith, H., & van Lieshout, C. (2020). Machine learning classification of entrepreneurs in British historical census data. Information Processing & Management, 57(3), 102210. https://doi.org/10.1016/j.ipm.2020.102210
- Montebruno, P., Bennett, R. J., van Lieshout, C., Smith, H., & Satchell, M. (2019). Shifts in agrarian entrepreneurship in mid-Victorian England and Wales. Agricultural History Review, 67, 71–108.
- Nicholas, T. (1999). Clogs to clogs in three generations? Explaining entrepreneurial performance in Britain since 1850. The Journal of Economic History, 59(3), 688–713. https://doi.org/10.1017/S0022050700023536
- Nicholas, T. (2000). Wealth making in the nineteenth- and early twentieth century: The Rubinstein hypothesis revisited. Business History, 42(2), 155–168. https://doi.org/10.1080/00076790000000225
- Nye, J. V. C. (1991). Lucky fools and cautious businessmen: On entrepreneurship and the measurement of entrepreneurial failure. In J. Mokyr (Ed.), The vital one: Essays in honor of Jonathan R.T. Hughes (pp. 131–152). Research in Economic History Supplement 6, Research Annual, JAI Press.
- ONS. (2019). Methodology: Census. https://www.ons.gov.uk/census/censustransformationprogramme/progressanddevelopment/methodology
- Payne, P. L. (1988). British entrepreneurship in the nineteenth century (2nd ed.). Macmillan.
- Peress, M. (2010). Correcting for survey nonresponse using variable response propensity. Journal of the American Statistical Association, 105(492), 1418–1430. https://doi.org/10.1198/jasa.2010.ap09485
- Perkin, H. (1969). The origins of modern English society 1780-1880. Routledge & Kegan Paul.
- Phelps Brown, E. H., & Handfield-Jones, S. J. (1952). The climacteric of the 1890s: A study in the expanding economy. Oxford Economic Papers, 4(3), 266–290. https://doi.org/10.1093/oxfordjournals.oep.a042212
- Pollard, S. (1968). The Genesis of modern management: A study of the industrial revolution in Great Britain. Edward Arnold.
- PP. (1888). Report from the select committee on small holdings; with the proceedings of the committee. House of Commons Papers 358, XVIII. 413.
- PP. (1895). Small Holdings Act, 1892. Return for each county of number of petitions under Small Holdings Act, 1892; amount of land acquired and number of small holdings provided. House of Commons Papers, 407, LXXXIV. 49.
- Rubin, D. B. (1987). Multiple imputation for nonresponses in surveys. Wiley.
- Rubin, D. B. (1988). An overview of multiple imputation. Proceedings of the Survey Research Methods Section of the American Statistical Association, 79–84.
- Rubin, D. B. (1996). Multiple imputation after 18+ years. Journal of the American Statistical Association, 91(434), 473–489. https://doi.org/10.1080/01621459.1996.10476908
- Rubinstein, W. D. (2006). Men of property: The very wealthy in Britain since the industrial revolution (2nd ed.). Social Affairs Unit.
- Schürer, K., & Higgs, E. (2014). Integrated census microdata (I-CeM), 1851-1911. [Data collection] UK Data Service. SN: 7481. https://doi.org/10.5255/UKDA-SN-7481-1
- Scott, P. (1994). Learning to multiply: The property market and the growth of multiple retailing in Britain, 1919-39. Business History, 36(3), 1–28. https://doi.org/10.1080/00076799400000073
- Shaw-Taylor, L., & Wrigley, E. A. (2014). Occupational structure and population change. In R. Floud, J. Humphries, & P. Johnson (Eds.), The Cambridge economic history of modern Britain: Volume I, 1700-1870 (pp. 53–88). Cambridge University Press.
- Smith, H., Bennett, R. J., van Lieshout, C., & Montebruno, P. (2021a). Households and entrepreneurship in England and Wales. The History of the Family, 26(1), 100–122. https://doi.org/10.1080/1081602X.2020.1796750
- Smith, H., Bennett, R. J., van Lieshout, C., & Montebruno, P. (2021b). Entrepreneurship in Scotland, 1851–1911. Journal of Scottish Historical Studies, 41.
- Taylor, F. W. (1911). The principles of scientific management. Harper & Brothers.
- Tomlinson, J. (2009). Thrice denied: “Declinism” as a recurrent theme in British history in the long nineteenth century. Twentieth Century British History, 20(2), 227–251. https://doi.org/10.1093/tcbh/hwp019
- Tomlinson, J. (2016). De-industrialization not decline: A new meta-narrative for post-war British history. Twentieth Century British History, 27(1), 76–99. https://doi.org/10.1093/tcbh/hwv030
- US Bureau of the Census. (1950). The post-enumeration survey: 1950. US Government Printing Office.
- van Lieshout, C., Day, J., Montebruno, P., Bennett, R. J. (2018). Extraction of data on entrepreneurs from the 1871 census to supplement I-CeM [Working Paper 12: ESRC project ES/M010953]. University of Cambridge. https://doi.org/10.17863/CAM.27488
- van Lieshout, C., Smith, H., Montebruno, P., & Bennett, R. J. (2019). Female entrepreneurship: Business, marriage and motherhood in England and Wales, 1851-1911. Social History, 44(4), 440–468. https://doi.org/10.1080/03071022.2019.1656929
- Wardley, P. (1999). The emergence of big business: The largest corporate employers of labour in the United Kingdom, Germany and the United States c. 1907. Business History, 41(4), 88–116. https://doi.org/10.1080/00076799900000346
- Weeks, A., Fallows, A., Broad, P., Merad, S., & Ashworth, K. (2018). Non-response weights for the UK labour force survey? Results from the census non-response link study. Office of National Statistics.
- Wennekers, S., Stel, A., van, C., & Thurik, M. R. (2010). The relationship between entrepreneurship and economic development: Is it U-shaped? [EIM Research Reports]. Zoetermeer.
- Wiener, M. J. (1981). English culture and the decline of the industrial spirit, 1850–1914. Cambridge University Press.
- Woollard, M., &Schürer, K. (2000). 1881 census for England and Wales, the Channel Islands and the Isle of Man (Enhanced Version) [Data collection] SN: 4177. https://doi.org/10.5255/UKDA-SN-4177-1
- You, X. (2020). Women’s labour force participation in nineteenth-century England and Wales: Evidence from the 1881 census enumerators’ books. The Economic History Review, 73(1), 106–133. https://doi.org/10.1111/ehr.12876
- Zhang, L.-C., Thomsen, I., & Kleven, Ø. (2013). On the use of auxiliary and paradata for dealing with non-sampling errors in household surveys. International Statistical Review, 81(2), 270–288. https://doi.org/10.1111/insr.12009
Appe
ndixLogit estimator and alternatives tested
gives the estimates of the logit model for 1891. This is the probability of a census response as proprietor (employer and own account) compared to worker, after non-economically active removed; base categories are worker, urban areas, male and single, household head. Density measured at RSD level; RELA10 is an aggregation of the I-CeM full list of relationship codes; full definitions and sub-occode estimates reported in (Bennett, Montebruno Citation2018, Citation2019b). Logit weighted to adjust for non-response and misallocation bias in 1891; N of observations 7,109,988; Pseudo R2 0.456.
Figure A1. An example of splitting I-CeM occode 697 into sub-occodes for grocers: percent of individuals estimated at each probability level from logit Method 1 for 1851.
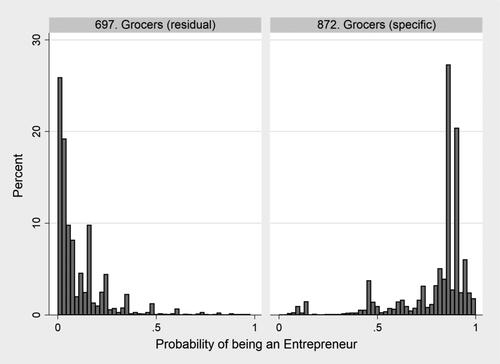
The logit was preferred to a probit because in these census data there are many variables explaining entrepreneur response that are interdependent and non-additive (between individuals), and the individuals themselves are potentially interdependent (within households). Although often preferred in econometrics, for the probit to be valid the individuals have to be independent drawings, and the factors influencing the binary distinction have to be independent of each other and additive so that in the limit the probability link function is cumulative normal (Amemiya, Citation1985, p. 269). Also in modern applications (e.g. Lesage et al., Citation2019; Peress, Citation2010) dichotomous classifiers like the logit have been shown to be equivalent to multiple imputation techniques like those favoured by Rubin (Citation1987, Citation1996). Although the probit can be manipulated and usually yields equivalent results to the logit (Amemiya, Citation1981), given the data structure the logit is preferable.
The logit was initially tested by using it on the 1891 data to see how far it estimated the actual data correctly. This led to a relatively large set of covariates being adopted (as listed in , plus the 844 sub-occode which are not reported). Various more parsimonious estimators were initially attempted. They gave only marginally larger pseudo R2, and tests of randomness of the residuals exhibited a high level of clustering in either urban or remote rural areas. They also gave unsatisfactory estimates in occupational categories which had extensive in-household relationships for employment of family and others, often involving high female participation. These residual relationships reflected the expected interrelationships in the data,Footnote22 and were a reason to favour the logit. They were particularly high for the large categories of lodging-house keepers, dressmakers, and laundry working. In comparison the expanded non-parsimonious logit used the entrepreneur response/non-response characteristics for relationships, gender, marital status, and locational characteristics, and passed the randomisation test that there was no significant clustering of residuals.Footnote23
The logit is the natural estimator to use as a binary classifier (of being a respondent/non-respondent entrepreneur), followed by the binary separation of respondent employers and own-account. The most direct alternative is to use a multinomial logit that splits the observations into the three categories in one step: as employers, own account, and workers. This was tested, but was not superior to the logit: it had similar though more clustered residuals, lower pseudo R2, but higher standard errors. It should be noted that, without ‘truth’ data, there are no statistical tests of fit that can be performed on the early censuses, such as the standard likelihood ratio Chow test, so that comparison tests as used in this paper, or randomisation which is not used, are the only viable ways to proceed.
Decision stages
The logit was also used initially to test if supplementation was required. If the logit estimates of entrepreneur numbers were the same or lower than the number of extracted entrepreneurs identified directly using extraction Groups 1-6 after data cleaning and coding, then no supplementation was required. If the estimates were larger, the respondents were supplemented, with the 1891 logit (Method 1) preferred. Other methods had to show major differences to replace it using three decision rules. Method 1 was retained if within ±10 per cent of the equivalent ratio extrapolations for a sub-occode; failing this, a 1901 logit was chosen (Method 2). If neither logit was within this margin, then the 1891 extrapolation ratio was used (Method 3), failing which 1901 extrapolation (Method 4). Comparisons at each stage by sub-occode were made against known patterns from contemporary and secondary literature to tune the feasibility of the final choice to permit more extreme changes if justified by previous commentary. This means that the logit met the test of having in most cases the smallest difference from alternatives methods, as well as according with known contemporary and secondary literature (an intelligence-led input); but the logit was replaced by an alternative if it did not accord. The decision stages are recorded in downloads so that users can replicate our results, or test alternatives (see supplementary material at https://www.bbce.uk/)
The logit was used for almost 90 per cent of sub-occodes, with over half using 1891; 14.5 percent used ratio extrapolations as shown in . Of the 844 sub-occodes, although only thirty five had no supplementation, most categories needed only small additions. In addition there were two ways to use the logit estimates, each of which gives decimal probability ranging from 0 (not an entrepreneur) to 1 (definitely an entrepreneur). One way of using the logit was to use rounded (R) probabilities up or down from 0.5; an alternative used unrounded (UR) estimates for all decimal probabilities greater than zero (however small that decimal). shows that the UR estimate was often preferred because many non-respondents had small aspects that indicated they should have responded as proprietors, especially in the large categories of own-account maker-dealers, retailers and food sellers.
Table A2. Methods used for intelligence-led Supplementation 1 for estimating all proprietors (employers plus own account) by sub-occode for 1881.
The benefit of splitting some occupations into 844 sub-occodes is illustrated for the case of the census category of ‘grocers and tea dealers’ in 1851. This was split between a new category where their strings contained only specifically ‘grocers’ or ‘tea dealers’, and a residual containing various other occupations coded by the census as grocers as well as any transcription and I-CeM coding errors. As clear from , splitting led to a clear separation between those who were most likely grocer proprietors (occode 872) with probabilities concentrated above 0.8, and the rest (of I-CeM occode 697) whose response was more likely to be grocery workers with probabilities concentrated below 0.25. This figure also illustrates the more general way in which the logit splits probable respondents and non-respondents in a given sub-occode.