
ABSTRACT
Strict environmental rules endorse moderate or intense low oxygen dilution (MILD) combustion as a promising technology to increase efficiency while reducing pollutants emission. The experimental and theoretical investigation of oscillatory behaviours in methane MILD combustion is of interest to prevent undesired unstable combustion regimes. In this study new speciation measurements were obtained in a jet-stirred flow reactor (JSR) for stoichiometric mixtures of CH4 and O2, diluted in N2, CO2 and N2-H2O, at p = 1.1 atm and T = 720–1200 K. Oscillations were experimentally detected under specific temperature ranges, where system reactivity is sufficient to promote ignition, but not high enough to sustain complete methane conversion. A thorough kinetic discussion highlights reasons for the observed phenomena, mostly focusing on the effects of different dilutions.
Introduction
During the past decades, environmental concerns associated with the use of fossil fuels have motivated a great effort in developing new combustion technologies increasing efficiency and lowering emissions. Moderate or intense low oxygen dilution (MILD) combustion is a promising technology, which through strong preheating and high dilution of the reactants simultaneously enhances thermal efficiency and decreases pollutant formation. It takes place when the inlet mixture is preheated to a level higher than its auto-ignition temperature, and maximum temperature rise is limited to a few hundred Kelvin. Despite the emission reduction potential of MILD combustion, fundamental difficulties associated with typical operating conditions exist (Cavaliere and de Joannon, Citation2004; Sabia et al., Citation2013).
Severe working conditions, in fact, carry instability phenomena, caused by thermochemical oscillations. Experimental evidence of methane oscillatory behaviours in MILD conditions was reported in the literature and instability was classified on the basis of wave shapes (de Joannon et al., Citation2004). de Joannon et al. (Citation2004, Citation2005, Citation2006) studied the MILD combustion of methane both experimentally and numerically. They identified several oscillation typologies where the frequencies and amplitudes depend on temperature and carbon/oxygen ratio. It was pointed out that the competition between CH3 recombination and oxidation pathways is more emphasised under such circumstances, and the temperature oscillation modulation was affected by ethylene and acetylene formation. De Joannon and co-workers came to the conclusion that MILD combustion processes cannot be implemented without a preliminary assessment of the auto-ignition process.
Even though methane oscillatory behaviour in the MILD regime has been documented experimentally (de Joannon et al., Citation2004, Citation2005; Sabia et al., Citation2007, Citation2013), very few studies addressed these issues from a kinetic modelling perspective (Sabia et al., Citation2015; Wada et al., Citation2010). To some extent, the scarcity of kinetic modelling studies is also the reason behind the lack of general agreement concerning methane oscillatory phenomena within the combustion community. This study aims to explore the thermochemical oscillation of methane, also focusing on the effect of different dilution gases (N2, H2O, CO2) in promoting or inhibiting such instabilities.
New experimental data for methane MILD combustion at atmospheric pressure and stoichiometric conditions are presented, together with a thorough kinetic discussion of the reasons behind the observed experimental trends.
Experimental setup
The oxidation process of methane under MILD operating conditions was studied in a jet-stirred reactor (JSR). It consists of a quartz sphere of 113 cm3. The main flow is composed of oxygen and a diluent species. It can be preheated up to 1200 K passing through a quartz tube located within an electrically heated ceramic fibre oven. It subsequently mixes with the fuel flow in a premixing chamber. Then the mixture enters the reactor through four injectors located at its centre.
The temperature inside the reactor is monitored using a silica-coated fine wire (40 μm bead size) Pt-Pt 13%Rh thermocouple with a precision of ±2 K. The reactor is located within an electrical ceramic fibre oven to minimise heat loss to the surroundings. The reactor overall heat transfer coefficient was calculated by means of empirical correlations. It is 1.3 × 10⁻³ cal/cm2 s K. Gas flow rates are monitored and controlled by digital thermal mass flow controllers supplied by Bronkhorst® High-Tech with high accuracy (±0.5%).
Experiments are carried out at a constant pressure of 1.1 atm, over the temperature range 720–1200 K and at a fixed average residence time (τ) of 0.5 s. presents the mole fractions of the investigated mixtures. It refers to stoichiometric mixtures diluted with N2 (reference case), CO2 and 49.5% N2/40.5% H2O, keeping a fixed overall dilution degree (d) of 90%.
Table 1. Experiment initial conditions.
Two gas chromatographs are used for the quantification of different species. The former (Agilent 3000) is equipped with two specific capillary columns: a column Plot U to detect online carbon dioxide, ethylene, ethane and acetylene and a column Molsieve 5A equipped with a precolumn Plot U to separate hydrogen, nitrogen, oxygen, methane and carbon monoxide. Species concentrations are quantified using a thermal conductivity detector (TCD). The latter (Agilent 7820A) is equipped with a Carboxen 1010 Plot capillary column and two different detectors, a TCD and a flame ionization detector (FID). It allows for measuring offline carbon monoxide, carbon dioxide, methane, acetylene, ethylene, ethane, methyl acetylene, propylene and propane. Maximum relative errors in mole fractions are estimated to be ±10%, and the detection threshold is about 1 ppm for species analysed using the FID and 100 ppm for species analysed using the TCD.
Numerical simulation
An updated POLIMI mechanism has been used to analyse and discuss the experimental results. This kinetic scheme implements a reduced C0-C3 core mechanism obtained by coupling the H2/O2 and C1-C2 from Metcalfe et al. (Citation2013) and C3 from Burke et al. (Citation2015). The thermochemical properties were adopted from the ATcT database of Rusic, when available, or from Burcat’s database (Burcat and Ruscic, Citation2005). Numerical simulations have been carried out using OpenSMOKE + + by Cuoci et al. (Citation2015). Simulations refer to a non-isothermal perfectly stirred reactor with residence times of 0.5 s.
Results and discussion
MILD combustion of simple hydrocarbons can face a thermochemical oscillation driven by a combination of heat loss and kinetics in a variety of equivalence ratios and a temperature range of 1000–1300 K (Dally and Peters, Citation2007). presents a short list of experimental studies with comparable operative conditions to the current research (p = 1 atm). A set of simulations was performed for these cases, in order to validate and verify the implemented kinetic mechanism.
Table 2. Similar experimental data in JSR.
Prior studies (de Joannon et al., Citation2004, Citation2005; Sabia et al., Citation2007) have revealed the importance of temperature measurement as a criterion for detecting oscillations and classifying their typologies. Whereas, some of the experiments presented in (El Bakali et al., Citation2004; Le Cong et al., Citation2008) were carried out at a higher dilution level. The temperature rise inside these reactors was not significant (<20 K), and according to the authors, the reactors were operating in nearly isothermal conditions.
It should be noted that in these isothermal studies oscillations were not reported; however, an attempt at modelling these cases unveils the presence of a cyclic oscillatory behaviour (). Limited temperature fluctuations with a high oscillation frequency (Higher than 20 Hz), make the experimental detection of this behaviour very challenging. Moreover, the feasibility of capturing these oscillations strongly depends on the thermocouple response time, because experimental facilities are not able to resolve fluctuations in species concentrations due to long sampling time. Thus, experimental measurements represent time-averaged value.
Figure 1. The oxidation of methane in a JSR at atmospheric pressure and φ = 0.3 and 1. Upper panel compares experimental (symbols) and simulation (blue line shows the steady-state solution, and the filled pattern shows oscillation range and variation). The lower panel shows a dynamic simulation of the cases at the starting point of oscillation. Data of T3 is from Ref. (El Bakali et al., Citation2004); T4 and T5 are from Ref. (Le Cong et al., Citation2008).
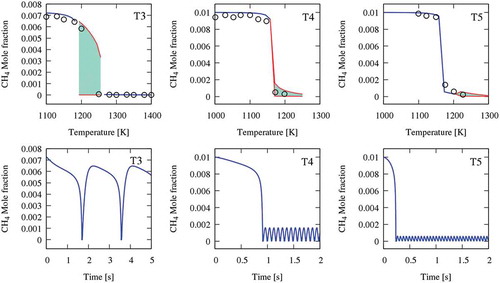
presents a comparison between experimental CH4 profiles and isothermal simulations. The results demonstrate that, despite not experimentally detected, oscillations exist even for these cases. Although the main parameter determining oscillations is temperature, also equivalence ratios and dilutions strongly affect system reactivity. The oscillations in lean conditions (T4 and T5) are marginal with a very limited variation, and they happen near complete conversion (>80%) of the fuel. In contrast, stoichiometric oxidation of methane (T3 in ) can be characterised by a significant variation in fuel conversion (10%–95%). These more pronounced oscillations are of main concern because they can cause critical instabilities in MILD combustion regimes.
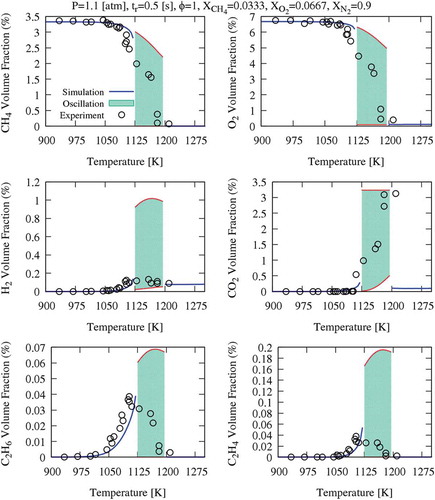
For several conditions of this study, dynamic simulations of JSR confirm that there is no steady-state solution and cyclic oscillations are captured. Three different, stable oscillatory behaviours for different diluted systems have been characterised. shows the measured and predicted species profile (CH4, O2, H2, CO2, C2H6 and C2H4) of case A (diluted with N2). The filled pattern between the upper and lower bands represents the oscillation range captured by the kinetic scheme. The inlet temperature range of oscillation spans from 1125–1195 K. In this figure, CO2 upper oscillation limit is different from other species, and it indeed reaches yields of 3.33% corresponding to complete CH4 conversion.
Figure 2. Methane oxidation in a JSR at P = 1.1 atm, τ = 0.5 s, and φ = 1 diluted with 90% of N2. Oscillation ranges are highlighted with the filled pattern.
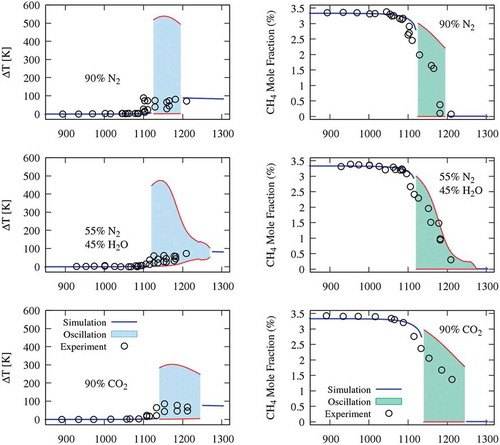
The oscillations can be found in distinct ranges of inlet temperatures for the three diluted systems: N2 (1125–1195 K), N2/H2O (1120–1270 K) and CO2 (1140–1245 K). It is clear that, in such highly diluted systems, heat capacity (Cp) plays a dominant role in determining the flame temperature. The variations of Cp associated with the different bath gases directly impact the range, amplitude and frequency of temperature oscillations. Flame temperature is inversely proportional to specific heat; therefore, CO2 diluted system presents the lowest temperature oscillation range (~300 K), whereas the oscillation range of (N2+H2O) and N2 systems are slightly lower and higher of ~500 K, respectively.
compares experimental and predicted results of temperature and CH4 conversion for the three mixtures. Regions of sustained oscillations are presented with their higher and lower bands, highlighted by the shadow area. The kinetic mechanism coherently reproduces the experimental observations. The oscillations can be predicted in wider ranges due to the relatively slow response of the instruments compared to the characteristic times of the oscillatory behaviour. As previously mentioned, the N2/H2O system shows a wider temperature range of instability, and also shows a dump before converging to the steady-state solution.
Figure 3. Range of temperature oscillations (ΔT = T-Tin) and CH4 conversion versus inlet temperature, for the different dilution systems.
Thermochemical oscillations of the CO2 diluted system
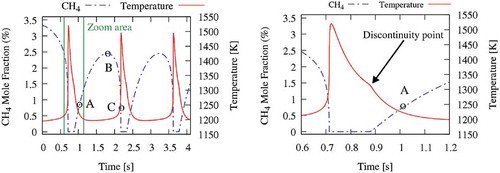
This section analyses the CO2 diluted experiments at an intermediate temperature, T = 1185 K, within the range of oscillations. shows the concentration profile of CH4 (blue line) spanning from ~2.5% down to 0%, with a period of ~1.6 s. The presence of a time interval of ~0.15 s without CH4 is also noteworthy. These thermochemical oscillations are typical of reacting systems where a sudden ignition is followed by a cooling phase with a new accumulation of reactants until a successive ignition. The same also reports the temperature profile (red lines). A maximum temperature of about 1500 K is observed, and, as highlighted in the right panel of , a discontinuity can be seen on the first derivative during the cooling phase.
Figure 4. Temperature and CH4 profiles at 1185 K, in CO2 diluted system. Temperature and methane profile close to the peak temperature (right panel).
Sensitivity analysis is very important to better understand the kinetic motivations behind these oscillations, since it provides a quantitative understanding of how the system reactivity depends on the rate parameters. First-order sensitivity analyses of methane concentration () to the reaction rate coefficients were carried in the three positions of (). To better understand the following discussion, the reader is also referred to showing the concentration profiles of major radical and stable species.
Figure 5. Sensitivity analysis of methane concentration in the CO2 diluted system and Tin = 1185 K (points A, B and C are shown in ).
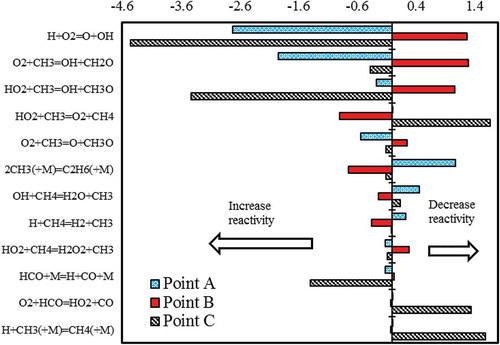
Figure 6. First derivatives of CH4 and O2 profiles of the CO2 diluted system and Tin = 1185 K.
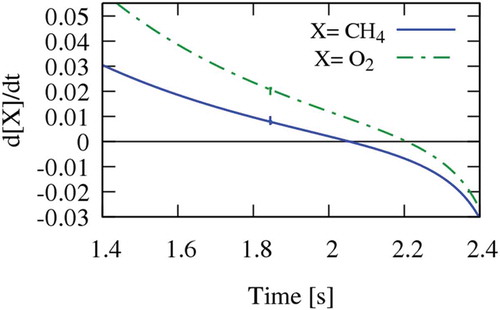
Figure 7. CH4 conversion at 1185 K, CO2 dilution. Profile of major species.
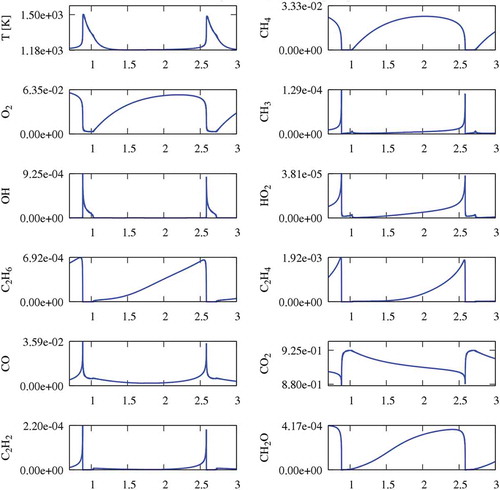
Although the maximum temperature coincides with the time where methane is completely consumed, the discontinuity point corresponds to a new start of methane accumulation inside the reactor. In fact, during the cooling phase, the temperature is not high enough to sustain methane reactivity, at the given residence time. The sudden reduction of CH3, OH and HO2 radical concentrations observed at the same time in is a further confirmation of this behaviour.
Once methane concentration starts to build up (point A), H+O2 = OH+O and CH3+O2 = CH2O+OH emerge as the most sensitive reactions in increasing the system reactivity (negative coefficient). On the contrary, methyl recombination reaction to form C2H6 has the highest positive coefficient, because it acts as a termination reaction, reducing the overall radical concentrations.
Another interesting feature is the competition between the two possible recombination/dismutation reactions of CH3 and HO2 radicals. Although the termination reaction to form CH4 and O2 reduces the system reactivity (positive sensitivity coefficient), the propagation reaction to form CH3O and OH (negative coefficient) clearly increases methane conversion. During this phase of methane accumulation, a significant formation of ethane and also formaldehyde (CH2O) is observed. The relatively high temperature (T > 1200 K) justifies the importance of typical ethane pyrolysis reactions, confirmed by the significant amount of C2H4 in .
The sensitivity analysis carried out in the proximity to the maximum CH4 concentration (point B), confirms the importance of the two competing channels involving CH3 and HO2 and highlights some additional kinetic feature. Every reaction in shows an inversion in the sign of the sensitivity coefficient, representative of a dramatic change in the chemistry of the system. In particular, the branching reaction H+O2 = OH+O shows a strong and unexpected inhibiting effect. This reaction reduces the possibility of H abstractions on methane through H+CH4 = H2+CH3. Moreover, the reason behind such an unconventional behaviour is that OH, at point B, is also consumed through interactions with CH3O and CH2O producing less reactive species (CH3, HO2, O2), whose concentration built up during the induction time.
Conversely, the negative sensitivity coefficient of the methyl recombination to form ethane, previously acting as a termination reaction and giving rise to typical pyrolysis products, acts as an initiator of radical chain reactions promoting the successive ignition. shows a clear visualisation of the competition between pyrolytic and oxidative steps, in fact, while the maximum of methane concentration is reached at τ ~ 2.05 s, the oxygen concentration builds up for slightly longer times reaching a maximum at τ ~ 2.2 s, as reported in terms of first derivatives in . In other words, pyrolysis reactions, mostly involving ethyl radical and its dehydrogenation, progressively promote the onset of oxidation reactions and temperature increase up to the fast ignition of the system, with the peak temperature and the sudden decomposition of the intermediate species.
Point C is located at the sudden temperature increase, also coinciding with the sharp disappearance of C2H6, C2H4, and with a peak of CO concentration. Meanwhile, CO2 concentration first decreases with the reaction CO2 + H = CO + OH, because of a very large H concentration derived from ethyl radical decomposition and methane initiation reaction CH4(+M) = CH3 + H(+M). Only in a second instance this reaction justifies the successive oxidation of CO to CO2. At these conditions, O2 and CH4 are completely converted, and a successive cycle starts.
Temperature effect on system oscillations
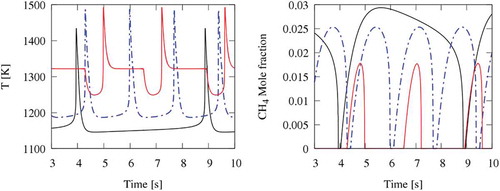
In order to better understand the evolution of these thermochemical oscillations for the CO2 diluted system, compares the cyclic oscillations at three different feed temperatures 1140, 1185 and 1245 K. Due to the rising reactivity, the period of oscillation moves from 5 to about 2 s with increasing feed temperature. For the same reason, the amplitude of CH4 oscillation is the lowest at the highest temperature. Moreover, at 1245 K, the discontinuity in the temperature profile during the cooling phase is more evident. The wide temperature plateau at 1320 K fairly corresponds to the discontinuity point also observed in . Thus, when the temperature exceeds ~1300 K, complete CH4 oxidation can endure for most of the cycle, and the accumulation phase lasts only ~30% of the oscillation period. That is why oscillations cannot be further sustained at higher temperatures.
Figure 8. Oscillations of temperature and CH4 concentration in CO2 diluted systems. Tin = 1140 K (black line); Tin = 1185 K (dotted-dashed line); Tin = 1245 K (red line).
Oscillations analysis in the different diluted systems
compares the cyclic oscillations behaviour of temperature and CH4 concentration in N2, CO2, and (N2+CO2) diluted systems. When comparing the oscillations of the N2 and the CO2 diluted systems, one can observe a larger temperature increase in the N2 system (~500 K), whereas it is only about 300 K for the CO2 system, thus reflecting differences in heat capacities, as previously discussed. The temperature profile of the N2 system has a slightly shorter period of oscillations (~1.5 s) and again shows a discontinuity at about 1300 K. Also, the maxima in CH4 concentrations are very similar.
Figure 9. Oscillations of temperature and CH4 concentration in N2, CO2, and (N2+H2O) diluted systems. CO2 (black lines); N2 (dotted-dashed lines); N2+H2O (red lines).
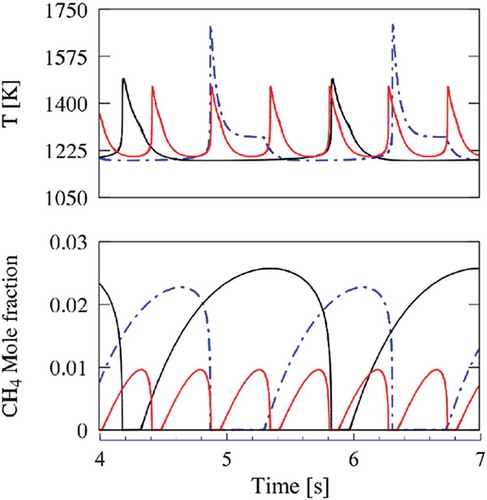
Comparisons between the (N2/H2O) and the CO2 diluted systems show a different situation mainly related to the H2O reactivity. First, the period of oscillation of ~0.6 s is less than one-half of the previous ones, with a similar peak temperature, but a lower maximum in methane concentration profiles. As a first attempt, the collision efficiencies of H2O in CH3+CH3 and CH3 + H recombination reactions were modified, without significant variations in model predictions.
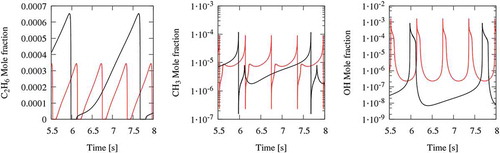
compares the temporal evolution of C2H6, CH3 and OH radicals in the two systems. During the induction phase in CO2 diluted system, shown in the ethane profile, there is a progressive growth of OH and CH3 radicals, until the ignition. On the contrary, the OH radical concentration in the (N2+H2O) system is always high enough to sustain the system reactivity. For the same reason, the oscillations in the (N2+H2O) diluted system can reach only lower temperatures, with respect to the N2 systems. Thus, it appears that the different behaviours of the diluted systems are fundamentally related to the reactivity promoted by OH and H2O, more than to different collisional efficiencies of N2, CO2 and H2O. Similarly, the lower reactivity of the CO2 diluted system is mainly due to the scavenging effect of CO2 on H radicals with the promotion of CO formation through the reaction CO2 + H = OH+CO.
Figure 10. Comparison between cyclic oscillations in N2+H2O (red lines) and CO2 diluted systems (black lines). C2H6, CH3, and OH concentration profiles.
Conclusion
Methane MILD regime in JSR diluted with three different bath gases (N2, CO2 and N2+H2O) has been studied experimentally and numerically. The results show that oscillation happens as a result of competition between fuel conversion and accumulation during the induction time. Oscillations occur at intermediate temperatures, where system reactivity is sufficient to promote ignition, but not high enough to sustain complete methane conversion. The major conclusions of the study are as follows.
Heat capacity (Cp) plays a dominant role in determining the peak flame temperature. The variations of Cp associated with the different bath gases directly impact the range, amplitude and frequency of temperature oscillations.
The competition between the two possible recombination/dismutation channels of CH3 and HO2 radicals is highlighted in both accumulation and ignition phases. Although the termination reaction to form CH4 and O2 reduces the system reactivity (positive sensitivity coefficient), where the propagation reaction to form CH3O and OH (negative coefficient) evidently increases methane conversion.
Pyrolysis reactions prevail over the oxidation ones during the induction phase. While the maximum of methane concentration is reached, the oxygen concentration builds up to slightly longer times reaching its maximum 0.2 s later.
(N2+H2O) diluted system has higher reactivity compared to other systems. The OH radical concentration in the (N2+H2O) system is always high enough to sustain the system reactivity. Thus, it appears that the different behaviours of the diluted systems are strongly related to the reactivity promoted by OH and H2O.
Additional information
Funding
References
- Burcat, A., and Ruscic, B. 2005. Third millennium ideal gas and condensed phase thermochemical database for combustion with updates from active thermochemical tables. Technical Report, ANL-05/20(September), p. ANL-05/20 TAE 960. doi: 10.2172/925269.
- Burke, S.M., Burke, U., Mc Donagh, R., Mathieu, O., Osorio, I., Keesee, C., Morones, A., Petersen, E.L., Wang, W., DeVerter, T.A., Oehlschlaeger, M.A., Rhodes, B., Hanson, R.K., Davidson, D.F., Weber, B.W., Sung, C.-J., Santner, J., Ju, Y., Haas, F.M., Dryer, F.L., Volkov, E.N., Nilsson, E.J.K., Konnov, A.A., Alrefae, M., Khaled, F., Farooq, A., Dirrenberger, P., Glaude, P.-A., Battin-Leclerc, F., and Curran, H.J. 2015. An experimental and modeling study of propene oxidation. Part 2: ignition delay time and flame speed measurements. Combust. Flame, 162(2), 296–314. doi:10.1016/j.combustflame.2014.07.032.
- Cavaliere, A., and De Joannon, M. 2004. Mild combustion. Prog. Energy Combust. Sci., 30(4), 329–366. doi:10.1016/j.pecs.2004.02.003.
- Cuoci, A., Frassoldati, A., Faravelli, T., and Ranzi, E. 2015. OpenSMOKE++: an object-oriented framework for the numerical modeling of reactive systems with detailed kinetic mechanisms. Comput. Phys. Commun., 192, 237–264. doi:10.1016/j.cpc.2015.02.014.
- Dally, B., and Peters, N. 2007. Heat loss-induced oscillation of methane and ethylene in a perfectly stirred reactor. 6th Asia-Pacific Conference on Combustion, May, pp. 1–4.
- De Joannon, M., Cavaliere, A., Faravelli, T., Ranzi, E., Sabia, P., and Tregrossi, A. 2005. Analysis of process parameters for steady operations in methane mild combustion technology. Proc. Combust. Inst., 30(2), 2605–2612. doi:10.1016/j.proci.2004.08.190.
- de Joannon, M., Sabia, P., Tregrossi, A., and Cavaliere, A. 2004. Dynamic behavior of methane oxidation in premixed flow reactor. Combust. Sci. Technol., 176(5–6), 769–783. doi:10.1080/00102200490428387.
- de Joannon, M., Sabia, P., Tregrossi, A., and Cavaliere, A. 2006. Dilution effects in natural gas mild combustioN. Clean Air: Int. J. Energy Clean Environ. Begel House Inc., 7(2), 127–139. doi:10.1615/InterJEnerCleanEnv.v7.i2.30.
- El Bakali, A., Dagaut, P., Pillier, L., Desgroux, P., Pauwels, J.F., Rida, A., and Meunier, P. 2004. Experimental and modeling study of the oxidation of natural gas in a premixed flame, shock tube, and jet-stirred reactor. Combust. Flame, 137(1–2), 109–128. doi:10.1016/j.combustflame.2004.01.004.
- Le Cong, T., Dagaut, P., and Dayma, G. 2008. Oxidation of natural gas, natural gas/syngas mixtures, and effect of burnt gas recirculation: experimental and detailed kinetic modeling. J. Eng. Gas Turb. Power, 130(4), 41502. doi:10.1115/1.2901181.
- Metcalfe, W.K., Burke, S.M., Ahmed, S.S., and Curran, H.J. 2013. A hierarchical and comparative kinetic modeling study of C1 - C2 hydrocarbon and oxygenated fuels. Int. J. Chem. Kinet., 45(10), 638–675. doi:10.1002/kin.20802.
- Sabia, P., de Joannon, M., Fierro, S., Tregrossi, A., and Cavaliere, A. 2007. Hydrogen-enriched methane Mild Combustion in a well stirred reactor. Exp. Therm. Fluid Sci., 31(5), 469–475. doi:10.1016/j.expthermflusci.2006.04.016.
- Sabia, P., Joannon, M.D., Picarelli, A., and Ragucci, R. 2013. Methane auto-ignition delay times and oxidation regimes in MILD combustion at atmospheric pressure. Combust. Flame, 160(1), 47–55. doi:10.1016/j.combustflame.2012.09.015.
- Sabia, P., Sorrentino, G., Chinnici, A., Cavaliere, A., and Ragucci, R. 2015. Dynamic behaviors in methane MILD and oxy-fuel combustion. Chemical effect of CO2. Energy Fuels, 29(3), 1978–1986. doi:10.1021/ef501434y.
- Wada, T., Jarmolowitz, F., Abel, D., and Peters, N. 2010. An instability of diluted lean methane/air combustion: modeling and control. Combust. Sci. Technol., 183(1), 1–19. doi:10.1080/00102201003789147.