
 ?Mathematical formulae have been encoded as MathML and are displayed in this HTML version using MathJax in order to improve their display. Uncheck the box to turn MathJax off. This feature requires Javascript. Click on a formula to zoom.
ABSTRACT
Emissions from traditional cookstoves are a major health concern in developing world households. Improved cookstoves can reduce fuel use and pollutant emissions and here we compare three types of improved cookstoves widely used in Sub-Saharan Africa. These are a raised-bed charcoal stove, a rocket-type stove using wood and straw, and a gasifier stove. Laboratory measurements were made of the main gaseous pollutants, particle size distribution and composition. The genotoxicity of the particles was assessed using a comet assay. The rocket-type stove using dry wood had the highest emission factors for particulate matter and NOX. Emissions of CO and CH4 were a factor of 6–7 higher from the charcoal stove compared with the other stoves tested in this work, and also higher for burning high moisture wood. Fuel properties were critical for emitted particle size, and for the emissions of NOX, black carbon and organic matter.
Introduction
Population growth in Africa is projected to outpace the growth in clean cooking, with an estimated 900 million people being reliant on solid biomass fuels by 2030 compared with the approximately current figure of 836 million now (IEA, Citation2017). Successful use of 100 million improved cookstoves could reduce CO2 emissions from biomass combustion by 11–17% (Bailis et al., Citation2015) and may result in benefits to human health through reductions in air pollutants (Lacey et al., Citation2017). However, the potential benefits of realistic cookstove interventions are still not well known, partly because emissions from improved cookstoves are not well characterised. Recent evidence has suggested that the use of improved cookstoves may reduce fine particulate mass (particles ≤2.5 µm aerodynamic diameter, PM2.5) exposure (Chartier et al., Citation2017). But this evidence has been mixed, with other studies showing reduced health impacts (Just et al., Citation2013; Mortimer et al., Citation2017), possibly because improved cookstoves do not reduce concentrations of ultrafine particles (≤100 nm diameter) sufficiently to achieve substantial health benefits. Therefore, there is an urgent need to better characterise the emissions and their toxicity from improved cookstoves in the field (Hawley and Volckens, Citation2013). Thus, here the comet assay is applied to compare the potential toxic hazard of different particle emissions. The capacity of particles to induce DNA damage (genotoxicity) in cultured lung epithelial cells was assessed using the comet assay (Singh et al., Citation1988). This method was chosen because it is known that combustion emission particles are genotoxic, and genotoxicity is an initiating step in carcinogenesis (Healey et al., Citation2005).
The fuels used in Sub-Saharan Africa consist mostly of wood and charcoal but also agricultural residues, and the nature of the fuel can influence the black carbon (BC) and organic carbon (OC) content of emissions (Atiku et al., Citation2016). A major problem is exposure to biomass smoke during cooking, which is among the top 10 risks for worldwide burden of disease (Chafe et al., Citation2014; Cohen et al., Citation2017). Thus, there have been considerable efforts aimed at improving the performance of cookstoves. The CitationGlobal Alliance for Clean Cookstoves (now Clean Cooking Alliance)is facilitating the use of 100 million improved stoves by 2020 (CitationGlobal Alliance). However, there are difficulties in defining the meaning of ‘improved’ because of the many ways of measuring thermal and emission performance. Consequently, ISO has published a standard on ‘Clean cookstoves and clean cooking solutions – Harmonized laboratory test protocols’ (ISO, Citation2018). The term ‘improved’ when used with cookstoves generally refers to increased efficiency leading to reduced fuel consumption and pollution (Still et al., Citation2015). Some key features of improved cookstoves are better control of airflow to the fuel bed and better insulation (Jetter et al., Citation2012; Tryner et al., Citation2016).
While there are many choices of improved stoves we have examined three contrasting types: an improved (Gyapa) stove designed for use with charcoal although used with wood here as well (which is often the case in practice), a rocket-type wood stove (CarbonZero) and a wood pyrolysis/gasification stove (Lucia WorldStove, Citation2018). These give a range of thermal outputs and have different designs in which the hot combustion products may be used for cooking. The emphasis in this work is on the emission of pollutants, although some attention is given to stove performance. A variety of test methods are available as discussed by Lombardi et al. (Citation2017) and more recently the ISO Standard (ISO, Citation2018) has been published: Part 1. ‘Standard test sequence for emissions and performance’. The Water Boiling Test, was not employed because of the complicating effects of the cooking pot surface on emissions, In actual use, cookstoves are mainly used with a cook pot so testing without a cook pot may not produce emission factors representative of typical use. However the effects vary with the type of cookstove used. In most stoves, flames directly impinge on the surface of the cook pot, the temperature of which is partially dependent on the surface layer of carbon deposits; in others the hot combustion products are influenced by the cold boundary layer of the cook pot; both effects may be present in some stoves. The cooling effects the rates of reaction particularly of CO, NO and particle agglomeration although not the ultra-fine particles (Chung and Violi, Citation2011). The properties of the primary emission products are of considerable interest to combustion chemists and this issue is examined in this paper.
Materials and methods
The cookstoves studied
The cookstove designs tested are shown in . The improved charcoal cookstove was the Gyapa cookstove (GY), a widely used charcoal stove across Africa (Gyapa Enterprises, Citation2018). It is a fixed bed combustor with a partially insulated wall and with a raised ceramic grate with 20 mm air holes and this primary air supply is controlled by a door underneath. Fuel is added by putting it on top of the bed. The improved wood stove was the Carbon Zero (CZ) rocket-type stove (produced by Carbon Zero, Citation2018), which basically consists of a vertical insulated tubular combustor as shown in . It is fired by wooden sticks inserted on a metal feed support onto the open grate, which offers little resistance to the uncontrolled primary air flow. The gasifier stove is the small Lucia Stove (LC), (produced by WorldStove, Citation2018); both gasifier and pyrolyser terms are both used to describe this type of stove, the initial products are formed by pyrolysis but are in the gaseous form so both are appropriate. This ‘top lit’ down-draft stove consists of a metal tube with holes which is mounted inside a metal container. A pyrolysis front moves down through the fuel bed, releasing volatile gases that pass through a lower ring of holes and then up to the top of the stove before being re-injected and combusted in a gas-like ring flame. The temperature in the bed is such that only pyrolysis occurs leaving only unreacted charcoal, which may be used as a fuel or a soil improver. We have used the smallest thermal capacity unit here. The stove in these experiments was fuelled by wood pellets and was operated on a batch basis. Details of the pan supports are given in .
Figure 1. Diagrams of the cookstoves, (a) Gyapa (GY), mass 8.4 kg; (b) Carbon Zero (CZ), mass 13.9 kg; and (c) Lucia (LC), mass 0.25 kg used in the study. The diagrams are not to scale, dimensions in mm. The pan supports consisted of a wire U-shaped loop positioned 1 cm above the exit of the stove and projecting 1 cm into the stove exit.
Fuel sources
Commercial Namibian charcoal was used with the Gyapa stove. It was also operated with two hardwoods and a wheat straw: the hardwoods were dry willow (Salix sp.) and dry and wet oak (Quercus robur); the straw was grain-free wheat (Triticum sp.). Willow and oak sticks had diameters ranging from 2 mm to 26 mm and length ranging from 89–181 mm. The Lucia Stove was operated with wood pellets, 6 mm in diameter with a maximum length of 23 mm. The proximate and ultimate analyses of all the fuels are given in . The nitrogen content of the oak fuel (0.7–1.1%) is relatively high because the sticks contained bark. Fresh cut oak had the highest moisture content (MC) of 27.9% (on an as received (wet) basis). Dry oak samples were produced by heating in a furnace at 80°C for several hours to reduce the MC to 5.1%. The Higher Heating Values (HHV) were calculated from the ultimate analyses using the method of Friedl et al. (Citation2005).
Table 1. Proximate and ultimate analysis of the fuels.
Experimental measurement of emissions
The test assembly and sampling arrangements used for cookstove testing are shown in . The cookstove was placed on a Kern DE 300K5DL platform scale inside an aluminium firebox, which measured 750 mm by 750 mm with a height of 1330 mm. The wall temperature of the firebox did not rise above 100°C during the experiments so wall radiation is negligible. The firebox provides a near-symmetrical inflow of air through 130 mm high inlets around the base providing combustion and dilution air as previously described in Ting et al. (Citation2018). A chimney section, 1 m high and 125 mm in diameter at the centre of the top of the fire-box, was used for sampling of the combustion products and the gas velocity was measured using a S-type pitot tube (these were in the range 1.0 to 4.5 m/s). The combustion products from the chimney were then passed into a dilution tunnel and mixed with laboratory air at a known dilution ratio. The distance of the inlet to the dilution tunnel from the firebox chimney is such that it has no influence on the extraction of the combustion products; the behaviour of the flames above the cookstoves is dominated by buoyancy effects. Diluted combustion products were sampled from the firebox chimney, and additionally diluted combustion products were sampled from the dilution tunnel, as previously described (Ting et al., Citation2018).
Figure 2. Schematic showing experimental arrangement. TC: Thermocouple points.
The exhaust gas composition in the firebox chimney was measured using a Gasmet DX-4000 Fourier Transform Infrared (FTIR) spectrometer; measurements in the dilution tunnel were made using a Testo 340 analyser. Total gravimetric particulate matter (PM) was determined using a Smoke Meter (Richard Oliver) with two back-to-back Munktell MK 360 quartz fibre filter papers held at 70°C. Number concentrations and size distributions of particles below 1 µm in diameter (PN1) were determined using a Fast Particle Analyzer (DMS500, Cambustion Ltd.). The size distributions were retrieved from the measurements using the m2cqs264 inversion algorithm, which has been shown (Symonds, Citation2010) to be suitable for the primary soot spherules at small sizes, and the chain agglomerates at larger sizes found in our experiments. The sub-micron non-refractory aerosol concentrations were measured with an Aerodyne compact Time-of-Flight Aerosol Mass Spectrometer, cToF-AMS. Online measurement of refractory black carbon (rBC) particles was performed using a Single Particle soot photometer (SP2, (Droplet Measurement Technologies Inc.); here only the ratio of rBC to rBC plus OM (organic matter) is given; other results are given in Ting et al. (Citation2018).
Sampling for the DMS, FTIR and gravimetric PM was conducted in the firebox chimney, and by the Testo, AMS and SP2 in the dilution tunnel. Two Dekati DI-1000 diluters were placed in series before the AMS and SP2, giving a three-stage dilution effect. Thermocouples were used to measure temperatures of the exhaust gases in the firebox chimney, the inner surface of the firebox wall and of the combustion products from each cookstove; here the temperatures were measured at the position of the pan supports (see ) and one third of the distance diametrically in from the cookstove wall. No cook pot was used in these experiments. Testing without a pot does not produce emission factors representative of typical use. In actual use, cookstoves are mostly operated with a cook pot which can change the air flow through the stove, especially for the types of stoves that were tested. Flames and hot gases are quenched by the relatively cold surface of the pot – this can affect the combustion temperature, particle formation, and emission characteristics. It should also be noted that cookstoves are typically operated most of the time with a cooking pot or other cooking vessel in place.
All experiments include the cold start emissions for the first batch of fuel after ignition using a firelighter. A kerosene-based solid firelighter (Zip High Performance) with a mass of 100 g was used with the Gyapa and CarbonZero stoves and liquid kerosene (about 15 ml) was used with the Lucia stove. The total length of time for typical tests is shown in the Figures S1–S3 in the Supplementary Matter. The test time was not determined in advance but depended on the amount of fuel and the stove type. Due to the differences between the stoves, the number of fuel reload batches per test varied between 3 for GY charcoal and 15 for CZ dry oak. Each test was repeated twice and average emission factors and variability across all tests are reported. The mass of fuel was kept constant between batches and between repeat runs. Error bars represent the margin of error (MOE) = t* (S/√n). S is the standard deviation across n fuel batches and the t*- statistic was calculated for each dataset for the 95% confidence interval. The LuciaStove was used only once and not reloaded as it is not designed for fuel to be added after ignition. After each test, the residues containing ash and unburnt fuel were heated in a furnace at 550°C to determine the unburned combustible fraction.
Emission factors were calculated using a method based on the total capture method ISO, Citation2018). Here, all pollutant emissions from a cookstove were measured in the firebox chimney or dilution tunnel, and the emission factor is calculated as:
where Ci is the concentration of species i, Q is the flow rate in the exhaust chimney or dilution tunnel and m the mass of fuel burned between times t0 and t. The conversion efficiency of each stove, η, was calculated from the thermal (qa) and chemical (qb) heat losses in the exhaust gases, and heat losses due to the unburned combustibles in the residues (qr), where η = 100 − (qa + qb + qr). The modified combustion efficiency (MCE) is defined as the ratio of [CO2]/[CO + CO2] which is effectively an indicator of the completeness of combustion. phase.
Comet assay
The filters were weighed before and after particle sampling to determine total particle mass per filter. Quartz fibre filters were stored at −20°C until needed. Human A549 cells were cultured in Dulbecco’s Modified Eagle’s Medium (DMEM) to 75% confluence in a 6-well plate. The filters were cut into quarters using scissors. One quarter was used in each experiment by cutting the filter into small pieces that were mixed with 3 ml of cell culture media. The mixture was vortexed and then pipetted onto the cells in a six well plate. Clean filters treated the same way were used as negative controls. Each experiment was performed in duplicate. After overnight exposure to particles, cells were harvested and an aliquot of 2 × 10⁶ cells was added to low melting point agarose (1% w/v), on a frosted microscope slide. The single cell gel electrophoresis (SCGE), or comet assay, was carried out to determine the induction of DNA damage by the particles as previously described (Mu et al., Citation2012).
Results
Stove performance indicators
The stove performance was assessed by the thermal output, fuel consumption and useful temperature produced at the position where a cooking pot would be placed. These results are presented in .
Table 2. Stove performance indicators.
The wood fuel consumption was measured to be 0.7−1.8 kg/h in both GY and CZ stoves, Charcoal burns more slowly in the GY stove (0.4 kg/h) as might be expected. Despite the thermal output of the Lucia WorldStove being lower than the other stoves size, during steady state conditions a gas temperature of 679 ± 40°C was maintained at the pan supports. This arises because the gasified fuels are burning as partially premixed flames although the combustion gases are diluted before reaching the position of the pan supports. The cookstove conversion efficiency for the Lucia stove is low because it is assumed the product, residual charcoal, is not used, although it may be used for other purposes such as a fuel or as a biochar. The char yields ranged from 19.8 to 21.4 wt% and the typical composition was C 70.9; H 3.0; N 0.23 and S 0.02 wt % dry basis. The temperature at the pan supports also fell by 200°C and 105°C for the GY and CZ stoves, respectively, when wet fuel was added which reduced the combustion efficiency by up to 15.5%.
Emissions factors for the different species, i, (efi)
Emissions factors for different species are given in and The GY charcoal stove emitted up to 4 times less PM, 2.5 times less NOX and 2.3 times less CH2O (formaldehyde) than dry wood fuel with the CZ stove. However, emissions of CO, CH4 and C6H6 (benzene) were up to 6.5, 6.7 and 3.4 times higher, respectively. The PM, NOX, CH2O and C6H6 emissions for the Lucia stove were similar to the charcoal stove, but CH4 and CO emissions were among the lowest of all tests. Previous studies have reported lower PM emissions and higher CO emissions from charcoal stoves (Jetter et al., Citation2012), although in these experiments a cook pot was used.
Figure 4. Emission factors for minor pollutants studied (mass of species/kg of dry fuel). Error bars represent MOE.
Emission factors for many pollutants are increased significantly when wood with high moisture content (27.9%) is burned rather than dry seasoned wood (5.1%). The ratio of EFs for wet wood compared to dry wood for the CarbonZero and Gyapa stoves are given in .
Table 3. Ratio of EF (wet wood): EF (dry wood) for oak in the CarbonZero (CZ) and Gyapa (GY) stoves.
The dry oak gave the highest emissions of NOX in the CZ stove because of the high nitrogen content (Mitchell et al., Citation2016). Detailed emission profiles from three of the tests, Gyapa stove (GY) using charcoal, the rocket stove (CZ) using dry and wet wood and the Lucia Gasifier (LC) using wood pellets are given in the Supplementary Information in Figures S1 to S3.
Emissions of NO and SO2 are strongly associated with flaming combustion and high burning rates, whereas CO and CH4 are associated with smouldering and low MCE. During the steady state combustion with the Lucia stove, the concentrations of CH4 and CO were very low (and near the limit of detection): much of the CH4 and CO was emitted in a spike near the end of the test, when only the char remained together with a small amount of unreacted volatile matter.
The concentrations of BC and OM were determined online using the SP2 and AMS instruments. The average ratios of BC/[BC+OM] are shown in . The highest BC/[BC+OM] ratios were observed for the dry wood fuels (0.69–0.81) which reduced to 0.10–0.18 for the wet oak. The ratio was consistently low for charcoal burning (0.02) due to very low BC emissions, except for during the ignition phase. BC and OM are highly dependent on fuel type and combustion phase, as shown in Figures S1-S2.
Table 4. Emission of particulate matter.
A drop in the ratio BC/(BC+OM) was observed in Figure S2 at 72 min from ignition when wet fuel was added to the stove. Adding wet fuel to the stove also resulted in a reduction in acetylene (C2H2) emissions and an increase in acetic acid (CH3COOH) emissions.
Particle size distribution and composition
The particle size measured using the DMS instrument depended on fuel type and stove type, as shown in . Similar results have been obtained by (Rapp et al., Citation2016; Caubel et al., Citation2018) using a FMPS (Fast Mobility Particle Sizer Spectrometer) made by TSI. Emissions from dry wood exhibited a bimodal particle size distribution with diameter peaks at 15–24 nm and 130–160 nm, and a count median diameter (CMD) of 31–47 nm. The relative height of the peaks is determined by the phase of the combustion cycle. During char burnout, the smaller nucleation mode dominates whereas during flaming combustion the larger accumulation mode dominates; probably due to agglomeration resulting from the higher soot concentration. This is confirmed by the charcoal particle size distribution, which has a single, skewed peak, at 13–31 nm diameter and a CMD of 39 nm. There is a small peak at 87 nm, which is associated with fuel ignition and agglomerate formation from the small proportion of fuel volatiles (16% db). The wet oak showed a more variable bimodal distribution than dry oak, with a large peak at 23–32 nm and a much smaller secondary peak at 113–155 nm. The CMD was slightly larger than that for the dry fuel at 36–49 nm. Straw burning had a heavy skewed bimodal distribution with the largest peaks in the range 17–22 nm, smaller secondary peaks at 145–179 nm, and a CMD of 23 nm. The number concentration was also much higher than that for most other fuels, possibly due to the presence of inorganic particles such as KCl (Johansson et al., Citation2003). The gasifier emitted the smallest diameter particles with a large peak at 11–12 nm and a CMD of 14 nm. There was a smaller secondary peak at 155 nm, which again was associated with the ignition phase.
Figure 5. Particle size distributions for dry and wet oak on the CZ stove, charcoal on the GY stove and pellets in the Lucia gasifier stove. The time averaging periods are from the addition of one fuel batch through flaming and smouldering phases until the next fuel batch is added.
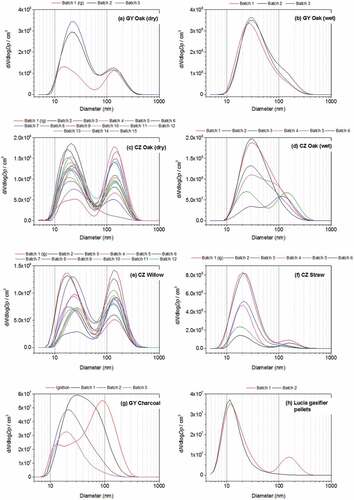
Measurements were made of the particle number emission factors. Dry wood fuel and charcoal have emission factors of 7.8–9.8 × 10¹⁵ particles/kg. Wet wood in the Gyapa and Carbon Zero stove, straw in the Carbon Zero stove and pellets in the gasifier stove have high emission factors of around 14–16 × 1015 particles/kg. The data obtained are given in .
Genotoxicity results
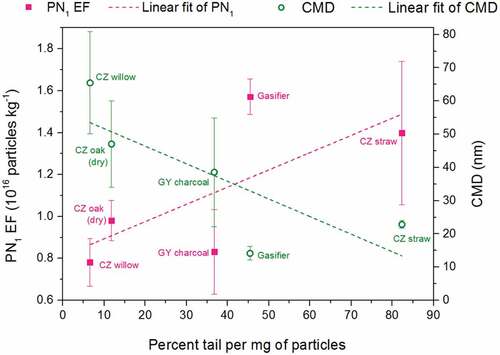
The comet assay was used to detect DNA damage in A549 cells induced by exposure to particles collected from the cookstoves. shows the % tail DNA (a measure of DNA damage) induced by the various samples. As the particles were collected on quartz fibre filters from which the particles cannot be easily removed, and different samples contained different mass of particles, it was not possible to test equal mass of different samples. Instead the mass of the whole filter was determined and one quarter was used in each experiment. As a result, each different particle type tested contained a different mass. In order to compare the results, the % tail DNA was adjusted to give a value per mg of particle tested. Larger values indicate greater damage to the cells and greater particle toxicity. Particles from the CarbonZero stove with dry wood fuels induced the lowest amount of DNA damage per unit mass of particulate, whilst particles from the CarbonZero stove with straw fuel induced the most DNA damage. The emission rate is also important.
Table 5. Results of the comet assay.
As shown in there is a weak correlation between genotoxicity and particle number emission factor (R2 = 0.50, n = 5) and toxicity and CMD (R2 = 0.63, n = 5). This suggests (but does not prove) that these high numbers of small diameter particles have the highest toxicity. The gasifier has a low PM EF but it has a high particle number EF as shown in ; similar results have been observed previously (Just et al., Citation2013).
Figure 6. Plot of toxicity (% DNA in tail per mg) as a function of particle number (PN1) emission factor and count median diameter (CMD). Error bars show MOE between repeat tests.
Discussion
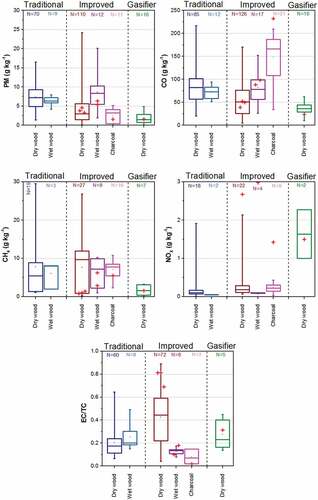
The pollutants produced from burning biomass in cookstoves can be categorised into three groups, smoke, CO and acid gases. The smoke largely consists of incompletely combusted products, largely soot, together with some ash and metallic aerosols; it is usually associated with CO. The primary acidic gas is NOx (NO together with some NO2), SO2 and HCl (and CO2). In traditional cookstoves, the amount of the non-combusted species formed depends on the design of the combustion chamber, and thus the reaction time available, the temperature profile and the degree of mixing of the reactants; the fuel composition is important too, particularly in the extreme cases, e.g. very wet wood verses dry wood, and very carbonaceous fuels such a charcoal verses cellulosic biomass. As far as the acidic products are concerned, the NOx is dependent on the fuel-N content in the feedstock (as well as the combustion temperature), and the S and Cl pollutants are dependent on the organic species in the biomass as well as the mineral composition. Consequently, the emission factors determined by different research groups using different stoves and different test methods vary significantly as shown in . This is largely due to variation in operation and other factors such as the insufficient specifications of the fuels; this is particularly the case for fuel-nitrogen and moisture content. synthesises published EFs for CO, PM, NOx and CH4 from previous studies for comparison with the present experimental data. They are, within experimental error, consistent with measurements of combustion products from a variety of stoves in Uganda using a multi-point sampling rake (Eilenberg et al., Citation2018), and in Malawi using the same method (Wathore et al., Citation2017). These measurements were made with cookstoves with cooking vessels in place during typical use. Indeed the only major differences between these results and those with a cookpot are for EC/TC, where the present results are higher, and for NOx, where the present results are higher. In the case of NOx there are significant uncertainties because fuel-N contents are not often specified.
Figure 7. Comparison of emissions factors of this work (red crosses) with literature values. For each stove type, classified as traditional, improved or gasifier, the mean (dot), median (line), 25th and 75th percentiles (box) and range (whisker) are shown. The number of stove/fuel combinations (N) is shown at the top of the panel. The original data and references are given in the supplementary information.
We have studied three types of stoves, two combustion units and a unit based on pyrolysis and subsequent combustion of the gaseous products. In the Gyapa cookstove (GY) and taking a typical combustion rate of 1 kg/h (based on the results obtained here in ) and assuming 50% excess air (based on a similar system, Shah and Date, Citation2011), the hot gases emerge at an assumed temperature of 1200°C from the top of the bed. Air is entrained resulting in a temperature at the cook pot support of about 500°C, and this implies about 50% air entrainment at the measurement point. This in turn suggests an average exit velocity of about 4 cm/s and a residence time from the bed to the pot of about 1 s. It should be noted that the ‘improved’ Gyapa (GY) cookstove has an outer partially insulating ceramic layer (50 mm thick) to prevent heat loss. But it has a nearly-flat upper surface (see ) which would result in increased air entrainment thus nullifying the gain from the insulation. In the case of the CarbonZero (CZ) rocket type cook stove, the residence time is shorter, possibly a factor of 5, because there is unrestricted air input from the bottom of the stove with consequential considerable excess air, and considerable air entrainment at the top of the cookstove resulting with an exit temperature at the cook pot position of 200-300°C; again it has a flat surface where the hot gases emerge. The temperature at this point is lower than for the Gyapa cookstove, but for rocket-type stoves, the higher exit gas velocity leads to higher conversion efficiency (cf ); But because of the shorter reaction time and the cooler exit temperature this leads to slippage of soot precursors such as acetylene (Williams et al., Citation2012). Evidence for this is provided by the higher acetylene EF for dry oak burning on the CZ stove (263 ± 37 mg/kg) than for the GY stove (149 ± 34 mg/kg). Consequently, the nature of the emissions is significantly different as shown in .
Figure 3. Emissions factors for major pollutants studied (mass of species/kg of dry fuel). Error bars represent MOE. Where error bars are not given only single runs were undertaken.
The Lucia gasifier (LC) operates with partially premixed flames from the gasified pyrolysis products, so the nature of the flame combustion products are different to the diffusion flames in the other two stoves, with different outcomes for the emissions.
Since we chose to examine only the primary combustion processes, we did not use the Boiling Water test which although advantageous for measurements of ‘real world’ efficiency. A cooking pot also presents problems since although the impinging flame enhances heat transfer the reactions may be quenched. Here we focus on undisturbed primary combustion emissions.
Wood stoves typically have higher PM EFs and lower CO EFs compared to charcoal stoves (Still et al., Citation2015). Previous work has shown that, under similar operating conditions, CO emissions are proportional to the carbon content of the fuel whilst PM emissions are approximately proportional to the volatile content (Mitchell et al., Citation2016; Mitchell, Citation2017). We find that traditional and improved cookstoves have similar EFs for most pollutants, when emissions are compared per unit dry fuel consumed. Improved cookstoves often consume less fuel per unit cooking energy delivered meaning that they can deliver lower emissions per unit cooking task whilst the emissions per unit fuel may be similar to traditional stoves (Jetter et al., Citation2012). Compared to the median literature emission factors for burning dry wood in a traditional stove, we estimate that the improved GY and CZ stoves used here reduce emissions of PM, CO and CH4 by 36–54%, 37–52% and 73–85%, respectively. The greatest emissions savings are achieved using the gasifier stove (78% PM, 71% CO and 71% CH4). Switching to the GY charcoal stove also reduces PM emissions by 78% but increases CO by 184% and CH4 by 1.5%. Traditional charcoal stoves may emit up to 15% more PM and consume up to 50% more fuel than improved charcoal stoves (Lask et al., Citation2015; Mamuye et al., Citation2018), but by far the largest PM reductions are achieved by fuel switching from wood to charcoal (Still et al., Citation2015). The wheat straw generally showed similar emissions factors to dry wood, except for higher HCl, SO2 and PN1 EFs. The high burning rate during the flaming phase, high ash content and highest PM toxicity meant the straw had undesirable characteristics for use in improved cookstoves. Moisture content of the wood has an important effect on EFs as shown in . Although there have been relatively few systematic studies of emissions from high moisture content fuel (Price-Allison et al., Citation2019), previous work has shown that wet fuel typically has higher EFs for PM and CO and lower EFs for NOx as well as a lower efficiency, both in traditional and improved stoves (Shen et al., Citation2017, Citation2013a).
The largest increase in emission factors when burning wet fuel compared to dry is the organic fraction; benzene and formaldehyde increased by a factor of 8 and 11, respectively. This is in agreement with previous work (Shen et al., Citation2017, Citation2013a). Emission factors are also increased for CO (2 times) and NH3 (2–4 times), due to smouldering and reduced conversion of C and N species (Chen et al., Citation2010). Very dry fuel (<1% moisture) and very wet fuel (>25% moisture) emit the highest levels of PAH and smoke, with minimum emissions at 10–15% moisture (Huangfu et al., Citation2014). Strong seasonality in emission factors measured from in-field tests may be due to variability in fuel moisture, affecting stove performance and emissions (Coffey et al., Citation2017). Few studies are available which report emission factors for organic compounds and ammonia. The results from this study are in good agreement with those of Bertschi et al. (Citation2003).
The fuel-nitrogen content is a crucial parameter in NOx formation from all stoves with a bed type of combustor (such as GY and CZ stoves studied here) since the contribution from thermal-NOx can only be small because of the low residence times at temperatures high enough for this route to be significant (Price-Allison et al., Citation2019). Typical fuel-nitrogen (wt % dry basis) ranges are 0.17–0.81 for oak, 0.10–1.10 for willow and 0.21–0.66 for charcoal (Phyllis2 database, Citation2018). The high nitrogen content of the oak and willow fuels is due to the high bark content since it contains a higher amount of protein-bound nitrogen (Williams et al., Citation2012). Additionally, higher temperatures may be observed from higher burn rates resulting from smaller fuel particle sizes and dryness (Bhattacharya et al., Citation2002a). Higher fuel moisture content also reduces NOX formation (Bhattacharya et al., Citation2002b) possibly by interfering with the NO formation mechanism and by reducing the combustion temperature.
Gasifiers, such as the LC stove used here, are different because the gasified products burn as partially premixed flames and for such stoves Patel et al. (Citation2016) suggested that the higher flame temperatures observed in improved cookstoves with partially insulating ceramic linings may lead to higher NOX emissions. However, this is not the case with the LC stove studied here (which is not insulated) and where the emissions are similar to the other stoves studied.
It has been found (Dilger et al., Citation2016) that wood smoke particulate matter induced dose dependent DNA damage in the same cell system as used here, A549 lung cells, and that PAH was the major contributor to toxicity. In the present work, the variation in damage induced in A549 cells highlights the variation in toxicity associated with particulate matter derived from different sources. Oanh et al. (Citation1999) found that a wood cookstove releases over 12 times more genotoxic PAH than a charcoal cookstove. PM from a rocket stove and a gasifier stove was found to induce 2.7 times and 5.3 times lower cell stress than a three stone fire, respectively (Hawley and Volckens, Citation2013). In the samples tested here, we report a weak correlation between particle diameter, particle number emission and toxicity. Previous work has also suggested that particle number is most closely connected to lung inflammation (Wittmaack, Citation2007), and there is increasing attention on the role of ultrafine particles (Marabini et al., Citation2017). It should be noted that it has been reported by Shen et al. (Citation2013b) that about 80% of the emitted particle-bound PAH is associated with PM2.5 particles and over 65% associated with PM1.
The particle size distributions observed here suggest a reduction in median diameter for improved charcoal stoves and gasifier stoves. This is consistent with work by Arora et al. (Citation2013), and a reduction in particle size between wood and charcoal was observed by Shen et al. (Citation2017). Previous work found median particle sizes for a three-stone fire, rocket stove and gasifier were 61, 35 and 24 nm, respectively, with a significant increase in emissions of sub-30 nm particles from improved cookstoves (Just et al., Citation2013). Enhanced emission of ultra-fine particles from improved cookstoves may be of concern for health and deserves further attention. The PN1 emission factors reported here (7–16 × 1015 particles/kg) are slightly higher than those reported by Arora et al. (Citation2013) (2 × 10¹² to 11 × 1014/kg) and Shen et al. (Citation2017) (5–9 × 10¹⁵/kg) but the burning rate was higher in this work, and results generally agree with the MCE dependency reported by Janhäll et al. (Citation2010).
In this work, measurements of refractory BC and organic matter allow for more highly resolved analysis than offline measurement of EC/OC on filters by thermal-optical methods as used previously (Arora and Jain, Citation2015). Here, we assume that rBC/[rBC +OM] is analogous to EC/TC to facilitate comparison. The ratio for dry wood in the GY and CZ stoves (0.69–0.81) is higher than the literature average (0.47) but within the large range reported. The ratios are also within the literature range for the gasifier stove and wet wood on the GY and CZ stoves, although there are more limited data for these fuels. There are also limited data available for the EC/TC ratio in PM generated from charcoal burning. The EC/TC ratio is lowest for this fuel because the volatiles have been removed during pyrolysis in the kiln, which are precursors of soot formation. However, the EC/TC ratio is dependent on the degree of pyrolysis and the efficiency of the kilns. Charcoal used in the field may have a higher volatile content than the commercially available fuel used here, which may lead to higher PM emissions. The ignition and volatile combustion phases of charcoal burning only lasted 10–15 minutes but emitted the majority of rBC particles (Figure S5). The average CMD and BC/[BC + OM] ratio during this time were 65 nm and 0.17, reducing to 39 nm and 0.02 for the majority of the test.
Conclusions
Three types of improved cookstoves have been examined which are typical of the many designs available for use in Sub-Saharan Africa. These are a raised grate charcoal stove (Gyapa), a rocket stove (CarbonZero) with dry wood, wet wood and straw, and a gasifier stove with wood pellets (Lucia Worldstove). Reproducible results were derived from laboratory measurements using a firebox method for total emissions capture.
It was found that the charcoal stove emitted up to 4.0 times less PM, 2.5 times less NOX and 2.3 times less formaldehyde than dry wood on the rocket stove. However, emissions of CO, CH4 and C6H6 were up to 6 times higher and the toxicity was slightly higher per milligram of emitted particles.
The comet assay results showed a correlation between genotoxicity and particle size and particle number, which was highest for wheat straw burning. The count median diameter (CMD) of the rocket (dry wood), charcoal and gasifier stoves were 47 , 39 and 14 nm, respectively. Of the stoves that were tested, the gasifier-type emitted the lowest levels of all pollutants and made an effective use of fuel; i.e. the flame was sustained for a longer time with the smallest fuel input. Compared to dry wood, adding wet fuel to the rocket stove reduced flame temperature by up to 200°C, with a corresponding reduction in efficiency of 15.5%. PM and CO emissions increased by a factor of up to 2.3, but the greatest impact of adding wet fuel was on the organic emissions, which increased up to 11 times.
Supplemental Material
Download MS Word (494 KB)Acknowledgments
This work has been funded through an EPSRC Pump Priming Grant for Global Challenge Research (Grant Number 109602). We acknowledge support from the Supergen Bioenergy Hub (EP/J017302) and the EPSRC Doctoral Training Centre in Low Carbon Technologies (EP/G036608). The authors wish to thank Mr A. Price-Allison for his assistance. We also thank the Reviewers for their helpful comments.
Supplementary material
Supplemental data for this article can be accessed here
Additional information
Funding
Related Research Data
References
- Arora, P., and Jain, S. 2015. Estimation of organic and elemental carbon emitted from wood burning in traditional and improvedcd cookstoves using controlled cooking test. Environ. Sci. Technol., 49, 3958–3965. doi:10.1021/es504012v
- Arora, P., Jain, S., and Sachdeva, K. 2013. Physical characterization of particulate matter emitted from wood combustion in improved and traditional cookstoves. Energy Sustain. Dev., 17, 497–503. doi:10.1016/j.esd.2013.06.003
- Atiku, F.A., Mitchell, E.J.S., Lea-Langton, A.R., Jones, J.M., Williams, A., and Bartle, K.D. 2016. The impact of fuel properties on the composition of soot produced by the combustion of residential solid fuels in a domestic stove. Fuel Proc. Technol., 151, 117–125. doi:10.1016/j.fuproc.2016.05.032
- Bailis, R., Drigo, R., Ghilardi, A., and Masera, O. 2015. The carbon footprint of traditional woodfuels. Nature Clim. Change, 5, 266–272. doi:10.1038/nclimate2491
- Bertschi, I.T., Yokelson, R.J., Ward, D.E., Christian, T.J., and Hao, W.M. 2003. Trace gas emissions from the production and use of domestic biofuels in Zambia measured by open-path Fourier transform infrared spectroscopy. J. Geophys. Res., 108(D13), 8469. doi:10.1029/2002JD002158
- Bhattacharya, S.C., Albina, D.O., and Abdul Salam, P. 2002a. Emission factors of wood and charcoal-fired cookstoves. Biomass Bioenergy, 23, 453–469. doi:10.1016/S0961-9534(02)00072-7
- Bhattacharya, S.C., Albina, D.O., and Myint Khaing, A. 2002b. Effects of selected parameters on performance and emission of biomass-fired cookstoves. Biomass Bioenergy, 23, 387–395. doi:10.1016/S0961-9534(02)00062-4
- Carbon Zero. 2018. www.co2balance.com
- Caubel, J.J., Rapp, V.H., Chen, S.S., and Gadgil, A.J. 2018. Optimization of secondary air injection in a wood-burning cookstove: an experimental study. Environ. Sci. Technol., 52, 4449–4456. doi:10.1021/acs.est.7b05277
- Chafe, Z.A., Brauer, M., Klimont, Z., Van Dingenen, R., Mehta, S., Rao, S., Riahi, K., Dentener, F., and Smith, K.R. 2014. Household cooking with solid fuels contributes to ambient PM(2.5). Air pollution and the burden of disease. Environ. Health Persp., 122, 1314–1320. doi:10.1289/ehp.1206340
- Chartier, R., Phillips, M., Mosquin, P., Elledge, M., Bronstein, K., Nandasena, S., Thornburg, V., Thornburg, J., and Rodes, C. 2017. A comparative study of human exposures to household air pollution from commonly used cookstoves in Sri Lanka. Indoor Air, 27, 147–159. doi:10.1111/ina.12281
- Chen, L.W.A., Verburg, P., Shackelford, A., Zhu, D., Susfalk, R., Chow, J.C., and Watson, J.G. 2010. Moisture effects on carbon and nitrogen emission from burning of wildland biomass. Atmos. Chem. Phys., 10, 6617–6625. doi:10.5194/acp-10-6617-2010
- Chung, S.-H., and Violi, A. 2011. Peri-condensed atomatics with aliphatic chains as key intermediates for the nucleaction of aromatic hydrocarbons. Proc. Combus.T Symp., 33, 693–700. doi:10.1016/j.proci.2010.06.038
- Coffey, E.R., Muvandimwe, D., Hagar, Y., Wiedinmyer, C., Kanyomse, E., Piedrahita, R., Dickinson, K.L., Oduro, A., and Hannigan, M.P. 2017. New emission factors and efficiencies from in-field measurements of traditional and improved cookstoves and their potential implications. Environ. Sci. Technol., 51, 12508–12517. doi:10.1021/acs.est.7b02436
- Cohen, A.J., Brauer, M., Burnett, R., Anderson, H.R., Frostad, J., Estep, K., Balakrishnan, K., Brunekreef, B., Dandona, L., Dandona, R., Feigin, V., Freedman, G., Hubbell, B., Jobling, A., Kan, H., Knibbs, L., Liu, Y., Martin, R., Morawska, L., Pope, C.A., Shin, H., Straif, K., Shaddick, G., Thomas, M., Van Dingenen, R., Van Donkelaar, A., Vos, T., Murray, C.J.L., and Forouzanfar, M.H. 2017. Estimates and 25-year trends of the global burden of disease attributable to ambient air pollution: an analysis of data from the global burden of diseases study 2015. The Lancet, 389, 1907–1918. doi:10.1016/S0140-6736(17)30505-6
- Dilger, M., Orasche, J., Zimmermann, R., Paur, H.-R., Diabaté, S., and Weiss, C. 2016. Toxicity of wood smoke particles in human A549 lung epithelial cells: the role of PAHs, soot and zinc. Arch. Of Toxicol., 90, 3029–3044. doi:10.1007/s00204-016-1659-1
- Eilenberg, S.R., Bilsback, K.R., Johnson, M., Kodros, J.K., Lipsky, E.M., Naluwagga, A., Fedak, K.M., et al. 2018. Field measurements of solid-fuel cookstove emissions from uncontrolled cooking in China, Honduras, Uganda, and India. Atmos. Environ., 190, 116–125. doi:10.1016/j.atmosenv.2018.06.041
- Friedl, A., Padouvas, E., Rotter, H., and Varmuza, K. 2005. Prediction of heating values of biomass fuel from elemental composition. Anal. Chim. Acta, 544, 191–198. doi:10.1016/j.aca.2005.01.041
- Global Alliance for Clean Cookstoves (now Clean Cooking Alliance). www.cleancookingalliance.org
- Gyapa Enterprises. 2018. www.gyapa.com
- Hawley, B., and Volckens, J. 2013. Proinflammatory effects of cookstove emissions on human bronchial epithelial cells. Indoor Air, 23, 4–13. doi:10.1111/j.1600-0668.2012.00790.x
- Healey, Lingard, J.J.N., Tomlin, A., Hughes, A., White, K.L.M., Wild, C.P., and Routledge, M.N. 2005. Genotoxicity of size-fractionated samples of urban particulate matter. Environ. Mol. Mutagen., 45, 380–387. doi:10.1002/em.20105
- Huangfu, Y., Li, H., Chen, X., Xue, C., Chen, C., and Liu, G. 2014. Effects of moisture content in fuel on thermal performance and emission of biomass semi-gasified cookstove. Energy Sustain. Dev., 21, 60–65. doi:10.1016/j.esd.2014.05.007
- IEA. 2017. Energy Access Outlook 2017. World Energy Outlook Special Report, International Energy Agency, Paris, France, November.
- ISO, 2018. Clean cookstoves and clean cooking solutions — harmonized laboratory test protocols. Part 1: standard test sequence for emissions and performance, safety and durability. ISO 19867‑ 1:2018.
- Janhäll, S., Andreae, M.O., and Pöschl, U. 2010. Biomass burning aerosol emissions from vegetation fires: particle number and mass emission factors and size distributions. Atmos. Chem. Phys., 10, 1427–1439. doi:10.5194/acp-10-1427-2010
- Jetter, J., Zhao, Y., Smith, K.R., Khan, B., Yelverton, T., Decarlo, P., and Hays, M.D. 2012. Pollutant emissions and energy efficiency under controlled conditions for household biomass cookstoves and implications for metrics useful in setting international test standards. Environ. Sci. Technol., 46, 10827–10834. doi:10.1021/es301693f
- Johansson, L.S., Tullin, C., Leckner, B., and Sj‘Ovall, P. 2003. Particle emissions from biomass combustion in small combustors. Biomass Bioenergy, 25, 435–446. doi:10.1016/S0961-9534(03)00036-9
- Just, B., Rogak, S., and Kandlikar, M. 2013. Characterization of ultrafine particulate matter from traditional and improved biomass cookstoves. Environ. Sci. Technol., 47, 3506–3512. doi:10.1021/es304351p
- Lacey, F.G., Henze, D.K., Lee, C.J., Van Donkelaar, A., and Martin, R.V. 2017. Transient climate and ambient health impacts due to national solid fuel cookstove emissions. Proc. Nat. Acad. Sc. USA, 114, 1269–1274. doi:10.1073/pnas.1612430114
- Lask, K., Booker, K., Han, T., Granderson, J., Yang, N., Ceballos, C., and Gadgil, A. 2015. Performance comparison of charcoal cookstoves for Haiti: laboratory testing with water boiling and controlled cooking tests. Energy Sustain. Devel., 26, 79–86. doi:10.1016/j.esd.2015.02.002
- Lombardi, F., Riva, F., Bonamini, G., Barbieri, J.A., and Colombo, E. 2017. Laboratory protocols for testing of Improved Cooking Stoves (ICSs): A review of state-of-the-art and further developments. Biomass Bioenergy, 98, 321–335. doi:10.1016/j.biombioe.2017.02.005
- Mamuye, F., Lemma, B., and Woldeamanuel, T. 2018. Emissions and fuel use performance of two improved stoves and determinants of their adoption in Dodola, southeastern Ethiopia. Sustain. Environ. Res., 28, 32–38. doi:10.1016/j.serj.2017.09.003
- Marabini, L., Ozgen, S., Turacchi, S., Aminti, S., Arnaboldi, F., Lonati, G., Fermo, P., Corbella, L., Valli, G., Bernardoni, V., Dell’acqua, M., Vecchi, R., Becagli, S., Caruso, D., Corrado, G.L., and Marinovich, M. 2017. Ultrafine particles (UFPs) from domestic wood stoves: genotoxicity in human lung carcinoma A549 cells. Mutat. Res.Genet. Toxicol. Environ. Mutag., 820, 39–46. doi:10.1016/j.mrgentox.2017.06.001
- Mitchell, E.J.S. 2017. Emissions from residential solid fuel combustion and implications for air quality and climate change. PhD Dissertation. University of Leeds, Leeds, UK.
- Mitchell, E.J.S., Lea-Langton, A.R., Jones, J.M., Williams, A., Layden, P., and Johnson, R. 2016. The impact of fuel properties on the emissions from the combustion of biomass and other solid fuels in a fixed bed domestic stove. Fuel Proc.Technol., 142, 115–123. doi:10.1016/j.fuproc.2015.09.031
- Mortimer, K., Ndamala, C.B., Naunje, A.W., Malava, J., Katundu, C., et al. 2017. A cleaner burning biomass-fuelled cookstove intervention to prevent pneumonia in children under 5 years old in rural Malawi (the Cooking and Pneumonia Study): a cluster randomised controlled trial. The Lancet, 389, 167–175. doi:10.1016/S0140-6736(16)32507-7
- Mu, Q., Hondow, N.S., Krzemiński, Ł., Brown, A.P., Jeuken, L.J., and Routledge, M.N. 2012. Mechanism of cellular uptake of genotoxic silica nanoparticles. Part Fibre Toxicol, 9, 29. doi:10.1186/1743-8977-9-29
- Oanh, N.T.K., Bætz Reutergårdh, L., and Dung, N.T. 1999. Emission of polycyclic aromatic hydrocarbons and particulate matter from domestic combustion of selected fuels. Environ. Sci. Technol., 33, 2703–2709. doi:10.1021/es980853f
- Patel, S., Leavey, A., He, S., Fang, J., O’Malley, K., and Biswas, P. 2016. Characterization of gaseous and particulate pollutants from gasification-based improved cookstoves. Energy Sustain. Devel., 32, 130–139. doi:10.1016/j.esd.2016.02.005
- Phyllis2 database. 2018. https://www.ecn.nl/phyllis2
- Price-Allison, A., Lea-Langton, A.R., Mitchell, E.J.S., Gudka, B., Jones, J.M., Mason, P.E., and Williams, A. 2019. Emissions performance of high moisture wood fuels burned in a residential stove. Fuel, 293, 1038–1045.
- Rapp, V.H., Caubel, J.J., Wilson, D.L., and Cadgil, A.J. 2016. Reducing ultrafine particle emissions using air injection in wood-burning cookstoves. Environ. Sci. Technol., 50, 8368–8374.
- Shah, R., and Date, A.W. 2011. Steady-State thermochemical model of a wood-burning cook-stove. Combust. Sci. And Technol., 183, 321–346.
- Shen, G., Gaddam, C.K., Ebersviller, S.M., Vander Wal, R.L., Williams, C., Faircloth, J.W., Jetter, J.J., and Hays, M.D. 2017. A laboratory comparison of emission factors, number size distributions, and morphology of ultrafine particles from 11 different household cookstove-fuel systems. Environ. Sci. Technol., 51, 6522–6532.
- Shen, G., Shu Tao, S., Yuanchen Chen, T., Zhang, Y., Wei, S., Xue, M., Wang, B., et al. 2013b. Emission characteristics for polycyclic aromatic hydrocarbons from solid fuels burned in domestic stoves in rural China. Environ. Sci. Technol., 47, 14485−14494.
- Shen, G., Xue, M., Wei, S., Chen, Y., Zhao, Q., Li, B., Wu, H., and Tao, S. 2013a. Influence of fuel moisture, charge size, feeding rate and air ventilation conditions on the emissions of PM, OC, EC, parent PAHs, and their derivatives from residential wood combustion. J. Environ. Sci., 25, 1808–1816.
- Singh, N.P., McCoy, M.T., Tice, R.R., and Schneider, E.L. 1988. A simple technique for quantification of low-levels of DNA damage in individual cells. Exp. Cell Res., 175, 184–191.
- Still, D., Bentson, S., and Li, H. 2015. Results of laboratory testing of 15 cookstove designs in accordance with the ISO/IWA tiers of performance. EcoHealth, 12, 12–24.
- Symonds, J.P.R. 2010. Calibration of fast response differential mobility spectrometers. Conference on Metrology of Airborne Nanoparticles, Standardisation and Applications (MANSA), National Physical Laboratory, London, UK, June, 2010.
- Ting, Y., Mitchell, E.J.S., Allan, J.D., Liu, D., Spracklen, D.V., Williams, A., Jones, J.M., Lea-Langton, A.R., McFiggans, G., and Coe, H. 2018. Mixing state of carbonaceous aerosols of primary emissions from “improved” African cookstoves. Environ. Sci. Technol., 52, 10134–10143.
- Tryner, J., Tillotson, J.W., Baumgardner, M.E., Mohr, J.T., Defoort, M.W., and Marchese, J. 2016. The effects of air flow rates, secondary air inlet geometry,fuel type, and operating mode on the performance of gasifier cookstoves. Environ. Sci. Technol., 50, 9754–9763.
- Wathore, R., Mortimer, K., and Grieshop, A.P. 2017. In-use emissions and estimated impacts of traditional, natural and forced-draft cookstoves in rural Malawi. Environ.Sci.Technol., 51, 1929–1938.
- Williams, A., Jones, J.M., Ma, L., and Pourkashanian, M. 2012. Pollutants from the combustion of solid biomass fuels. Prog. Energy Combust. Sci., 38, 113–137.
- Wittmaack, K. 2007. In search of the most relevant parameter for quantifying lung inflammatory response to nanoparticle exposure: particle number, surface area, or what? Environ. Health Persp., 115, 187–194.
- WorldStove Corporation. 2018. http://worldstove.com/stoves