
 ?Mathematical formulae have been encoded as MathML and are displayed in this HTML version using MathJax in order to improve their display. Uncheck the box to turn MathJax off. This feature requires Javascript. Click on a formula to zoom.
ABSTRACT
A novel, modified coflow burner was developed to study the effect of charge injection from a non-thermal plasma into three helium-diluted laminar coflow diffusion ethylene flames. The frequency of the high voltage (HV) signal was varied to control the ion concentration (charge) injected into the flames. Optical emission spectroscopy was used to characterize the non-thermal plasma while a bias plate methodology was used to gauge the relative amount of charge generated. For different HV signal frequencies, the laser-induced fluorescence of OH, chemiluminescence of CH*, and laser-induced incandescence of soot in flames were measured. The OH and CH* measurements showed that the flames retained the classic flame shape with charge injection. Significant soot reduction was observed at low HV signal frequencies, corresponding to an increase in charge injection. Notably, at low HV signal frequency, soot reduction in highly concentrated (60%) ethylene flame is three times lower than the less concentrated (32%) ethylene flame. This can be attributed to the decrease in the injected charge to soot precursor concentration ratio when the concentration of ethylene in the flame is increased. These results demonstrate that the current system is a promising candidate for studying the charge effect from non-thermal plasma on soot formation in laminar coflow diffusion flames.
Introduction
The incomplete combustion of fuels results in the production of soot, which has detrimental effects on both the environment (Bond et al. Citation2013) and human health (Fuller et al. Citation2020; Aslam and Roeffaers Citation2022). This has led to increased efforts to control and eliminate these harmful emissions via a better understanding of the formation of soot during combustion. Intriguingly, the formation of soot during combustion was found to be linked to the presence of charged species. This topic has been the subject of extensive research over the last few decades where it has been reviewed thoroughly (Lawton and Weinberg Citation1969; Fialkov Citation1997; Liu and Cai Citation2020; Martin, Salamanca, and Kraft Citation2022).
Teasing apart the role of ions on soot inception has led to advances in burner design and flame chemistry (Giechaskiel et al. Citation2014; Maricq Citation2006; Martin, Salamanca, and Kraft Citation2022). Firstly, Place and Weinberg (Citation1966) realized that ionic wind dominated the effect of an electric field on flame. The ionic wind modified the structure of the diffusion flame, aerating the flame and thereby reducing soot emissions. They developed a counterflow burner design where the electric field was applied perpendicular to the stagnation surface, allowing the electric field to shift but not significantly alter the soot-forming region. This setup has been recently reexamined and demonstrated the role of electric fields on soot inception rates (Liu et al. Citation2021; Park et al. Citation2014). However, the shift in the stagnation surface does lead to some quenching of reactions that makes decoupling the role of the electric field from the ionic wind less conclusive.
Secondly, easily ionizable species and high voltage (HV) arcs were used to increase ion concentrations in flames, which typically has already a significant amount of charge, ca. 104–106 ions/m3 (Calcote, Olson, and Keil Citation1988). This normally involves the injection of metal ions (Burdett and Hayhurst Citation2018; Hayhurst Citation2022; Haynes, Hander, and Wagner Citation1979; Marsh et al. Citation2007; Ritrievi, Longwell, and Sarofim Citation1987) or the introduction of HV arcs (Cha et al. Citation2002) into the flame. However, these approaches were found to alter the chemistry and structure of the flame. For example, metal ions induced the stabilization of small soot nuclei which in turn increase the oxidation rate of smaller particulates with the increase in the available particulate surface area (Howard and Kausch Citation1980). The use of HV arc discharges was also explored by Weinberg (Citation1986), Starikovskiy and Aleksandrov (Citation2013) and Ju and Sun (Citation2015). Nevertheless, several changes can occur simultaneously with plasma discharges. This includes the chemionization by charged particles, gas heating, ionic wind, generation of turbulence by pulsed discharges and radical generation ahead of the flame front (Starikovskiy and Aleksandrov Citation2013; Ju and Sun Citation2015).
Most recently, non-thermal plasmas that allow for decoupling of the electron and ion temperatures have been developed (Lu, Laroussi, and Puech Citation2012). These non-thermal plasmas generate a high concentration of low-temperature ions with low-power consumption (Lu, Laroussi, and Puech Citation2012). Cha et al. (Citation2002) first demonstrated the impact of non-thermal plasma on soot formation using an electrode placed in the center of a coflow diffusion flame. Significant decreases in soot formation were demonstrated. However, the flame structure was significantly perturbed by the plasma discharges. With increased plasma generation, the flame changed shape from near conical to a crown. The electrode also inhibited optical interrogation and built-up soot deposits over time. A more recent work showed similar behavior in the flame structure, with the ionic wind effect from the plasma generation being influential in the change in soot concentration in the flame (Qi et al. Citation2023).
The purpose of this paper is to provide an initial investigation of the impact of the charge on soot formation while minimizing the impact on the flame structure. This is achieved through the use of a novel, modified coflow burner based on the International Sooting Flames ISF-4 coflow 3 burner (Smooke et al. Citation2004, Citation2005), which is described in detail in Section 2.1 of this work. Notably, the charge injection system is based on recent advances in non-thermal plasma jets (Kostov et al. Citation2015), which allow for the separation of charge generation from the flame front. The coflow burner generates flames that have been well-studied experimentally in the literature (Bennett et al. Citation2009; Botero et al. Citation2019; Tan et al. Citation2021a, Citation2021b; De Falco et al. Citation2017; Smooke et al. Citation2004, Citation2005) and this work provides the opportunity to leverage the previous work on soot formation. Furthermore, by using the standardized flame as a base, which has been widely modeled (Bennett et al. Citation2009; Botero et al. Citation2019; Dobbins et al. Citation2022; Eaves et al. Citation2016; Guo et al. Citation2022), this work provides opportunities to further model the standardized flame to understand the effect of charge on soot formation.
Experimental
Laminar coflow diffusion flame
The three base flames are atmospheric-pressure helium-diluted laminar coflow diffusion ethylene flames, generated using a modified coflow burner (Smooke et al. Citation2004, Citation2005), as shown in . Ethylene is used as the base fuel because it is one of the dominant small hydrocarbon species that plays an important role in soot formation in flames (Wang et al. Citation2018). Three base flames with different ethylene concentrations (32%, 40% and 60%) were chosen based on the conditions in Smooke et al. (Citation2005) to facilitate the investigation of the effect of varying soot precursors proportions in a standardized burner system and flame conditions. More importantly, this setup allows for easy integration of existing research coflow burners into charge injected research coflow burners to study soot formation processes in flames.
Figure 1. Schematic of the coflow diffusion flame burner setup. Charge from non-thermal plasma is injected into the flame via a ceramic tube that is concentric to the fuel tube. The diameter measurements (Ø) of the burner, fuel tube and charge injection tube are given in millimetres under the top view version of the burner.
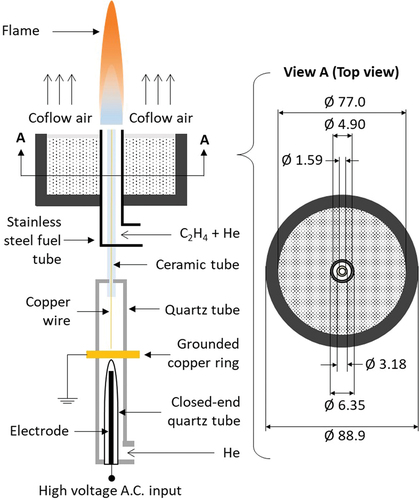
The plasma jets are generated by ionizing helium, which produces a stable plasma (Kostov et al. Citation2015; Brandi et al. Citation2020). Also, helium is the smallest inert gas available, which can emulate a charge most effectively and have minimal chemical effects on the flame. Hence, in the current work, excited helium ions were specifically injected as a charge and helium was used as a diluent to the ethylene flame to study the effect of varying concentrations of excited helium ions on the soot volume fraction of the flames. Additionally, the diluent gas and the charge are both from helium to minimize the number of reactive species in the flame.
The stainless-steel fuel tube has an inner diameter of 4.90 mm and an outer diameter of 6.35 mm. A 3.18 mm OMEGATITETM 450 ceramic tube (Omega Engineering Inc.) with an inner diameter of 1.59 mm is placed concentrically within the fuel tube to deliver charge into the flame. The gas flow rates (reference temperature at 273 K) are reported in . The ethylene fuel, helium and air flow rates were controlled by Bronkhorst EL-FLOWⓇ mass flow controllers. The mass flow controllers were calibrated with a Gilbrator-2 Wet Cell Calibrator. The overall cold gas velocity for the fuel and air was maintained at 35 cm/s. The ethylene and helium were supplied from 99.99% purity cylinders. The coflow air (95 slm) was supplied through a concentric coflow tube with an inner diameter of 74.0 mm, fitted with a stainless-steel honeycomb mesh (0.43 mm wall thickness, 18 × 18 mesh). The resulting flames were lifted above the fuel tube by about 2 mm.
Table 1. Gas flow rates(sccm)of helium-diluted ethylene flames.
Non-thermal plasma generation
The design of the non-thermal plasma generator is based on the plasma jet generator reported by Kostov et al. Citation(2015). The non-thermal plasma is generated from dielectric barrier discharge which operates at low current, i.e., there is very little energy dissipated. The plasma is designed to be “cold” and has been widely reported to be at room temperature (Kostov et al. Citation2015; Horvatic, Vadla, and Franzke Citation2014; Yousfi et al. Citation2014).
The non-thermal plasma generator consists of two main components: Minipuls4 (GBS Elektronik GmbH) and PicoScopeⓇ 2205A oscilloscope (PicoⓇ Technology Ltd.). A high voltage (HV) alternating current (AC) is generated from the Minipuls4 which requires two main inputs. The first input is the 24 V direct current from a 230 V AC power source, which is converted to HV AC with the transformer cascade. The second input is the control current with ±5 V to switch the Minipuls4 on and off, in which the signal is provided from the PicoScopeⓇ 2205A oscilloscope. Additionally, the voltage-current characterization of the plasma generated as a function of time is performed using the same PicoScopeⓇ 2205A oscilloscope via the PicoScopeⓇ 6 PC Oscilloscope (Version 6.14) software. A detailed description of the HV signal generation and operation of the non-thermal plasma generator is given in Section SM1 of the Supplementary material. The HV signal is connected to a copper electrode that is enclosed in the inner closed-ended part of a concentric quartz tube, as shown in . The inner part of the tube acts as a dielectric barrier between the electrode and helium flowing through the outer part of the tube. The helium is ionized by the HV signal (at frequencies of 22-25 kHz) and flows from the quartz tube to the burner. The ion concentration was controlled by altering the HV frequency at 22–25 kHz.
The ion concentration of the charge injected from the non-thermal plasma was measured using an established methodology (Guo et al. Citation2003) that provides a convenient method to measure ions in a burner. The schematic of the ion concentration measurements setup is illustrated in Figure SM2.2 of the Supplementary material. It infers the concentration of ions by measuring the current produced by the flow of ions. A power supply unit (CHUXⓇ, 100 V, 3 A) is used to apply a potential difference between a measurement plate and the burner. A digital multimeter (Keithley, Model 2000) is used to measure the current between the electrodes. Due to the low number of ions produced at 40 sccm, it was necessary to use higher flow rates of helium (400 sccm) when measuring the ion concentration compared to the experiments reported in the main text. On the assumption that the flow rate of helium is related to the number of ionized species, the concentration at a lower helium flow rate (40 sccm) is expected to be lower than the case at 400 sccm helium flow rate (Höft, Becker, and Kettlitz Citation2016). Notably, the naming convention for the case without any charge injection (i.e., no HV and at the frequency of 0 kHz) is “No HV.”
Optical emission spectroscopy and chemiluminescence
The emission spectra of the plasma generated were recorded using an Andor Kymera 328i spectrometer (Oxford Instruments) in the range 440–960 nm at 40 sccm of helium for the non-thermal plasma without the ignited flame. The spectrometer was calibrated by using an Ar-Hg light source with known peaks. Spatial calibration was also performed by setting the grating as a mirror at its zero position. The measurements were performed perpendicular to the axis of the charge delivery ceramic tube.
The excited-state CH radicals (A2∆, denoted as CH*) of the flames were measured using an intensified charge-coupled device camera from LaVision, coupled with narrow-bandpass filters (420, 430 and 440 nm with FWHM: 10 nm). The data were processed to give two-dimensional radial distributions using the two-filter subtraction procedure (Karnani and Dunn-Rankin Citation2013; Liu et al. Citation2020) followed by an inverse Abel transform (Dribinski et al. Citation2002; Gibson et al. Citation2021; Guo et al. Citation2022). The two-filter subtraction procedure is used to obtain CH* chemiluminescence profiles that are soot-free as the procedure can filter the contribution of continuum radiation from soot in the CH* band (Karnani and Dunn-Rankin Citation2013). The observed standard error was 10–15%.
Laser measurements
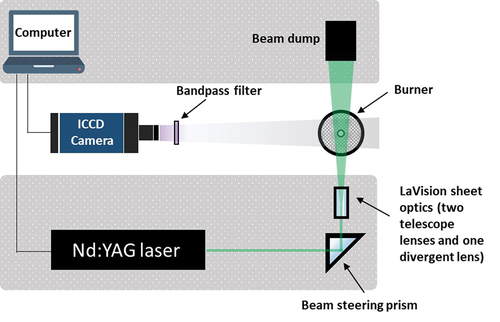
An Nd:YAG laser (Quantel Q-smart, Pulse width: 5 ns, Repetition rate: 10 Hz) at 532 nm was used to perform laser-induced incandescence (LII) measurements of the soot volume fraction (fv) in the flames, as shown in . The LII signal is collected normal to the laser beam using the camera setup. The measurement of LII is based on previous work from Smooke et al. (Citation2005). The laser beam is initially turned 90° by a beam steering prism. Then, it is transformed into a vertical planar laser sheet with a narrow cross-sectional area of 40 mm by 0.5 mm and focused across the centerline of the burner using LaVision sheet optics (two telescope lenses and one divergent lens). The laser fluence was monitored and recorded with an energy meter (CoherentⓇ FieldMaxII-TOPTM) before the setup of the LaVision sheet optics. The LII was calibrated by the extinction method using a 550 nm CW laser from LaVision. The refractive-index function for absorption E(m) is estimated as 0.2462. A laser fluence of 0.18 J/cm2 was used to ensure that the signal was in the saturation regime (Smooke et al. Citation2005).
Figure 2. Schematic of the laser system setup for laser-induced incandescence (LII) measurements.
A bandpass filter (LaVision GmbH, Center wavelength: 405 nm, Bandwidth: 70 nm) was used before the intensified charge-coupled device (ICCD) camera (LaVision GmbH, Imager SX 4M, 12-bit, 2360 × 1776 pixels). A broad bandpass filter is used to reduce the interferences from the C2 emission fluence (Smooke et al. Citation2005). The resultant pixel resolution is 8 px/mm. The camera is accurately controlled and synchronized with the laser using DaVis software (LaVision GmbH, Version 8.1) to record the images. A short camera gate of 50 ns was set to avoid overestimation of the signal from large particles, and to discriminate polycyclic aromatic hydrocarbon (PAH) signal and scattering light (Smooke et al. Citation2005). The camera delay is set to 80 ns, which is determined by obtaining the plot of signal intensity against the camera delay to maximize the signal-to-noise ratio. Additionally, the camera delay time is within the range that can avoid the interference signal from larger particles (Smooke et al. Citation2005). The flame images were extracted and stored by a digital frame grabber, and 150 images were used for each measurement. The standard error of the fv measurements was found to be ± 10%. It is computed from the standard deviation of the measured intensity from all the images taken for each case.
Laser-induced fluorescence (LIF) measurements of OH in flames were performed using the same system as illustrated in , with an additional dye laser (Quantel Q-scan, Sirah PrecisionScan, Rhodamine 590 dye). The dye laser is pumped by the same Nd:YAG laser at 532 nm, with the beam passing through the dye cell and doubling crystal to obtain the laser with 283.25 nm. The laser provides 10.8 mJ/pulse in the ultraviolet (UV) regime which was used to obtain the distribution of OH in the flames (Mulla et al. Citation2021). The method to focus the laser beam to the centerline of the burner and the method to measure the laser fluence have been detailed in the LII section. The OH-PLIF signal was collected normal to the laser beam using the intensified CCD camera. A LaVision UV lens (f: 85 mm, F: 2.8) and a bandpass filter (LaVision, VZ-image Filter LIF for OH, 308 nm; FWHM = 10 nm; and transmissivity >60%) were fitted before the ICCD camera to obtain clear OH-PLIF signals without scattering of laser light from the dye laser. The camera gate was set to 100 ns and delay to 30 ns for the best signal intensity. The camera gate delay of 30 ns is an optimized value for the current setup. Tests have been conducted with the minimum delay for the current camera at 5 ns which did not compromise the measured OH distribution. The OH-PLIF measurements were found to have a standard error of 10–15% obtained by estimating the statistical variation of the 150 flame images collected for each measurement.
Results and discussion
Characterization of non-thermal plasma
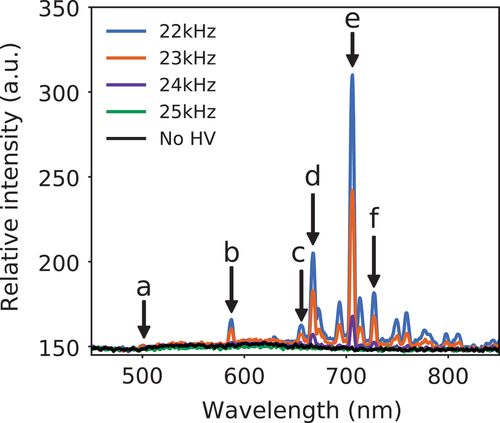
shows the optical emission spectra of the electronically excited gas-phase helium (He I) without charge injection (i.e., no HV) and with charge injection with HV frequencies of 22, 23, 24 and 25 kHz. There is a clear and high intensity peak at 706.1 nm (shown as peak “e” in ), which is characteristic of the He I. Notably, the intensity of the peak decreases with the increase in the HV frequency from 22 to 25 kHz (Kostov et al. Citation2015; Guo et al. Citation2022; Xu et al. Citation2021). The amount of He I generated decreases with the increase in the HV frequency in this range. As per the results presented in , the intensity at peak “e” exhibits a significant decrease when the HV frequency is increased from 22 to 23 kHz. This results in a reduction to about three-fifths of the intensity at 22 kHz, which corresponds to a 42% reduction. A further decrease of 46% is observed when the HV frequency is increased to 24 kHz, resulting in an intensity of merely one-tenth of that 22 kHz. At 25 kHz, the intensity approaches negligible levels.
Figure 3. Emission spectra of non-thermal helium plasma at no HV and different HV frequencies. Peaks a–f: He I. The color version of the figure is available in the online version of this paper.
shows the waveforms of the applied voltage and the corresponding discharge current as a function of time at different HV signal frequencies. The amplitude of the voltage and current signal decreases as the frequency increases. The discharge power is correlated to the amplitude of the voltage and current waveforms (Kostov et al. Citation2015; Xu et al. Citation2021). There is a decrease in the amplitude (and discharge power) per cycle as the frequency increases because the plasma generator has a fixed amount of discharge power in a fixed time period. It is therefore expected that the increase in the HV frequency would result in fewer helium atoms being electronically excited. This is consistent with the findings from .
Figure 4. The waveforms of the (a) applied voltage and (b) discharge current recorded in a time interval.
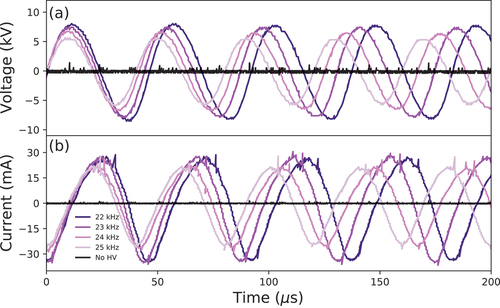
The waveform of the discharge current lags the applied voltage by 90°, i.e., the current discharge starts to occur only at the peak of the applied voltage. The mechanism responsible for this is described in detail in the literature (Kostov et al. Citation2015). A brief explanation is that, when the applied voltage is positive and reaches a threshold for gas ionization, the electrode will become an anode. This will result in a cathode-directed streamer discharge maintained by photoionization (Karakas, Akman, and Laroussi Citation2012; Kostov et al. Citation2015). Electrons will propagate from the cathode to the anode, resulting in a positive current. When the polarity of the voltage is negative, the electrode becomes a cathode, resulting in an anode-directed streamer maintained by secondary electron avalanches (Karakas et al., Citation2012; Kostov et al. Citation2015). The electron movement is reversed, resulting in a negative current. Additionally, the peaks of the waveform form for the discharge current show some irregularities. This is typical of plasma discharge (Kostov et al. Citation2015a; Zheng et al. Citation2020).
Effect of charge from non-thermal plasma on flame structure
The effect of injecting charge from non-thermal plasma on the flame structure was analyzed using the OH and CH* distributions, both of which provide a reasonable visual representation of the structure and position of a flame (Cao et al. Citation2018; Liu et al. Citation2020; Tang et al. Citation2021). One of the challenges of studying the effect of charge from non-thermal plasma on soot formation in laminar flames is that the non-thermal plasma can induce significant changes in the shape of the flame (Cha et al. Citation2002). In the current study, it was observed that all the flames maintained the same well-defined laminar flame structure, i.e. a blue flame sheet and a dim blue hollow interior in the lower part of the flame, and luminous closed-tip yellow tongue (attributed to soot) at the upper part of the flame (Cao et al. Citation2018) independent of the injection of charge – see Figure SM3.3 of the Supplementary material. From the figure, without the plasma jet, the flame is lifted above the fuel tube by about 2 mm. With the addition of the plasma jet, it does not have a significant impact on the flame liftoff height. This is an important advantage of this charge injection burner design because the changes in soot fraction may otherwise be related to changes in liftoff height and oxygen infiltration.
shows the OH-PLIF signals. The OH region can reasonably represent the soot oxidation zone (Ahn et al. Citation2021; Cha et al. Citation2002; Glassman Citation1998; Kaiser and Frank Citation2009) and acts as a marker for the upper part of the flame (Ahn et al. Citation2021). In flames, the production of OH typically occurs via (Dixon-Lewis Citation1991; Eckart et al. Citation2021; Reuter and Ombrello Citation2022),
Figure 5. OH-PLIF profiles of the (a) 32%, (b) 40% and (c) 60% ethylene flames without charge injection (No HV) and with charge injection at different HV frequencies. The flames are axisymmetric and only the right hand side of the flames are shown to ease comparison of the flames. The HV frequency is indicated at the top of each image. The intensities of the OH have been normalized by their respective maximum values.
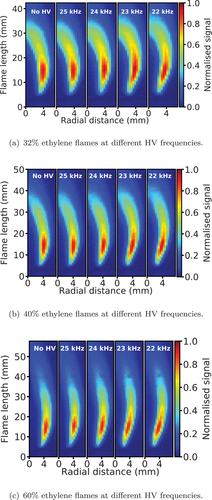
and to a lesser extent through (Dixon-Lewis Citation1991),
It was observed that the OH was distributed in the outer region of all the flames, consistent with the shape of typical laminar coflow diffusion flames.
Notwithstanding that the general shape of the laminar flame is preserved, the details of the flame geometry differ with the HV frequency. Notably, the flames with higher charge injection at lower frequencies (i.e. 22 kHz and 23 kHz) bulge in the mid-part of the flame and have an elongated arch, causing an increase in the flame diameter. The intensity of the OH-PLIF signal increases yet occupies a narrower region of the flame. Generally, the OH distribution is considered to be a good indicator of the region of high-temperature oxidation (Schmidt and Ganguly Citation2013). This may indicate that the flames with high charge concentration show a slight enhancement in oxidation.
shows the CH* distribution in the lower part of the flames (i.e., the flame anchoring region), close to the fuel tube. CH* is a significant indicator of the lower part of the flame front (typically indicated by a blue flame sheet) and a marker of the completion of fuel degradation (Liu et al. Citation2018; Walsh et al. Citation1998). Only the lower part of the flames is shown because only this region has a strong CH* signal. The proximity to the point of charge injection means that this region is of particular interest in the current study. In the current flames, the CH* region extends close to the fuel tube and forms a thin flame front downstream of the flame. This indicates that the flames remain intact despite the presence of the charge, complementing the findings of which focused on the downstream region.
Figure 6. The CH* chemiluminescence profiles of the (a) 32%, (b) 40% and (c) 60% ethylene flames without charge injection (No HV) and with charge injection at different HV frequencies. The flames are axisymmetric and only the right hand side of the flames are shown to ease comparison of the flames. The frequency is indicated at the top of each image. The intensities of the CH* have been normalized by their respective maximum values.
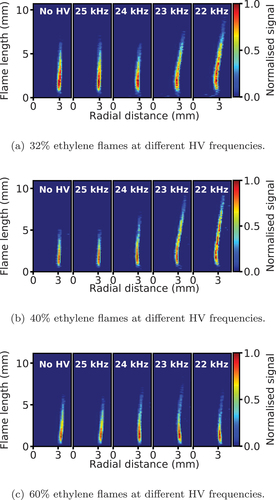
A detailed examination of the CH* distribution in shows that the charge has some effect on the upstream region of the flames. In the flames without charge injection (no HV), the maximum CH* signal intensity is observed in a relatively compact area. The 32% ethylene flame has a wider signal region than the 40% and 60% flames, consistent with the smaller “blue” region observed in more sooty (60% ethylene) flames. In the flames with higher charge injection at 22 and 23 kHz HV frequencies, the signal curves toward the centerline and shows an increased area with normalized CH* intensity, accompanied by a decrease in the value of the maximum intensity (see Figure SM4.4 of the Supplementary material). In quantitative terms, the maximum intensity decreased by 19% from the case without charge injection (No HV) to the case with the highest charge injection (HV frequency of 22 kHz) for the 32% ethylene flame. The curvature of the signal toward the centerline and the area of high normalized CH* intensity decreased as the HV frequency was further increased to 24 and 25 kHz, accompanied by an increase in the value of the maximum intensity. By 25 kHz, the CH* distribution and maximum signal intensity had reverted to be similar to that observed in the (No HV) flame without charge injection. Similar behavior was observed for the 40% and 60% ethylene flames.
Effect of charge on soot formation
shows the spatial distribution of the soot volume fraction, fv, obtained from LII measurements for the 32%, 40% and 60% ethylene flames. For the cases without charge injection (0 kHz), the increase in the concentration of ethylene showed a transition of the peak soot volume fraction from the centerline of the flame to the wings of the flame. This is consistent with the observation in the literature where nitrogen was used as the fuel diluent (Smooke et al. Citation2004, Citation2005). The transition is due to the change in the rate of soot inception and surface growth at the flame centerline versus the flame wings, which has been detailed in the literature (Smooke et al. Citation2004, Citation2005).
Figure 7. Soot volume fraction, fv, in the (a) 32%, (b) 40% and (c) 60% ethylene flames without charge injection (No HV) and with charge injection at different HV frequencies. The HV frequency is indicated at the top of each image.
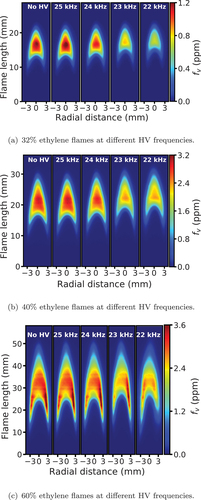
The 32% ethylene flame has a maximum centerline soot volume fraction of 1.2 ppm at 0 kHz, which is within the expected range (ca. 1.4 ppm) of soot volume fractions measured for helium-diluted ethylene flames using color-ratio pyrometry (Kailasanathan et al. Citation2014). The maximum soot volume fraction at the centerline was observed to drop with the decrease in the HV frequency from 25 to 22 kHz, i.e., the soot volume fraction decreases as the ions concentration increases. At 22 kHz, the maximum soot volume fraction at the centerline has already decreased to 0.7 ppm. This is attributed to the increased amount of ionized helium injected into the flame as the HV frequency decreased from 25 to 22 kHz. Notably, both the 40% and 60% diluted ethylene flames showed similar but reduced trends with the change in HV frequency.
Additionally, it is observed that there is no shift in the area of soot volume fraction with the change in the HV frequency toward the fuel tube. This is in contrast with coflow burner experiments where an electric field was applied to the burner as reported previously (Xiong, Cha, and Chung Citation2015). The literature reports that in the case of an electric field applied to the fuel tube of a coflow burner (fueled with propane), increasing the voltage resulted in significant shifts of the PAH zone, and hence the soot volume fraction zone, toward the fuel tube. This observation indicated a change in flow or temperature fields due to the electric fields (Xiong, Cha, and Chung Citation2015). The absence of such phenomenon observed in the current work may likely stem from the differences in the current experimental setup and conditions with Xiong, Cha, and Chung (Citation2015), which requires further investigation.
(left axis) shows the normalized maximum soot volume fraction in the flames versus HV frequency. The normalization is based on the corresponding (0 kHz) flame without charge injection for each ethylene flow rate. Meanwhile, (right axis) shows the relative ion concentration measured versus HV frequency. The error bars are representative of the standard error from six repetitions for each of the measurements. The normalization employed in this study is calculated on the HV frequency at 22 kHz, which corresponds to the highest ion concentration utilized in the current investigation. This frequency is assigned a relative ion concentration of 1.0. The ion concentration at HV frequencies of 23, 24, and 25 kHz represents 91%, 78%, and 54% of the ion concentration observed at the HV frequency of 22 kHz, respectively.
Figure 8. Left axis: Normalized maximum soot volume fraction (fv) versus HV frequency for the He-diluted 32%, 40% and 60% ethylene flames. The normalization is based on the maximum soot volume fraction observed in each flames without charge injection. The lines are drawn to guide the eye. Right axis: Relative ion concentration of the charge injection. The error bars show the standard error for each of the measurements.
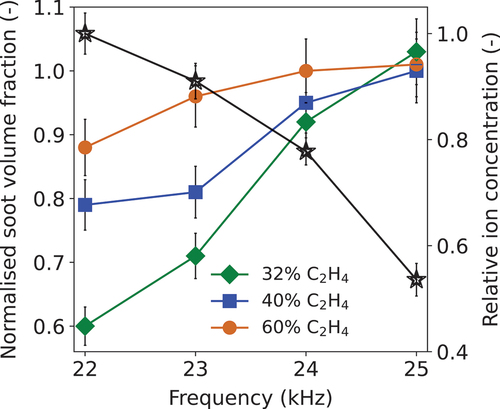
From the current work, the reduction in the soot volume fraction at a given ion concentration (HV frequency) decreases as the proportion of ethylene increases. For example, at high ion concentration (HV frequency = 22 kHz), the reduction in soot volume fraction in the 32% ethylene flame is more than three times that for the 60% ethylene flame.
On the other hand, the reduction in soot volume fraction was found to decrease as the ion concentration was decreased. Specifically, at an HV frequency of 22 kHz (for 32% ethylene flame), the soot volume fraction decreased by 40%, relative to the 32% ethylene flame without charge injection. When the ion concentration was decreased by 9% (at 23 kHz) from the HV frequency of 22 kHz, the soot volume fraction increased by 11% compared to the 22 kHz case. A further 22% decrease in the ion concentration (at 24 kHz) led to a 32% increase in the soot volume fraction compared to the 22 kHz case. At 25 kHz (which corresponds to a 46% reduction in ion concentration from the 22 kHz case), the effect on soot volume fraction was negligible. These results suggest that the reduction in soot volume fraction is influenced by the ion concentration of the charge injection.
Several insights into the effect of charge on soot formation can be inferred from . At an HV frequency of 25 kHz, the ion concentration is too low to have a discernible effect on soot reduction in the ethylene flames studied. When the HV frequency is progressively reduced to 22 kHz, an increasing concentration of ions is injected into the flames. This is more pronounced in the 32% ethylene flames compared to the 40% and 60% ethylene flames. This is attributed to an increase in the concentration of soot precursors when the proportion of ethylene is increased. Since the charge injection (ion concentration) was kept constant (at a given frequency) for all flames, the relative concentration of ions to soot precursors decreases as the ethylene is increased from 32% to 40% and then to 60%.
The charge generated from the non-thermal plasma in the current experiments could form He+ and He* (electronically excited He). These species can consequently undergo rapid conversion into relatively stable helium dimer ions (He2+) (Brandi et al. Citation2020)
The helium dimer ion (He2+), being positively charged, may impact the formation of soot. This ion, as well as the excited species in the plasma, could influence soot through multiple routes:
An ionic wind (Cha et al. Citation2002).
Alter the fuel breakdown (pyrolysis) (Eliasson and Kogelschatz Citation1991; Lefkowitz et al. Citation2015).
Increased oxidation (Ju and Sun Citation2015; Qi et al. Citation2023).
Inhibit the PAH formation (Cha et al. Citation2002).
Disrupt the primary particle aggregation (second mode) (Fialkov Citation1997).
Modify the particle inception through ion-induced nucleation (first mode) (Bowal et al. Citation2019; Martin et al. Citation2018, Citation2019).
The minimal change in the flame front shape and position from the OH and soot volume fraction profiles, with the subtle change in the CH* at the upstream of the flame, suggests that the impact of an ionic wind is thought to be minimal in the current study. In the case where the ionic wind effect is significant and led to soot being formed closer to the fuel tube, as shown in the literature (Xiong, Cha, and Chung Citation2015), the effect of the ionic wind was also observable in the soot volume fraction distribution, which is absent in the current work. Additionally, the removal of the plasma-forming electrode in the current experimental setup can prevent significant changes to the flame structure (Cha et al. Citation2002; Qi et al. Citation2023).
The fuel breakdown could also be impacted by the plasma or He2+ present. Lefkowitz et al. (Citation2015) found that ethylene passed through a non-equilibrium nanosecond pulsed argon plasma and was degraded into acetylene. The formation of larger hydrocarbons was also found. This would suggest early activation of ethylene would form more soot. However, we see a reduction of soot formation along the centerline of the flame suggesting this pathway is unlikely. This follows from the design of our burner where the fuel is not passed through the plasma but only interacts via diffusion with the charged plume.
Most studies on plasma-enhanced combustion suggest the most significant role of plasma in combustion is enhancing oxidation and oxidation-induced fuel breakdown (Ju and Sun Citation2015). This is indeed seen in the increased combustion intensity indicated by the increased OH and CH* concentrations. This may suggest that soot could be more easily combusted at the edges of the flame, however, it does not explain the reduction in soot intensity along the centerline of the flame where little oxygen is found.
The formation of aromatic species may also be impacted by plasma injection. However, PAH formation is known to be radical driven and not strongly dependent on ionic reactions as shown from mass spectrometry studies by Weilmünster, Keller, and Homann (Citation1999) and theoretical calculations that showed that the interaction between charged PAH and acetylene is not significant at flame temperatures (Wang, Weiner, and Frenklach Citation1993). While we cannot rule out changes in pyrolysis and PAH formation, it seems unlikely as most mechanisms would suggest an enhancement instead of an inhibitory effect.
Charge attachment to soot may also affect the formation of soot by reducing the coagulation efficiency of soot as an excess of positive charge increases the repulsion between soot primary particles (Haynes, Jander, and Wagner Citation1979; Lawton and Weinberg Citation1969; Martin, Salamanca, and Kraft Citation2022). This is observable from the soot volume fraction profiles in . The start of “soot” formed is shifted to more downstream (higher position) of the flame with increasing charge injection. Additionally, in , the area of the OH profiles increase with increased charge injection, indicating a possible increase in the oxidation process. This is consistent with the proposal by Howard and Kausch (Citation1980) and Bonczyk (Citation1991), where the injection of ions can affect the number of primary particles, depending on the types of the ions and combustion system. In the case where there is a fuel-rich condition, small particles persisted in the flame, which increases the overall small soot particles (Howard and Kausch Citation1980). The increase in the number of smaller-sized soot particles or primary particles increases the total surface area for reactions to occur with the particles. Particularly, the higher surface area can encourage more oxidation to occur when compared to larger soot particles which have a lower surface area. This, along with the charge attachment to soot can result in the reduction of the formation of large soot aggregates with charge injection.
Particle inception is also suggested to be impacted by charge injection through electrostatic interactions. The clustering behavior of curved PAHs has been shown to be altered by cations when investigated using molecular dynamics from 500 to 1500 K (Bowal et al. Citation2019). Other chemical mechanisms are required to provide thermally stable soot particles (Martin, Salamanca, and Kraft Citation2022) but charged species are suggested to nucleate more incipient nanoparticles. Recent modeling of DC electric field counterflow burner experiments by Liu et al. (Citation2021) found the impact of the charge on inception could not be ignored in understanding the reduction in soot formation even when considering the reduced coagulation rate. Therefore, we propose that the observed reduction in the soot volume fraction with charge injection in the current study is due to the modification of particle inception, coupled with the disruption to the primary particle aggregation.
While the interplay of these contributions on the formation of soot is still a subject of ongoing research, the proposed burner design that is based on a standardized burner system has successfully achieved its objective of providing a laminar coflow diffusion flame with charge injection and minimal changes to the flame structure. Furthermore, this work has provided a basic understanding of the changes in the soot volume fraction in flames due to charge injection. The promising results from this work allow for the use of this flame as a new target flame for future studies on the impact of charge on soot formation and destruction.
Conclusions
A coflow burner has been modified to study the effect of injecting charge from non-thermal plasma on soot formation in laminar coflow diffusion flames. Charged helium was generated using a plasma excitation system operating with high voltage (HV) frequencies from 22 to 25 kHz. The concentration of charged helium was observed to decrease as the frequency increased from 22 to 25 kHz.
The charged helium was injected through a coaxial concentric fuel tube arrangement into helium-diluted 32%, 40% and 60% ethylene flames. The soot volume fraction and OH distribution in the flames were measured using laser-induced incandescence and laser-induced fluorescence, respectively. The chemiluminescence of the CH* distribution was measured using an intensified charge-coupled device camera. The data were analyzed to investigate the impact of the charge on the soot volume fraction in the flames.
The OH and CH* profiles were analyzed versus the HV frequency used to generate the charge. Both reveal that the flames injected with the charged helium retained their classic laminar flame shape, indicating that the burner achieves its objective of minimizing disruption to the flame, so facilitating the study of the effect of charge on soot formation.
The soot volume fraction was analyzed versus the HV frequency. The soot reduction was most pronounced when the 32% ethylene flame was injected with a higher charge generated at 22 kHz. The level of reduction decreased as both the HV frequency and proportion of ethylene were increased. The increase in HV frequency reduced the ion concentration injected into the flames, while the increase in the proportion of ethylene increases the soot precursor concentration, such that a decrease in the soot reduction is consistent with a decrease in the ratio of the ion to soot precursor concentration.
The preservation of the overall laminar flame shape and the observed reduction in the soot volume fraction suggests that the current system is a good candidate to study the impact of the charge on the formation of soot in laminar coflow diffusion flames. The novel burner modification with non-thermal plasma being incorporated enabled the effective minimization of the strong impact of ionic wind on soot formation, which has not been previously observed in the literature. Additionally, we were able to reveal that the charge injected into the flame influenced the soot formation through electrostatic interactions at the particle inception and aggregation stage. Therefore, this system can be a potential target flame for further investigation on the complex interaction between charged species and the formation of soot via high-resolution transmission electron microscopy and differential-mobility sizing. Notably, with improvements to the charge generator, the current HV frequency range used could be expanded to investigate the effect of charge injection at higher ion concentrations on soot formation in flame. With sufficient data on this topic, then the modeling community will be able to utilize them for further modeling investigations on this topic.
Supplemental Material
Download PDF (654 KB)Acknowledgements
This research was supported by the National Research Foundation, Prime Minister’s Office, Singapore under its Campus for Research Excellence and Technological Enterprise (CREATE) programme. Y. R. Tan acknowledges financial support from Fitzwilliam College Cambridge, Trinity College Cambridge and the Cambridge Trust. M. Kraft gratefully acknowledges the support of the Alexander von Humboldt Foundation. M. Salamanca is grateful with Universidad Nacional de Colombia-Sede Medellín for its support. The authors thank Dr Taniela Lolohea from the School of Chemical Sciences, Auckland University of Technology for advice concerning non-thermal plasma; and Prof. Allan N. Hayhurst from the Department of Chemical Engineering and Biotechnology, University of Cambridge for advice about ion measurements in flames. For the purpose of open access, the author has applied a Creative Commons Attribution (CC BY) license to any Author Accepted Manuscript version .
Disclosure statement
No potential conflict of interest was reported by the authors.
Supplemental data
Supplemental data for this article can be accessed online at https://doi.org/10.1080/00102202.2023.2206521.
Additional information
Funding
References
- Ahn, M., D. Lim, T. Kim, and Y. Yoon. 2021. Pinch-off process of Burke–Schumann flame under acoustic excitation. Combust. Flame 231 (1):111478. doi:10.1016/j.combustflame.2021.111478.
- Aslam, I., and M. B. J. Roeffaers. 2022. Carbonaceous nanoparticle air pollution: Toxicity And detection in biological samples. Nanomaterials 12 (22):3948. doi:10.3390/nano12223948.
- Bennett, B. A. V., C. S. McEnally, L. D. Pfefferle, M. D. Smooke, and M. B. Colket. 2009. Computational and experimental study of the effects of adding dimethyl ether and ethanol to nonpremixed ethylene/air flames. Combust. Flame 156 (6):1289–302. doi:10.1016/j.combustflame.2009.01.020.
- Bonczyk, P. 1991. Effects of metal additives on soot precursors and particulates in a C2H4/O2/N2/Ar premixed flame. Fuel 70 (12):1403–11. doi:10.1016/0016-2361(91)90006-V.
- Bond, T. C., S. J. Doherty, D. W. Fahey, P. M. Forster, T. Berntsen, B. J. DeAngelo, M. G. Flanner, S. Ghan, B. Kärcher, D. Koch, et al. 2020. Bounding the role of black carbon in the climate system: A scientific assessment. J. Geophys. 118 (11):5380–552. doi:10.1002/jgrd.50171.
- Botero, M. L., N. Eaves, J. A. H. Dreyer, Y. Sheng, J. Akroyd, W. Yang, and M. Kraft. 2019. Experimental and numerical study of the evolution of soot primary particles in a diffusion flame. Proc Combust Inst 37 (2):2047–55. doi:10.1016/j.proci.2018.06.185.
- Bowal, K., J. W. Martin, A. J. Misquitta, and M. Kraft. 2019 5. Ion-induced soot nucleation using a new potential for curved aromatics. Combust. Sci. Technol. 191 (5–6):747–65. doi:10.1080/00102202.2019.1565496.
- Brandi, F., L. Labate, D. Rapagnani, R. Buompanea, A. di Leva, L. Gialanella, and L. A. Gizzi. 2020. Optical and spectroscopic study of a supersonic flowing helium plasma: Energy transport in the afterglow. Sci Rep 10 (1):5087. doi:10.1038/s41598-020-61988-y.
- Burdett, N. A., and A. N. Hayhurst. 2018. Kinetic and thermodynamic measurements of the reactions of the positive ions, Mn+ and MnOH+, formed by adding manganese to fuel-rich flames of either H2 + O2 or C2H2 + O2. Combust. Flame 189 (1):315–24. doi:10.1016/j.combustflame.2017.10.022.
- Calcote, H. F., D. B. Olson, and D. G. Keil. 1988. Are ions important in soot formation? Energy Fuels 2 (4):494-–504. doi:10.1021/ef00010a016.
- Cao, S., M. Bin, D. Giassi, B. A. V. Bennett, M. B. Long, and M. D. Smooke. 2018. Effects of pressure and fuel dilution on coflow laminar methane–air diffusion flames: A computational and experimental study. Combust. Theory Model. 22 (2):316–37. doi:10.1080/13647830.2017.1403051.
- Cha, M. S., S. Lee, K. Kim, and S.H. Chung. 2002. Soot suppression by nonthermal plasma in coflow jet diffusion flames using a dielectric barrier discharge. Combust. Flame 141 (4):438–47. doi:10.1016/j.combustflame.2005.02.002.
- De Falco, G., M. Commodo, A. D’Anna, and P. Minutolo. 2017. The evolution of soot particles in premixed and diffusion flames by thermophoretic particle densitometry. Proc Combust Inst 36 (1):763–70. doi:10.1016/j.proci.2016.07.108.
- Dobbins, R. R., J. Tinjero, J. Squeo, X. Zhao, R. J. Hall, M. B. Colket, M. B. Long, and M. D. Smooke. 2022. A combined experimental and computational study of soot formation in normal and microgravity conditions. Combust. Sci. Technol. 1–26. doi:10.1080/00102202.2022.2041621.
- Dribinski, V., A. Ossadtchi, V. A. Mandelshtam, and H. Reisler. 2002. Reconstruction of abel-transformable images: The gaussian basis-set expansion abel transform method. Rev Sci Instrum 73 (7):2634–42. doi:10.1063/1.1482156.
- Eaves, N. A. , Q. Zhang, F. Liu, H. Guo, and S. B. Dworkin. 2016. CoFlame: A refined and validated numerical algorithm for modeling sooting laminar coflow diffusion flames. Comput. Phys. Commun 207 (1):464–77. doi:10.1016/j.cpc.2016.06.016.
- Eckart, S., Y. Chunkan, U. Maas, and H. Krause. 2021. Experimental and numerical investigations on extinction strain rates in non-premixed counterflow methane and propane flames in an oxygen reduced environment. Fuel 298:120781. doi:10.1016/j.fuel.2021.120781.
- Eliasson, B. and U. Kogelschatz. 1991. Nonequilibrium volume plasma chemical processing. IEEE Transactions on Plasma Science. 19 (6):1063–1077. doi:10.1109/27.125031.
- Fialkov, A. B. 1997. Investigations on ions in flames. Prog. Energ. Combust. Sci. 23 (5–6):399–528. doi:10.1016/S0360-1285(97)00016-6.
- Fuller, R., P. J. Landrigan, K. Balakrishnan, G. Bathan, S. Bose-O’Reilly, M. Brauer, J. Caravanos, T. Chiles, A. Cohen, L. Corra, et al. 2020. Pollution and health: A progress update. Lancet Planet. Health 6 (6):535–47. doi:10.1016/S2542-5196(22)00090-0.
- Gibson, S., D. D. Hickstein, R. Yurchak, M. Ryazanov, D. Das, and G. Shih. 2021. PyAbel/PyAbel: v0.8.4. Apr. doi:10.5281/zenodo.4690660.
- Giechaskiel, B., M. Maricq, L. Ntziachristos, C. Dardiotis, X. Wang, H. Axmann, A. Bergmann, and W. Schindler. 2014. Review of motor vehicle particulate emissions sampling and measurement: From smoke and filter mass to particle number. J Aerosol Sci 67 (1):48–86. doi:10.1016/j.jaerosci.2013.09.003.
- Glassman, I. 1998. Sooting laminar diffusion flames: Effect of dilution, additives, pressure, and microgravity. Symp. (Int.) Combust. 27 (1):1589–96. doi:10.1016/S0082-0784(98)80568-7.
- Graham, D.L. 1991. Structure of laminar flames. Symp. (Int.) Combust. 23 (1):305–24. doi:10.1016/S0082-0784(06)80274-2.
- Guo, J., J. M. Goodings, A. N. Hayhurst, and S. G. Taylor. 2003. A simple method for measuring positive ion concentrations in flames and the calibration of a nebulizer/atomizer. Combust. Flame 133 (3):335–43. doi:10.1016/S0010-2180(03)00020-8.
- Hayhurst, A. N. 2022. Mass spectrometric sampling of flames: How ionic equilibria in flames produce sampling falsifications and “fake” ions, but provide kinetic and thermodynamic data on the reaction occurring. Prog. Energy Combust. Sci. 88 (1):100927. doi:10.1016/j.pecs.2021.100927.
- Haynes, B. S., H. K. Jander, and H. G. Wagner. 1979. The effect of metal additives on the formation of soot in premixed flames. Symp. (Int.) Combust. 17 (1):1365–74. doi:10.1016/S0082-0784(79)80128-9.
- Höft, H., M. M. Becker, and M. Kettlitz. 2016. Impact of gas flow rate on breakdown of filamentary dielectric barrier discharges. Phys Plasmas 23 (3):033504. doi:10.1063/1.4943278.
- Horvatic, V., C. Vadla, and J. Franzke. 2014. Discussion of fundamental processes in dielectric barrier discharges used for soft ionization. Spectrochim. Acta B 100 (1):52–61. doi:10.1016/j.sab.2014.08.010.
- Howard, J. B., and W. J. Kausch. 1980. Soot control by fuel additives. Prog. Energy Combust. Sci. 6 (3):263–76. doi:10.1016/0360-1285(80)90018-0.
- Guo, J., P. Liu, E. Quadarella, K. Yalamanchi, I. Alsheikh, C. Chu, F. Liu, Sarathy, S. M., W. L. Roberts , and H. G. Im. 2022. Assessment of physical soot inception model in normal and inverse laminar diffusion flames. Combust. Flame 246:112420. doi:10.1016/j.combustflame.2022.112420.
- Ju, Y., and W. Sun. 2015. Plasma assisted combustion: Dynamics and chemistry. Prog. Energy Combust. Sci. 48 (1):21–83. doi:10.1016/j.pecs.2014.12.002.
- Kailasanathan, R. K. A., J. Zhang, T. Fang, and W. L. Roberts. 2014. Effects of diluents on soot surface temperature and volume fraction in diluted ethylene diffusion flames at pressure. Combust. Sci. Technol. 186 (6):815–28. doi:10.1080/00102202.2013.878710.
- Kaiser, S. A., and J. H. Frank. 2009. Spatial scales of extinction and dissipation in the near field of non-premixed turbulent jet flames. Proc Combust Inst 32 (2):1639–46. doi:10.1016/j.proci.2008.05.082.
- Karakas, E., M. A. Akman, and M. Laroussi. 2012. The evolution of atmospheric-pressure low-temperature plasma jets: Jet current measurements. Plasma Sources Sci. Technol. 21 (3):10. doi:10.1088/0963-0252/21/3/034016.
- Karnani, S., and D. Dunn-Rankin. 2013. Visualizing CH* chemiluminescence in sooting flames. Combust. Flame 160 (10):2275–78. doi:10.1016/j.combustflame.2013.05.002.
- Kostov, K. G., T. M. C. Nishime, M. Machida, A. C. Borges, V. Prysiazhnyi, and C. Y. Koga-Ito. 2015. Study of cold atmospheric plasma jet at the end of flexible plastic tube for microbial decontamination. Plasma Processes Polym 12 (12):1383–1391. doi:10.1002/ppap.201500125.
- Lawton, J., and F. Weinberg. 1969. Electrical aspects of combustion. Clarendon Press, Oxford.
- Lefkowitz, J. K., M. Uddi, B. C. Windom, G. Lou, and Y. Ju. 2015. In situ species diagnostics and kinetic study of plasma activated ethylene dissociation and oxidation in a low temperature flow reactor. Proc Combust Inst 35 (3):3505–12. doi:10.1016/j.proci.2014.08.001.
- Liu, H., and W. Cai. 2020. Recent progress in electric-field assisted combustion: A brief review. Front. Energy 18 (1):58–73.
- Liu, F., Y. Hua, W. Han, and C.F. Lee. 2018. Effect of toluene addition on the PAH formation in laminar coflow diffusion flames of n-heptane and isooctane. Energy Fuels 32 (6):7142–52. doi:10.1021/acs.energyfuels.8b00745.
- Liu, A., K. H. Luo, S. Rigopoulos, and W. Jones. 2021. Effects of the electric field on soot formation in combustion: A coupled charged particle PBE-CFD framework. Combust. Flame 239 (1):111796. doi:10.1016/j.combustflame.2021.111796.
- Liu, Y., J. Tan, M. Wan, L. Zhang, and X. Yao. 2020. Quantitative measurement of OH* and CH* Chemiluminescence in jet diffusion flames. ACS. Omega 5 (26):15922–30. doi:10.1021/acsomega.0c01093.
- Lu, X., M. Laroussi, and V. Puech. 2012. On atmospheric-pressure nonequilibrium plasma jets and plasma bullets. Plasma Sources Sci. Technol. 21 (3):034005. doi:10.1088/0963-0252/21/3/034005.
- Marsh, N. D., I. Preciado, E. G. Eddings, A. F. Sarofim, A. B. Palotas, and J. D. Robertson. 2007. Evaluation of organometallic fuel additives for soot Suppression. Combust. Sci. Technol. 179 (5):987–1001. doi:10.1080/00102200600862497.
- Maricq, M. M. 2006. A comparison of soot size and charge distributions from ethane, ethylene, acetylene, and benzene/ethylene premixed flames. Combust. Flame 144 (4):730–43. doi:10.1016/j.combustflame.2005.09.007.
- Martin, J. W., M. Botero, R. I. Slavchov, K. Bowal, J. Akroyd, S. Mosbach, and M. Kraft. 2018. Flexoelectricity and the formation of carbon nanoparticles in flames. J. Phys. Chem. C 122 (38):22210–15. doi:10.1021/acs.jpcc.8b08264.
- Martin, J. W., K. L. Bowal, A. Menon, R. I. Slavchov, J. Akroyd, S. Mosbach, and M. Kraft. 2019. Polar curved polycyclic aromatic hydrocarbons in soot formation. Proc Combust Inst 37 (1):1117–23. doi:10.1016/j.proci.2018.05.046.
- Martin, J. W., M. Salamanca, and M. Kraft. 2022. Soot inception: Carbonaceous nanoparticle formation in flames. Prog. Energy Combust. Sci. 88 (1):100956. doi:10.1016/j.pecs.2021.100956.
- Mulla, I. A., P. Desgroux, B. Lecordier, and A. Cessou. 2021. Comprehensive characterization of sooting butane jet flames, Part 1: Soot, soot-precursor, and reaction zone. Combust. Flame 233 (1):111595. 2021. doi:10.1016/j.combustflame.2021.111595.
- Park, D. G., B. C. Choi, M. S. Cha, and S. H. Chung. 2014. Soot reduction under DC electric fields in counterflow non-premixed laminar ethylene flames. Combust. Sci. Technol. 186 (4–5):644–56. doi:10.1080/00102202.2014.883794.
- Place, E. R., and F. J. Weinberg. 1966. Electrical control of flame carbon. Proc. Math. Phys. Eng. Sci. 289 (1):192–205.
- Qi, D., Y. Ying, D. Mei, T. Xin, and D. Liu. 2023. Soot characteristics from diffusion flames coupled with plasma. Fuek 332:126126. doi:10.1016/j.fuel.2022.126126.
- Reuter, C. B., and T. M. Ombrello. 2022. Numerical simulations of ozone addition to strained flames. Combust. Sci. Technol. 194 (15):3225–45. doi:10.1080/00102202.2021.1923703.
- Ritrievi, K. E., J. P. Longwell, and A. F. Sarofim. 1987. The effects of ferrocene addition on soot particle inception and growth in premixed ethylene flames. Combust. Flame 70 (1):17–31. doi:10.1016/0010-2180(87)90156-8.
- Schmidt, J., and B. Ganguly. 2013. Effect of pulsed, sub-breakdown applied electric field on propane/air flame through simultaneous OH/acetone PLIF. Combust. Flame 160 (12):2820–26. doi:10.1016/j.combustflame.2013.06.031.
- Smooke, M. D., R. J. Hall, M. B. Colket, J. Fielding, M. B. Long, C. S. McEnally, and L. D. Pfefferle. 2004. Investigation of the transition from lightly sooting towards heavily sooting co-flow ethylene diffusion flames. Combust. Theory Model. 8 (3):593–606. doi:10.1088/1364-7830/8/3/009.
- Smooke, M. D., M. B. Long, B. C. Connelly, M. B. Colket, and R. J. Hall. 2005. Soot formation in laminar diffusion flames. Combust. Flame 143 (4):613–28. doi:10.1016/j.combustflame.2005.08.028.
- Starikovskiy, A., and N. Aleksandrov. 2013. Plasma-assisted ignition and combustion. Prog. Energy Combust. Sci. 39 (1):61–110. doi:10.1016/j.pecs.2012.05.003.
- Tang, Y., J. Sun, B. Shi, S. Li, and Q. Yao. 2021. Extension of flammability and stability limits of swirling premixed flames by AC powered gliding arc discharges. Combust. Flame 231 (1):111483. doi:10.1016/j.combustflame.2021.111483.
- Tan, Y. R., M. Salamanca, J. Bai, J. Akroyd, and M. Kraft. 2021. Structural effects of C3 oxygenated fuels on soot formation in ethylene coflow diffusion flames. Combust. Flame 232:111512. doi:10.1016/j.combustflame.2021.111512.
- Tan, Y. R., M. Salamanca, L. Pascazio, J. Akroyd, and M. Kraft. 2021. The effect of poly(oxymethylene) dimethyl ethers (PODE3) on soot formation in ethylene/PODE3 laminar coflow diffusion flames. Fuel 283:118769. doi:10.1016/j.fuel.2020.118769.
- Walsh, K. T., Long, M. B., M. A. Tanoff, and M. D. Smooke. 1998. Experimental and computational study of CH, CH*, and OH* in an axisymmetric laminar diffusion flame. Symp. (Int.) Combust. 27 (1):615–23. doi:10.1016/S0082-0784(98)80453-0.
- Wang, H., X. Rui, K. Wang, C. T. Bowman, R. K. Hanson, D. F. Davidson, K. Brezinsky, and F. N. Egolfopoulos. 2018. A physics-based approach to modeling real-fuel combustion chemistry - I. Evidence from experiments, and thermodynamic, chemical kinetic and statistical considerations. Combust. Flame 193:502–19. doi:10.1016/j.combustflame.2018.03.019.
- Wang, H., B. Weiner, and M. Frenklach. 1993. Theoretical study of reaction between phenylvinyleum ion and acetylene. J Phys Chem 97 (40):10364–71. doi:10.1021/j100142a017.
- Weilmünster, P., A. Keller, and K.-H. Homann. 1999. Large molecules, radicals, ions, and small soot particles in fuel-rich hydrocarbon flames: Part I: Positive ions of polycyclic aromatic hydrocarbons (PAH) in low-pressure premixed flames of acetylene and oxygen. Combust. Flame 116 (1–2):62–83. doi:10.1016/S0010-2180(98)00049-2.
- Weinberg, F. J. 1986. “Advanced combustion methods.” Tech Report: Imperial College of Science and Technology, London.
- Xiong, Y., M. S. Cha, and S. H. Chung. 2015. AC electric field induced vortex in laminar coflow diffusion flames. Proc Combust Inst 35 (3):3513–20. doi:10.1016/j.proci.2014.08.027.
- Xu, G., Y. Geng, X. Li, X. Shi, and G. Zhang. 2021. Characteristics of a kHz helium atmospheric pressure plasma jet interacting with two kinds of targets. Plasma Sci. Technol. 23 (9):95401. doi:10.1088/2058-6272/ac071a.
- Yousfi, M., N. Merbahi, A. Pathak and, and O. Eichwald. 2014. Low temperature plasmas at atmospheric pressure: Toward new pharmaceutical treatments in medicine. Fundam. Clin. Pharmacol 28 (2):123–35. doi:10.1111/fcp.12018.
- Zheng, Z., W. Nie, S. Zhou, Y. Tian, Y. Zhu, T. Shi, and Y. Tong. 2020. Characterization of the effects of a plasma injector driven by AC dielectric barrier discharge on ethylene-air diffusion flame structure. Open Phys. 18 (1):58–73. doi:10.1515/phys-2020-0008.