
abstract
There is increasing interest in the drivers of industrial diversification, and how these depend on economic and industry structures. This article contributes to this line of inquiry by analyzing the role of industry relatedness in explaining variations in industry diversification, measured as the entry of new industry specializations, across 173 European regions during the period 2004–2012. First, we show that there are significant differences across regions in Europe in terms of industrial diversification. Second, we provide robust evidence showing that the probability that a new industry specialization develops in a region is positively associated with the new industry’s relatedness to the region’s current industries. Third, a novel finding is that the influence of relatedness on the probability of new industrial specializations depends on innovation capacity of a region. We find that relatedness is a more important driver of diversification in regions with a weaker innovation capacity. The effect of relatedness appears to decrease monotonically as the innovation capacity of a regional economy increases. This is consistent with the argument that high innovation capacity allows an economy to break from its past and to develop, for the economy, truly new industry specializations. We infer from this that innovation capacity is a critical factor for economic resilience and diversification capacity.
History shows that all economies—at the level of countries, regions, as well as cities—are inevitably confronted with activities (firms, industries) that face stagnation and decline. The decline of car manufacturing in Detroit is a strong reminder of the potentially devastating consequences associated with a decline of an economy’s principal economic specialization. There is therefore constant pressure to develop new economic specializations. This has led to a search for factors that stimulate processes of industrial diversification, because diversification is seen as an important way in which the industrial base of an economy is renewed and broadened.
The bulk of the literature on diversification has focused on the subnational scale, in particular at the level of cities and regions. One reason for this is that issues associated with diversification and potential consequences of closure of plants or decline of industries are more pronounced at the subnational level. Local economies, such as cities or regions, are, for example, often more specialized than whole countries. Therefore, they are more dependent on one or a few industries, firms, or activities. There are also significant differences in industrial diversification even between regions and cities that operate under similar national institutional conditions. This has led to a general interest in the role that local economic and industrial structures play in fostering (or hampering) industrial diversification.
One recent insight from this line of research is that industries are more likely to enter and develop in a region when they are related to preexisting industries in that region (e.g., Neffke, Henning, and Boschma Citation2011). Similarly, new technologies are more likely to occur in regions with an already established presence of related technologies (e.g., Kogler, Rigby, and Tucker Citation2013; Rigby Citation2015). This article links up to this literature and presents a study on the relationship between the probability of developing new industrial specializations and industry relatedness using data on 173 European regions over an eight-year period (2004–2012). The specific aim is to test whether industry relatedness is an important driving force behind industrial diversification across regions in Europe.
A key argument of the literature on relatedness and diversification is that related activities demand similar capabilities or resources, broadly defined (Boschma Citation2017). Put simply, new industries that are related to a region’s current stock of industries are more likely to emerge, because relatedness implies that entrepreneurs can draw on existing regional capabilities. Industries represent structures that facilitate and stimulate the development and accumulation of knowledge, technology, and know-how, for example, embodied in workers, which are pertinent to a range of related industries. The link between industry relatedness and emergence of new industries is then clear: (1) new industries need local availability of pertinent knowledge and know-how to develop; and (2) local availability of pertinent knowledge and know-how are likely to be greater in locations with a presence of related industries. This line of argument associates with Hidalgo’s (Citation2015) idea of an interdependence between local industries and local knowledge and know-how. He argues that “knowledge and knowhow need the presence of industries as much as industries need the presence of knowledge and knowhow” (ibid., 142). Based on this reasoning, the pattern of industry diversification in regions is expected be path-dependent and evolve according to underlying structures of industry relatedness.
While there is increasing empirical evidence showing that new activities that emerge in a region indeed tend to be related to the region’s existing industry base (Hidalgo et al. Citation2007; Neffke, Henning, and Boschma Citation2011), there is still little systematic understanding of when and under what conditions industry relatedness matters (Boschma Citation2017). For example, are local economies with higher innovation capacity in a better position to diversify into, for the region, more radically new industries? Do they have more of a tendency to diversify in more unrelated activities, that is, are they in a better position to break from their past? Is the capacity of diversification related to the density or centrality of a local economy? There is an increasing number of case studies on new path creation in single regions (see, e.g., Isaksen Citation2015), but no studies yet exist that compare the intensity and type of diversification in different types of regions simultaneously. This article addresses these gaps in the literature by undertaking a systematic quantitative analysis of how the relationship between industry relatedness and new industry specializations varies across different types of regions.
A main novelty is that we test whether the influence of industry relatedness on diversification differs across regions with different economic and industrial structures. To this end, we distinguish between (1) core knowledge regions, (2) manufacturing regions, and (3) peripheral regions in the European Union. This categorization is aimed at reflecting overall innovation capacity in broad terms. It allows us to analyze whether the influence that relatedness has on the entry of new industry specializations differs across different categories of regions.
The motivation for focusing on these regional indicators is that they reflect basic economic and industrial structures that are likely to influence the extent to which new industry specializations are related to a region’s stock of industries. Our baseline assumption is that relatedness is a less important driver of diversification in regions with stronger innovation capacity and more developed overall knowledge resources such as large core regions. It is well established in the literature that large core regions tend to host significant research and development (R&D) activities, and are also more geared toward entrepreneurialism in knowledge-intensive and innovation activities (e.g., Duranton and Puga Citation2001, Citation2005). Recent studies that focus on worker skills also show that larger cities and core regions are not only more intensive in, but also more rewarding for, skills associated with innovation activities such as cognitive skills related to problem solving and creativity (Bacolod, Blum, and Strange Citation2009; Andersson, Klaesson, and Larsson Citation2014). Against this backdrop, core regions with a higher density of knowledge-intensive activities are likely to be in a better position to develop, for the region, truly new industries and to break from their past industry structure.
Conceptually, such a link can be motivated on the grounds that the knowledge-intensity and general innovation capacity of local economies are related to the scope of a recombination of ideas and of a discovery of new areas of application of knowledge and technology. Just as Schumpeter (Citation1934) points out that entrepreneurship is fundamentally about the carrying out of new combinations, idea-based models of economic growth often model production of new ideas as a function of reconfigurations of old (or existing) ideas (Weitzman Citation1998). Since knowledge- and R&D-intensive local economies are more likely to produce a greater number of ideas and expand their knowledge base, it means that the potential for reconfigurations is greater. That is, as the stock of ideas expands through R&D and knowledge investments, so does the potential for new configurations. In turn, an increase in the scope of reconfigurations increases the likelihood that local entrepreneurs and established firms will recombine existing ideas in such ways that new industry specializations emerge that are less related to a region’s current industry base. Another perspective is that local economies with stronger innovation capacity provide better conditions for firms and entrepreneurs to discover new areas of application of existing knowledge and technology. Such processes of discovery could in turn increase the likelihood of new industry specializations that are unrelated to the existing industry base. This correlates with the argument that certain knowledge and technology are in themselves less tied to a specific industry domain (Montresor and Quatraro Citation2017).Footnote1 Core regions with stronger knowledge resources could then be claimed to be in a better position to develop generic knowledge and technology that can be applied in many different industrial contexts. This potential, matched with entrepreneurialism among new, as well as established, local entrepreneurs could then be expected to lead to a higher probability of new industry specializations that show a lower degree of relatedness to a region’s current industry base.
In summary, there are several arguments in favor of the idea that industry relatedness between new industry specializations and existing industries is important but also that relatedness may be of less importance in regions with stronger knowledge resources and innovation capacity. This article is an empirical contribution in which we test the empirical relevance of these arguments by analyzing whether the effect of relatedness on industry diversification, measured as new industry specializations, varies across different types of regions.
The main findings of our study on 173 European regions are as follows: First, we document significant variations across regions in Europe in terms of industrial diversification processes. Second, relatedness appears to be an important determinant of the probability that a new industrial specialization develops in a local economy. Third, the effect of relatedness does indeed vary across regions in a systematic way. We find evidence that the effect of relatedness on diversification decreases monotonically as the innovation capacity of a region increases. The relatedness between new industry specializations and the existing stock of industries is weakest in the core knowledge regions of Europe. We interpret this as that high innovation capacity put local economies in a better position to break from their past and to develop truly new industry specializations that are less related to their current industry structures. Local innovation capacity is, from this perspective, an important determinant for regional resilience and regional diversification potential. Fourth, looking at the role of relatedness across industries, we find that relatedness is a more important driver of regional industry diversification among high-tech and knowledge-intensive industries than it is in less knowledge-intensive activities.
The article is structured as follows. The next section describes briefly the current state of affairs in the regional diversification literature. This is followed by a section that introduces the data and methodology, The penultimate section presents the main findings on diversification of European regions, and the final section concludes.
Toward a Territory-specific Treatment of Industrial Diversification
In the aftermath of the economic crisis, there are increasing calls for a better understanding of the process of industrial diversification. As economies can be hit severely by sudden or slow-burning shocks, there is a constant pressure on countries and regions to develop new economic activities that absorb redundant capital and labor and create new job opportunities. There is a rapidly expanding literature that focuses explicit attention on country- and region-specific capabilities that are considered a key source of industrial diversification (Hidalgo et al. Citation2007; Neffke, Henning, and Boschma Citation2011; Rigby Citation2015). What this literature shows is that territory-specific capabilities provide opportunities to develop new industries but also set limits to this process of structural change. If a city or region does not possess the capabilities required for a new specific activity, it is almost impossible to develop it.
The literature has applied the notion of capabilities both conceptually and empirically in its relatedness concept (Breschi, Lissoni, and Malerba Citation2003; Boschma Citation2017). Its main claim is that economies are more likely to diversify into new activities that are related to existing activities because those activities can draw on and exploit their underlying capabilities. As such, diversification processes in local economies are depicted as an emergent branching process (Frenken and Boschma Citation2007) in which new activities build on and combine related local activities (Martin and Sunley Citation2006; Fornahl and Guenther Citation2010).
There has been a recent upsurge of studies that have confirmed the predominance of related diversification. In particular, these studies tend to focus on regions and show that industries are more likely to enter and more likely to survive in a region when related to existing industries in that region (see, e.g., Neffke, Henning, and Boschma Citation2011; Boschma, Minondo, and Navarro Citation2013; Essletzbichler Citation2015; Cortinovis et al. Citation2017; He, Yan, and Rigby, Citationforthcoming). The same is true for new technologies that are more likely to occur in regions when related technologies are locally present (e.g., Kogler, Rigby, and Tucker Citation2013; Colombelli, Krafft, and Quatraro Citation2014; Heimeriks and Boschma Citation2014; Van Den Berge and Weterings Citation2014; Boschma, Balland, and Kogler Citation2015; Feldman, Kogler, and Rigby Citation2015; Rigby Citation2015; Tanner Citation2016; Montresor and Quatraro Citation2017; Balland et al., Citationforthcoming). In other words, related diversification is a dominant pattern in many regions. This is not unexpected, as new capabilities required for related diversification are easier to acquire and less costly when being close to existing local capabilities (Saviotti and Frenken Citation2008). For instance, it is easier for regions to diversify into trucks when specialized already in motor bikes, as both industries build on the same engineering capability base. Unrelated diversification is often described as a more exceptional event, since it may require new capabilities that are accompanied by fundamental uncertainty and high costs. For instance, it is extremely complex to diversify into pharmaceuticals when specialized in aerospace, since both activities are not related: the distance between their underlying capability bases is large (Neffke et al. Citation2018).
So, what these studies show is that relatedness is a key driver behind industrial diversification, but this finding is typically an average effect across many different regions. What these studies also tell is that relatedness is not a necessary condition for successful diversification, as diversification in industries that are unrelated to regions’ current industry base also takes place. This makes the question whether relatedness is a driving force in every region relevant (Boschma Citation2017). Some studies have identified notable differences between regions because their institutions differ. For instance, Cortinovis et al. (Citation2017) find that bridging social capital (as opposed to bonding social capital) in regions is an enabling factor for regional diversification in the European Union, especially where formal institutions in regions are weak.
Isaksen and Trippl (Citation2016) link conceptually three types of regional innovation systems (RIS), after Tödtling and Trippl (Citation2005), to the question whether regions are more likely to develop new growth paths and, if so, whether regions focus on new path creation versus path renewal. Broadly speaking, new path creation reflects the unrelated diversification type, while path renewal can be associated with the related type of diversification. They expect that new path creation and path renewal are more typical patterns in organizationally thick and diversified RIS, because such regions offer a rich and diverse environment. Organizationally thick and specialized RIS are dominated by highly specialized industrial and institutional structures and inward-looking networks, as is common in many old industrial regions. This type of RIS is perceived to have a weak capacity to develop new growth paths, and therefore more likely to rely on existing activities and path extension. Regions with organizationally thin RIS have a weak absorptive capacity, little local knowledge exchange, and closed social networks that tend to lead to conformity. These regions are more likely to experience path extension and, worse, path exhaustion, due to negative lock-in. In sum, Isaksen and Trippl (Citation2016) expect both related and unrelated diversification to take place only in the first type of RIS, while the two other types of RIS are unlikely to experience diversification because of path lock-in.
So, little attention has yet been given to the intensity and nature of diversification in regions with different economic and industrial structures (Boschma Citation2017). What characteristics of local economies stimulate diversification? Do centrality and innovation capacity fuel a local economy’s capacity to diversify in new industries? Do the same characteristics facilitate more genuine renewal, for example, by developing industry specializations in unrelated activities? There are a number of case studies in single regions (see, e.g., Isaksen Citation2015), but no studies yet exist that compare the intensity and type of diversification between different types of regions. Using data on regions in Europe, we explore in this article the role that economic and industrial characteristics of local economies (regions) play in explaining and stimulating processes of industrial diversification, related as well as unrelated diversification. In particular, we focus on the urban-peripheral nature of regions and their innovation capacity, and make a distinction between core knowledge regions, manufacturing regions, and peripheral regions. As stated previously, a link between innovation capacity, and unrelated diversification can be motivated on the grounds that the knowledge-intensity and general innovation capacity of local economies are related to the scope of recombinations of ideas and of discovery of new areas of application of knowledge and technology.
Data and Methodology
Data
To measure relatedness and industrial diversification, we use employment data from the Orbis database collected by Bureau Van Dijk. The Orbis database contains unique annual firm-level statistics, such as employment, industrial affiliation, and location, covering about ten million firms across Europe. After a substantial cleansing and geocoding process, the original data were aggregated into 260 European NUTS2 regions and 615 4-digit NACE sectors (version 2) for the period 2004–2012.Footnote2 We dropped some countries that are most affected by the problem of missing values in employment or some small countries with only one NUTS2 (2010 classification) level region.Footnote3 The final data set contains 173 NUTS2 regions in 12 countries, including Belgium, Bulgaria, Germany, Denmark, Spain, France, Greece, Italy, the Netherlands, Poland, Portugal, and Romania.Footnote4 According to the geographic grouping by the UN Statistics Division, we formally distinguish these countries among western European countries (Belgium, Germany, France, and the Netherlands), eastern European countries (Bulgaria, Poland, and Romania), one northern European country (Denmark), and southern European countries (Spain, Greece, Italy, and Portugal). As our data only contain one country in northern Europe, we combine western and northern European countries in one country group.
We aim to explore whether the urban-peripheral nature of regions and their innovation capacity have an impact on regional diversification. To this end, we use the Organization for Economic Cooperation and Development (OECD) categorization of regions by Marsan and Maguire (Citation2011) that employs a cluster analysis of regions based on not only innovation-related but also sociodemographic and economic variables. This typology provides a holistic assessment of multiple dimensions of regional characteristics. We use this categorization of regions to distinguish regions with different levels of innovation capacity and simultaneously account for sociodemographic and economic differences among regions. The full list of variables used in the analysis by Marsan and Maguire (ibid., 12–13) includes the following: gross domestic product (GDP) per capita, population density, unemployment rate, percentage of the labor force with tertiary education, gross domestic expenditure on R&D as share of GDP, business R&D expenditure as a share of total R&D expenditure, patent cooperation treaty patent applications per million inhabitants, share of employment in the primary sector, share of employment in the public sector, share of employment in manufacturing, high- and medium-high technology manufacturing as a percent of total manufacturing, and knowledge-intensive services as a percentage of total services.
Following this approach, we divide the regions in our data set into seven groupsFootnote5 that are further summarized into three macrocategories: knowledge hubs, industrial production zones, and non–S&T-driven (science and technology) regions. In order to focus on the industrial diversification process of regions with high innovation capacity, the category of knowledge hubs are further distinguished between two peer groups: knowledge-intensive city/capital districts and knowledge and technology hubs. displays the maps by region category. Moreover, we report the number of regions by country group or region category/group, respectively, in . Note that there are only 156 regions in our data set matched with the typology by Marsan and Maguire (Citation2011). The nonmatched regions are grouped into other regions. Among the 156 matched regions, about 15 percent of them are knowledge hubs, 50 percent industrial production zones, and 35 percent non–S&T-driven regions.
Table 1 The Number of Regions by Country Group or Region Category/Group
Figure 1. Map for European regions by region category or group.
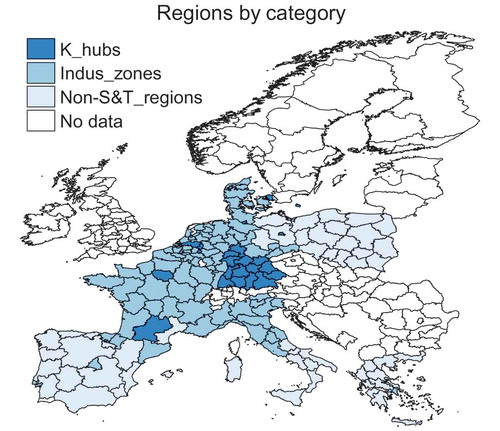
According to Marsan and Maguire (ibid.), knowledge hubs have the highest performance in economic- and innovation-related indicators. Within the category of knowledge hubs, the group of knowledge-intensive city/capital districts is special: they are a distinctive group of regions with extremely high levels of innovation-related variables, urbanization, and GDP per capita. Our data set contains four NUTS2 regions in the group of knowledge-intensive city/capital districts: the Brussels Capital Region, Berlin, Bremen, and Hamburg. In the group of knowledge and technology hubs, our data set covers nineteen regions, including Baden-Württemberg, the Bavaria and Hesse regions in Germany, Ile-de-France (Paris) and the Midi-Pyrénées regions in France, the southern Netherlands region, and the capital region of Copenhagen in Denmark. From and , it is noteworthy that knowledge hubs are all located in western and northern European countries.
Industrial production zones, however, are characterized as regions with a high level of agglomeration activities of production but lagging behind regions on the innovation frontier (ibid.). From and , we notice that industrial production zones are mainly located in western and northern European countries. Industrial production zones are also found in southern European countries but only account for a small share compared to that in western and northern European countries.
Non–S&T-driven regions, by contrast, are characterized as peripheral regions with the lowest level performance on innovation-related indicators. and show that non–S&T-driven regions are mainly located in southern and eastern European countries. This distribution of regions is not unexpected, as the typology by Marsan and Maguire (ibid.) is developed according to indicators that reflect regional levels of economic development and innovation capacity.
As we will measure industry relatedness based on the frequency of co-occurrence of industries at the same region, only tradable sectors are included in the final data set. Tradable sectors are identified as the sectors listed in Standard International Trade Classification (SITC; version 3). By matching SITC3 sectors with NACE2 sectors, we have 323 tradable sectors in the final data set.Footnote6 Each sector is grouped separately into manufacturing, service, or other sectors.Footnote7
We are interested in the question whether the effect of relatedness on regional diversification varies among different types of regions. This may be reflected in the industrial composition in regions. Scholars, such as Heidenreich (Citation2009), Kirner, Kinkel, and Jaeger (Citation2009) and Santamaria, Nieto, and Barge-Gil (Citation2009), argue that interindustry knowledge spillovers are especially relevant for high-tech sectors, since they rely heavily on knowledge-related inputs. Hartog, Boschma, and Sotarauta (Citation2012) find that the effect of related variety on regional growth is conditioned on the technological intensity of local sectors: related variety among high-tech sectors in a region enhances regional employment growth, in contrast to related variety in medium- and low-tech sectors. We investigate whether related diversification is more likely to occur in more knowledge-intensive industries, as compared to industries with lower knowledge intensity. We follow the OECD classification (Hatzichronoglou Citation1997) Footnote8 and divide the manufacturing and service sectors into two broad categories: (1) high-tech manufacturing, medium high-tech manufacturing and knowledge-intensive service (HM-KIS) sectors; and (2) medium low-tech manufacturing, low-tech manufacturing and less knowledge-intensive service sectors (LM-LKIS). displays the number of industries by manufacturing/service/other and by industry categories.
Table 2 The Number of Industries by Manufacturing/Service/Other or by Industry Category
Variables
Measuring regional specialization
Following other studies on regional diversification (e.g., Neffke, Henning, and Boschma Citation2011; Boschma, Minondo, and Navarro Citation2013), we identify entry of a new specialized industry in a region by observing regional specialization dynamics in a five-year interval. We compare the regional specialization status of industry i between year t and t-5. If industry i, which is not specialized in region c at year t-5, is found to be specialized in region c at year t, we identify industry i as a new industry that enters into the specialization portfolio in region c between year t-5 and t. We use location quotients (LQ) to measure regional specialization and compare the share of employment of industry i in region c relative to the share of overall employment of industry i in all regions, as in Equation (1)
where E refers to employment; the subscripts i and c refer to industry i and region c, respectively; and the subscript * refers to all industries or all regions included in the analysis. A higher LQ means a comparative overpresence of industry i in region c compared to all regions. But how high of a LQ is enough to identify a specialized industry in a region? The lack of a widely accepted cutoff value of LQ is one main criticism when it comes to the use LQ to identify agglomeration activities (O’Donoghue and Gleave Citation2004).
In this context, we employ a bootstrap method developed by Tian (Citation2013), to estimate an objective cutoff value of LQ for each industry. Following Tian (ibid.), we calculate the the standardized location quotient (SLQ) for each industry and obtain the statistically significant cutoff value of SLQ for each industry through the bootstrap resampling process.Footnote9 The bootstrap resampling process allows estimation of the actual distribution of SLQ for each industry. With this method, we do not need to impose any assumption about the statistical distribution of SLQ (ibid.). We then estimate the critical value of the actual distribution of SLQ at a 5 percent significance level. The choice of 5 percent significance level is to identify the statistically significant residuals of SLQs for each industry, to identify the regions with exceptionally high levels of agglomeration activities of this industry (O’Donoghue and Gleave Citation2004). Industry i is defined to be specialized in region c if the standardized location quotient (SLQ) in region c is higher than the cutoff value of SLQ for industry i.
Measuring relatedness with existing industries in a region
We employ a proximity approach to measure the relatedness with existing industries in a region. This approach was originally developed by Hidalgo et al. (Citation2007) to measure product space. It has also been widely used in studies of industry diversification (see, e.g., Hausmann and Klinger Citation2007; Hausmann and Hidalgo Citation2010; Neffke, Henning, and Boschma Citation2011). The main idea behind this method is that a country or region is more likely to have revealed comparative advantage in similar products, since the production of similar products requires similar endowments and capabilities (Hausmann and Klinger Citation2007). More specifically, the proximity approach is based on co-occurrence analysis, in which proximity between products is revealed by the likelihood of their co-occurrence in a country or region.
In this study, we use this approach at the regional level to measure proximity among industries. Hidalgo et al. (Citation2007) use trade data to identify revealed comparative advantage of products. However, due to the availability of data at the regional level, we only have employment data to identify revealed comparative advantage of industries in a region. In this case, we use the location quotient (and the bootstrap method to identify the cutoff value of the location quotient) to identify co-occurrence of specialized industries in a region. To better comply with the assumption of the proximity approach, we only include tradable sectors. A main motivation for this is that specialization of tradable sectors are more likely to reflect genuine endowments and capabilities of the location, instead of other factors, such as the demographic structure in a region.Footnote10
Before constructing the measure of relatedness with existing industries in a region, we need to calculate the proximity between each pair of industries.Footnote11 In order to rule out that the likelihood of the co-occurrence of two industries in a region is misled by the overall prevalence of employment in some regions or the large size of some industries (Hausmann and Klinger Citation2007), we take the minimum conditional probability that a region has a specialization of one industry given its cospecialization of another, as in Equation (2)
where φ is the proximity index. In this way, we get a 323-by-323 matrix of proximity indexes based on the co-occurrence analysis of 173 regions. The next step is to link the proximity with the regional structure of industrial specialization by constructing a density indicator, developed by Hausmann and Klinger (ibid.), as in Equation (3)
where the subscript i refers to the focus industry; takes a value of 1 when industry k is specialized in region c. The density indicator is the share of proximities of industry i to all industries k that are specialized in region c at year t, in the total proximities of industry i to all the industries k that are included in the analysis at year t. The density indicator is both industry- and region-specific and varies from 0 to 1. A higher density indicator means a higher level of relatedness of industry i with the industrial specialization portfolio of region c at year t.
Descriptive Statistics
Descriptive statistics of the variables are displayed in Table A1 in the Appendix. This article focuses on the regional diversification process. Therefore, only industries that are already present in each region but have not yet been specialized in each region at the beginning of each five-year interval are included in the analysis. Category dummy variables of industries and regions are time invariant. Specialization status and density indicator are time varying from one five-year interval to another. Specialization status is measured at the end of each five-year interval, and the density indicator is measured at the beginning of each five-year interval. There are in total 135,871 industry-region observations from 2009 to 2012,Footnote12 and we have some missing values for region category dummy variables. The correlation coefficients among the main variables are reported in Table A2 in the Appendix.
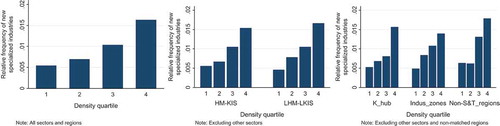
We divide our observations into four groups according to the quartile of density indicator. We calculate the probabilities of acquiring new specialized industries for each quartile of density by dividing the number of new specialized industries by their respective specialization opportunities (the number of industries that are already present in each region but have not yet been specialized in each region at the beginning of each five-year interval). In this way, we depict how the probabilities of acquiring new specialized industries change as the density indicator increases and how the pattern changes over industries and regions. As shown in the left graph of , we find that the probabilities increase as the density increases in general. The probability in the highest quartile is about three times higher than that in the lowest quartile. The pattern that the probabilities of acquiring new specialized industries increase as density increases is further confirmed over industry categories (the middle graph of ) and over region categories (the right graph of ).
Figure 2. Probabilities of acquiring new industrial specializations.
Note: The division between HM-KIS and LHM-LKIS sectors only apply to manufacturing and service sectors. Thus, we exclude other sectors in the middle graph of where we focus on the pattern over sectors (between HM-KIS and LHM-LKIS sectors). Moreover, some regions in our data set are not matched to any region categories by the OECD typology by Marsan and Maguire (Citation2011). Thus, we further exclude the nonmatched regions in the right graph of where we focus on the pattern over regions.
To further probe the main patterns of entry across regions in Europe, we also recognize that there may be some issues with comparing average entry probabilities across regions directly. It could imply that we overestimate diversification activity in regions with a low level of entry opportunities. To account for the potential impact of the differences in industrial structures across regions and in the relative intensity of entry opportunity across industries,Footnote13 following Audretsch and Fritsch (Citation2002), we calculate a sector-adjusted entry number based on a shift share approach. To obtain the pure variation in terms of diversification intensity across regions, the raw entry number is adjusted by the expected entry number, which is calculated based on the assumption of an identical industrial structure across regions (see “The shift-share approach of calculation of sector-adjusted entry numbers” in Appendix 2 for details).
Based on the sector-adjusted entry number during the period of 2004–2009, the top three regions are Ile-de-France (Paris) in France, Trento in Italy, and Oberbayern (München) in Germany; and the bottom three regions are Mazowieckie in Poland, Weser-Ems in Germany, and Rhône-Alpes in France. When we look at the average sector-adjusted entry number in the same period by region category, we find that knowledge hubs have the highest sector-adjusted entry number, which is about 1.5 times as those of the other 2 categories of regions. The average sector-adjusted entry numbers of industrial production zones and non–S&T-driven regions are quite close.
Regression Analysis
We employ regression analysis to detect the effect of the density indicator on regional diversification by controlling for possible confounding factors. The basic model is displayed in Equation (4)
where is specialization status of industry i in region c at year t, with 1 indicating that industry i is specialized in region c at year t, and 0 otherwise;
is the density indicator of industry i in region c at year t-5;
and
are region-year and industry-year dummy variables that are used to control for time-varying heterogeneity across regions or industries. We use the linear probability model instead of logit or probit models for estimation, as the logit or probit models may lead to bias or inconsistency when they estimate the model with a large amount of dummy variables (Greene Citation2012; Boschma, Minondo, and Navarro Citation2013). The density indicator is standardized before it enters into regressions. We report heteroskedasticity-consistent standard errors for each regression.
The model in Equation (4) allows us to quantify the relationship between the density indicator and the probability of new industry specializations at the regional level. A large and statistically significant estimate of the β-parameter is consistent with the argument that new specializations are more likely to occur in industries that are related to a region’s current industries. By estimating this model for different types of regions and industries, we are also able to assess if the strength of the estimated β-parameter varies by region as well as by industry. Our hypothesis is that the role of relatedness in industry diversification is lower in regions with stronger innovation capacity, which would mean that the estimated β-parameter is lower for such regions, compared to regions with weaker innovation capacity.
Results
reports the results of the effects of density indicator on acquiring new industrial specializations. The first panel of includes all industries and regions. As expected, density exhibits a significantly positive effect on acquiring the specialization of a new industry in the future. The positive effect of density is further confirmed across different specifications in the second panel of where we focus on the manufacturing and service sectors. It is noteworthy that the magnitude of density indicator is lower in the second panel, which implies that density plays a more important role in acquiring new industries for other sectors than for the manufacturing and service sectors. In Specification (2) of the second panel, we include an additional interaction term between density indicator and the dummy variable of HM-KIS sectors. The significantly positive coefficient of the interaction term shows that the positive effect of density is higher in HM-KIS sectors than in LHM-LKIS sectors. In Specification (3) of the second panel, we include additional interaction terms between density indicator and region categories, taking the interaction term between density and the dummy variable of non–S&T-driven regions as the reference group. The interaction term between density and the dummy variable of industrial production zones has a statistically negative coefficient, indicating that the effect of density is lower in industrial production regions than in non–S&T-driven regions. The coefficient of the interaction term between density and knowledge hubs is positive but not statistically significant.
Table 3 The Effects of Density Indicator on Acquiring New Industrial Specializations
To further confirm that density plays a differentiated role across industry and region categories, we repeat the estimations separately by manufacturing/service or by industry category (reported in ) and by country group or region category (reported in ). The results in clearly show that, first, the positive coefficient of density is slightly higher in service sectors than in manufacturing sectors. Second, density has a much higher positive effect in HM-KIS sectors than in LHM-LKIS sectors: The coefficient of density for HM-KIS sectors is almost twice as large as that for LHM-LKIS sectors. From the “Country Group in , we find the coefficient of density is only slightly higher for western and northern European countries than for southern European countries. But the coefficient of density is much higher for eastern European countries, almost twice as large as those for the other two country groups. In the panel Region Category in , we find the effect of density is highest for non–S&T-driven regions and lowest for knowledge hubs. But the difference of the density effects between knowledge hubs and industrial production zones is marginal.
Table 4 The Effects of Density Indicator on Acquiring New Industrial Specializations: By Manufacturing/Service or Industry Category
Table 5 The Effects of Density Indicator on Acquiring New Industrial Specializations: By Country Group or Region Category
Why doesn’t the role of density in developing new industrial specializations exhibit a clear decreasing pattern as the regional innovation capacity increases? One explanation could be the overpresence of HM-KIS sectors in knowledge hubs. In order to test this, we repeat the estimation in by distinguishing the category of HM-KIS sectors from the category of LHM-LKIS sectors. The results are reported in . It still holds that the effect of density is generally stronger for HM-KIS sectors than for LHM-LKIS sectors. Moreover, the differences of the density coefficients among region categories are smaller in the category of HM-KIS sectors than those in the category of LHM-LKIS sectors. That is, the differences of the role of density between different categories of regions is more obvious for LHM-LKIS sectors than for HM-KIS sectors. But the pattern among region categories is still ambiguous. We find that the density effect for knowledge hubs is lower than that for non–S&T-driven regions but higher than that for industrial production zones in the category of HM-KIS sectors. By contrast, in the category of LHM-LKIS sectors, we find that the coefficient of density decreases as the regional innovation capacity increases, but the coefficient of density is not statistically significant for knowledge hubs.
Table 6 The Effects of Density Indicator on Acquiring New Industrial Specializations: By Both Industry and Region Categories
Another explanation could be owing to the high heterogeneity within the category of knowledge hubs. According to the typology of Marsan and Maguire (Citation2011), the category of knowledge hubs contains two groups: knowledge-intensive city/capital districts and knowledge and technology hubs. We repeat the estimation by distinguishing the two peer groups within the category of knowledge hubs. The results are reported in . From , we see that density has a much higher coefficient for knowledge-intensive city/capital districts than for knowledge and technology hubs, and in both categories of HM-KIS and LHM-LKIS sectors, although the coefficients are not statistically significant. That is to say, the positive effect of density in the category of knowledge hubs could be attributed mainly to the group of knowledge-intensive city/capital districts, but this pattern is not statistically significant.
Table 7 The Effects of Density Indicator on Acquiring New Industrial Specializations: by Region Group within Knowledge Hubs
To sum up, we find that density plays a critical role in developing new industrial specializations in European regions. Over industries, we find that density plays a much higher effect for HM-KIS sectors than for LHM-LKIS sectors. The difference of density effect between manufacturing and service is marginal. Over regions, we find that the effect of density is much higher in eastern European countries relative to other European countries. Moreover, if we exclude the group of knowledge-intensive city/capital districts, we find in general that the density effect monotonically decreases as the regional innovation capacity increases. Over both industries and regions, the differences of the density effect among region categories is more obvious for LHM-LKIS sectors than for HM-KIS sectors.
Robustness Checks
We conduct four robustness checks to test the sensitivity of our main results. The first check concerns the definition of regional specialization of an industry. As discussed in “Measuring Regional Specialization,” we identify regional specialization based on the statistically significant cutoff values of SLQ. A potential critique is that the method of LQ may not well capture the dynamics of specialization given that the LQ is a ratio. For example, one region may acquire the specialization of an industry not owing to employment growth in this sector in this region but as a result of the employment decline in this sector in other regions. However, we believe this potential problem is highly reduced as we use the statistically significant cutoff values of LQ, which is a quite strict criterion and thus could identify the regions with highly clustered activities for each sector. Nevertheless, we still conducted a robust check by adding a new criterion when we identify regional specialization: the positive employment growth of each sector in each region within each five-year interval.Footnote14 Based on this new definition of regional specialization, we reestimated the model, as reported in Tables C1 and C2 in the Appendix which show that our main findings hold.
The second robustness check concerns the stability of the specialization status. For example, we observe that region c acquires the specialization of a new industry during the period of 2004–2009. But what if this status of the specialization of the industry is not stable over time? In order to test whether the stability of the specialization status impacts on the results, we sort each industry-region observation by year and observe them from 2004 to 2012. We delete the observations with more than one change in the specialization status during the period. We construct a new sample with only observations with no change or only one change in the status of specialization from 2004 and 2012. Based on the new sample, we reestimate the model and report the results in Table D1 and D2 in the Appendix. Based on the results in Table D1, the effect of density by manufacturing/service or country groups is not consistent with our main findings. First, from Table D1 in the Appendix, the effect of density is not significant in service sectors and lower than that in manufacturing sectors. However, in our main findings, the positive effect of density is higher in service than manufacturing sectors. Second, from Table D1 in the Appendix, the magnitude of density is highest in southern European countries and very close to that in eastern European countries. From our main findings, however, the magnitude of density effect is highest in eastern European countries. From Table D2 in the Appendix, the main findings in terms of the density effect by both industry and region categories hold.
The third robustness check concerns whether the main results are sensitive to different time periods of measuring the dynamics of regional specialization. As our data is limited in length, we reconstruct a new sample with only one interval: 2004–2012. Based on this sample, we reestimate the model and report the results in Tables E1 and E2 in the Appendix. It is noteworthy that the findings in terms of the effect of density by manufacturing/service or country groups does not hold. First, from Table E1 in the Appendix, the effect of density is nonsignificant in service sectors and lower than that in manufacturing sectors. However, our main findings show that the density effect is significantly positive for both manufacturing and service sectors, and it plays a more important role in service than manufacturing sectors. Second, from Table E1 in the Appendix, the magnitude of density effect in southern European countries is lower but very close to that in eastern European countries. However, according to our main findings, the density effect in southern European countries should be at a similar level with that in western and northern European countries. From Table D2 in the Appendix, we find the main findings in terms of the density effect by both industry and region categories hold.
The fourth robustness check concerns whether the main results are sensitive if we add other time-varying control variables at the regional level. We reestimate the model by including a set of time-varying, regional-level control variables, retrieved from the Cambridge Econometrics regional database and the Eurostat regional database, including the average growth rate of GDP per capita within each five-year interval,Footnote15 the Los index,Footnote16 population density, levels of GDP, shares of workers in S&T in active population, and levels of gross capital formation per employee. As the regional control variables are time varying, in the estimation we only include region dummy variables to control for constant heterogeneity across regions instead of region-year dummy variables that control for time-varying heterogeneity across regions. As reported in Tables F1 and F2 in the Appendix, our main findings hold.
From the results of the robustness checks, the differentiated role of density in acquiring new industrial specializations over industries and regions is mainly attributed to a core factor: innovation capacity. When we use innovation capacity to distinguish sectors and regions, the role of relatedness indicator is quite robust.
Concluding Remarks
A robust finding emerging out of many recent studies is that relatedness is a strong driver of industrial diversification. However, this finding tends to be an average effect across many different types of (local) economies. This article contributed by exploring heterogeneity across European regions in terms of the role of relatedness in explaining industrial diversification, measured as the entry of new industry specializations. The first finding is that relatedness has a positive influence on the probability that a new industry specialization develops. This result is robust and holds across all regions under investigation; that is, the local presence of related activities provides a powerful explanation for what type of new industrial specializations is developed in regions, no matter whether these concern core knowledge regions, manufacturing regions, or peripheral regions. A second finding is that the influence of relatedness on the probability of new industrial specializations depends on innovation capacity: relatedness is a more important driver of diversification in regions with a weaker innovation capacity. The effect of relatedness appears to decrease monotonically as the innovation capacity of a local economy increases. This is consistent with the argument that high innovation capacity allows an economy to break from its past and to develop, for the economy, truly new industry specializations. Still, we also find some industrial differences: while relatedness plays a more important role in knowledge-intensive industries than in industries with lower knowledge intensity, the difference of the relatedness effect across European regions is more pronounced in industries with lower knowledge intensity.
These findings clearly underscore that the effect of relatedness is not invariant to local conditions. They also call for further investigation. First, there is a need to unravel the specific capabilities that underlie related diversification in a local economy. What enabling factors make some industries more likely to grow out of other industries? Is it because the new industries can build on a similar knowledge base, draw on a shared network, make use of similar institutions, exploit a common set of local skills, or benefit from public policy intervention? And do regions with different economic and industrial structures differ in that respect? Second, there is a need to be more precise about what makes related diversification different from unrelated diversification. Boschma (Citation2017) pleads for an approach that determines what types of new combinations made between related and unrelated industries lead to new industrial specializations. Third, a crucial and still open question is what type of diversification secures long-term economic development. Do specialized local economies need to diversify in unrelated activities to avoid lock-in in the long run, and is there a difference between regions with different economic and industrial structures? Fourth, the regional diversification literature has focused primarily on local capabilities. However, recent evidence suggests that nonlocal capabilities, besides local capabilities, may also influence regional diversification (Boschma and Iammarino Citation2009; Tavassoli and Carbonara Citation2014; Isaksen Citation2015; Miguelez and Moreno,Citationforthcoming; Trippl, Grillitsch, and Isaksen, Citationforthcoming). This calls for a multiscalar perspective to assess the relative importance of local and nonlocal capabilities (Binz, Truffer, and Coenen Citation2014). And fifth, there is a need to develop a microperspective that identifies the key agents that drive diversification in different types of regions (Neffke et al. Citation2018) and determines which regional factors make local actors in some regions successful in inducing institutional change to enable new activities. Finally, our findings suggest that regional policy should incorporate the fact that relatedness is an important factor enabling diversification in regions more in general (see Balland et al., Citationforthcoming). However, our findings suggest that policy should also account for the innovative capacity of regions, since this may be important to stimulate more unrelated diversification to avoid potential lock-in, especially in peripheral regions in the European Union where innovation capacity is low. In this respect, one could think of all kinds of policies that will address the low absorptive of companies and weak entrepreneurial capacities in peripheral regions but also institutional weaknesses like low quality of government and a poor culture of collaboration (Rodríguez-Pose, Di Cataldo, and Rainoldi Citation2014; Karo and Kattel Citation2015; McCann and Ortega-Argilés Citation2015; Rodríguez-Pose and Wilkie Citation2015; Cortinovis et al. Citation2017).
Acknowledgments
We thank Nicola Cortinovis for sharing the cleansed and geo-coded version of the employment data for European regions. Please see Cortinovis and van Oort (2015) for more information in terms of the construction of the data set. Funding support by JPI Urban Europe project ‘Resilient Cities: Industrial Network and Institutional Perspectives on Economic Growth and Well-Being [grant 438-13-406]’ is acknowledged.
Notes
1 For example, in his well-known work on strategy, structure and economic performance, Rumelt (Citation1974) argues that one of the reasons that science-based industries tend to show greater diversification than other industries is that the technologies associated with such industries are more easily extended into new applications.
2 See Cortinovis and Van Oort (Citation2015) for more details about the data set.
3 We keep countries with more than one NUTS2 regions in order to obtain variations within each country.
4 A full list of 173 NUTS2 regions is shown in Table B1 in the Appendix.
5 Marsan and Maguire (Citation2011) originally identify eight peer groups. In our analysis, we exclude one peer group—US states with average S&T performance, as it does not apply to our context.
6 A full list of industries is shown in Table B2 in the Appendix.
7 Other sectors refer to industries in Section A (Agriculture, forestry, and fishing), Section B (Mining and quarrying), Section D (Electricity, gas, steam, and air conditioning supply), Section E (Water supply, sewerage, waste management, and remediation activities) and Section F (Construction) in NACE2 classification.
8 Eurostat, High-tech industry and knowledge-intensive services (htec) Annex 3. 2015. http://ec.europa.eu/eurostat/cache/metadata/Annexes/htec_esms_an3.pdf.
9 See Cortinovis et al. (Citation2017) for details of the calculation process.
10 For example, if there are a lot of young people in a region, we would observe that the region specializes in education. However, this specialization just reflects the demographic structure of the region, instead of the real endowments or capabilities of the region.
11 See Cortinovis et al. (Citation2017) for more details in calculating proximity between industries and relatedness with existing industries in a region.
12 We focus on the years from 2009 to 2012 so that our data are long enough to compare the dynamics of regional specialization between year t and year t-5.
13 Our formal econometric analysis in the “Regression Analysis” section does not suffer from the problem, since it is based on industry level and we include both region-year and industry-year dummy variables to control for time-varying heterogeneity across regions or industries.
14 We do not include the employment growth of each sector as one criterion in the main analysis for two reasons. First, we believe that the consideration of the statistically significant cutoff values of SLQ is already a quite strict criterion to identity regional specialization. Second, we use employment data from Orbis to calculate the employment growth of each sector in each region. As discussed in the “Data” section, this data mainly cover big firms and suffer from the problem of missing values.
15 The average growth of GDP per capital in the last interval is the average growth rate of GDP per capita in a four-year interval, since the data of GDP per capita is not available for the year 2012.
16 We calculate the Los index (Citation2000) based on the 323-by-323 matrix of proximity indexes.
1 Audretsch and Fritsch (2002) use the number of establishments for each industry to measure industrial structure.
Related Research Data
References
- Andersson, M., Klaesson, J., and Larsson, J. P. 2014. The sources of the urban wage premium by worker skills: Spatial sorting or agglomeration economies? Papers in Regional Science 93 (4): 727–47. doi:10.1111/pirs.12025.
- Audretsch, D. B., and Fritsch, M. 2002. Growth regimes over time and space. Regional Studies 36 (2): 113–24. doi:10.1080/00343400220121909.
- Bacolod, M., Blum, B. S., and Strange, W. C. 2009. Skills in the city. Journal of Urban Economics 65 (2): 136–53. doi:10.1016/j.jue.2008.09.003.
- Balland, P., Boschma, R., Crespo, J., and Rigby, D. Forthcoming. Smart specialization policy in the EU: Relatedness, knowledge complexity and regional diversification. Regional Studies doi:10.1080/00343404.2018.1437900.
- Binz, C., Truffer, B., and Coenen, L. 2014. Why space matters in technological innovation systems—Mapping global knowledge dynamics of membrane bioreactor technology. Research Policy 43 (1): 138–55. doi:10.1016/j.respol.2013.07.002.
- Boschma, R. 2017. Relatedness as driver behind regional diversification: A research agenda. Regional Studies 51 (3): 351–64. doi:10.1080/00343404.2016.1254767.
- Boschma, R., Balland, P. A., and Kogler, D. F. 2015. Relatedness and technological change in cities: The rise and fall of technological knowledge in U.S. metropolitan areas from 1981 to 2010. Industrial and Corporate Change 24 (1): 223–50. doi:10.1093/icc/dtu012.
- Boschma, R., and Iammarino, S. 2009. Related variety, trade linkages, and regional growth in Italy. Economic Geography 85 (3): 289–311. doi:10.1111/ecge.2009.85.issue-3.
- Boschma, R., Minondo, A., and Navarro, M. 2013. The emergence of new industries at the regional level in Spain: A proximity approach based on product relatedness. Economic Geography 89 (1): 29–51. doi:10.1111/ecge.2013.89.issue-1.
- Breschi, S., Lissoni, F., and Malerba, F. 2003. Knowledge-relatedness in firm technological diversification. Research Policy 32 (1): 69–87. doi:10.1016/S0048-7333(02)00004-5.
- Colombelli, A., Krafft, J., and Quatraro, F. 2014. The emergence of new technology-based sectors in European regions: A proximity-based analysis of nanotechnology. Research Policy 43 (10): 1681–96. doi:10.1016/j.respol.2014.07.008.
- Cortinovis, N., and van Oort, F. 2015. Variety, economic growth and knowledge intensity of European regions: A spatial panel analysis. Annals of Regional Science 55 (1): 7–32. doi:10.1007/s00168-015-0680-2.
- Cortinovis, N., Xiao, J., Boschma, R., and van Oort, F. 2017. Quality of government and social capital as drivers of regional diversification in Europe. Journal of Economic Geography 17 (6): 1179–208. doi:10.1093/jeg/lbx001.
- Duranton, G., and Puga, D. 2001. Nursery cities: Urban diversity, process innovation, and the life cycle of products. American Economic Review 91 (5): 1454–77. doi:10.1257/aer.91.5.1454.
- _____. 2005. From sectoral to functional urban specialisation. Journal of Urban Economics 57 (2): 343–70. doi:10.1016/j.jue.2004.12.002.
- Essletzbichler, J. 2015. Relatedness, industrial branching and technological cohesion in US metropolitan areas. Regional Studies 49 (5): 752–66. doi:10.1080/00343404.2013.806793.
- Feldman, M. P., Kogler, D. F., and Rigby, D. L. 2015. rKnowledge: The spatial diffusion and adoption of rDNA methods. Regional Studies 49 (5): 798–817. doi:10.1080/00343404.2014.980799.
- Fornahl, D., and Guenther, C. 2010. Persistence and change of regional industrial activities. The impact of diversification in the German machine tool industry. European Planning Studies 18 (12): 1911–36. doi:10.1080/09654313.2010.515790.
- Frenken, K., and Boschma, R. A. 2007. A theoretical framework for economic geography: Industrial dynamics and urban growth as a branching process. Journal of Economic Geography 7 (5): 635–49. doi:10.1093/jeg/lbm018.
- Greene, W. H. 2012. Econometric analysis. 7th ed. Harlow, England: Pearson Education.
- Hartog, M., Boschma, R., and Sotarauta, M. 2012. The impact of related variety on regional employment growth in Finland 1993–2006. High-tech versus medium/low-tech. Industry and Innovation 19 (6): 459–76. doi:10.1080/13662716.2012.718874.
- Hatzichronoglou, T. 1997. Revision of the high-technology sector and product classification. Paris: OECD Publishing.
- Hausmann, R., and Hidalgo, C. A. 2010. Country diversification, product ubiquity, and economic divergence. Working Paper 201. Cambridge, MA: Center for International Department, Havard University.
- Hausmann, R., and Klinger, B. 2007. The structure of the product space and the evolution of comparative advantage. Working Paper 146. Cambridge, MA: Center for International Development, Harvard University.
- He, C., Yan, Y., and Rigby, D. Forthcoming. Regional industrial evolution in China. Papers in Regional Science doi:10.1111/pirs.12246.
- Heidenreich, M. 2009. Innovation patterns and location of European low-and-medium-technology industries. Research Policy 38 (3): 483–94. doi:10.1016/j.respol.2008.10.005.
- Heimeriks, G., and Boschma, R. 2014. The path- and place-dependent nature of scientific knowledge production in biotech 1986-2008. Journal of Economic Geography 14 (2): 339–64. doi:10.1093/jeg/lbs052.
- Hidalgo, C. 2015. Why information grows: The evolution of order, from atoms to economies. New York: Basic Books.
- Hidalgo, C. A., Klinger, B., Barabási, A.-L., and Hausmann, R. 2007. The product space conditions the development of nations. Science 317 (5837): 482–87. doi:10.1126/science.1144581.
- Isaksen, A. 2015. Industrial development in thin regions: Trapped in path extension? Journal of Economic Geography 15 (3): 585–600. doi:10.1093/jeg/lbu026.
- Isaksen, A., and Trippl, M. 2016. Path development in different regional innovation systems. In Innovation drivers and regional innovation strategies, ed. M. D. Parrilli, R. D. Fitjar, and A. Rodríguez-Pose, 66–84. New York: Routledge.
- Karo, E., and Kattel, R. 2015. Economic development and evolving state capacities in Central and Eastern Europe: Can “smart specialization” make a difference? Journal of Economic Policy Reform 18 (2): 172–87. doi:10.1080/17487870.2015.1009068.
- Kirner, E., Kinkel, S., and Jaeger, A. 2009. Innovation paths and the innovation performance of low-technology firms—An empirical analysis of German industry. Research Policy 38 (3): 447–58. doi:10.1016/j.respol.2008.10.011.
- Kogler, D. F., Rigby, D. L., and Tucker, I. 2013. Mapping knowledge space and technological relatedness in US cities. European Planning Studies 21 (9): 1374–91. doi:10.1080/09654313.2012.755832.
- Los, B. 2000. The empirical performance of a new inter-industry technology spillover measure. In Technology and knowledge, ed. P. P. Saviotti and B. Nooteboom, 118–51. Cheltenham, UK: Edward Elgar.
- Marsan, G. A., and Maguire, K. 2011. Categorisation of OECD regions using innovation-related variables. Working Paper 2011/03. Paris: OECD. http://www.oecd-ilibrary.org/docserver/download/5kg8bf42qv7k-en.pdf?expires=1517250949&id=id&accname=guest&checksum=567BA2E38A44BCF7C11547E307ACBE10.
- Martin, R., and Sunley, P. 2006. Path dependence and regional economic evolution. Journal of Economic Geography 6 (4): 395–437. doi:10.1093/jeg/lbl012.
- McCann, P., and Ortega-Argilés, R. 2015. Smart specialization, regional growth and applications to European Union cohesion policy. Regional Studies 49 (8): 1291–302. doi:10.1080/00343404.2013.799769.
- Miguelez, E., and Moreno, R. Forthcoming. Relatedness, external linkages and regional innovation in Europe. Regional Studies doi:10.1080/00343404.2017.1360478.
- Montresor, F., and Quatraro, F. 2017. Regional branching and key enabling technologies. Evidence from European patent data. Economic Geography 93 (4): 367–96. doi:10.1080/00130095.2017.1326810.
- Neffke, F., Hartog, M., Boschma, R., and Henning, M. 2018. Agents of structural change: The role of firms and entrepreneurs in regional diversification. Economic Geography 94 (1): 23–48. doi:10.1080/00130095.2017.1391691.
- Neffke, F., Henning, M., and Boschma, R. 2011. How do regions diversify over time? Industry relatedness and the development of new growth paths in regions. Economic Geography 87 (3): 237–65. doi:10.1111/ecge.2011.87.issue-3.
- O’Donoghue, D., and Gleave, B. 2004. A note on methods for measuring industrial agglomeration. Regional Studies 38 (4): 419–27. doi:10.1080/03434002000213932.
- Rigby, D. 2015. Technological relatedness and knowledge space: Entry and exit of US cities from patent classes. Regional Studies 49 (11): 1922–37. doi:10.1080/00343404.2013.854878.
- Rodríguez-Pose, A., di Cataldo, M., and Rainoldi, A. 2014. The role of government institutions for smart specialisation and regional development. S3 Policy Brief Series 4. Luxembourg: European Commission. http://s3platform.jrc.ec.europa.eu/documents/20182/114990/JRC88935_Role_GovInstitutions_S3_RegDev.pdf/282978d5-0c4d-448a-be21-62ab16fe19a2.
- Rodríguez-Pose, A., and Wilkie, C. 2015. Institutions and the entrepreneurial discovery process for smart specialization. Papers in Evolutionary Economic Geography 15.23. Utrecht, the Netherlands: Utrecht University.
- Rumelt, R. P. 1974. Strategy, structure, and economic performance. Cambridge, MA: Harvard University Press.
- Santamaria, L., Nieto, M. J., and Barge-Gil, A. 2009. Beyond formal R&D: Taking advantage of other sources of innovation in low- and medium-technology industries. Research Policy 38 (3): 507–17. doi:10.1016/j.respol.2008.10.004.
- Saviotti, P. P., and Frenken, K. 2008. Trade variety and economic development of countries. Journal of Evolutionary Economics 18 (2): 201–18. doi:10.1007/s00191-007-0081-5.
- Schumpeter, J. A. 1934. The theory of economic development. Cambridge, MA: Harvard University Press.
- Tanner, A. N. 2016. The emergence of new technology-based industries: The case of fuel cells and its technological relatedness to regional knowledge bases. Journal of Economic Geography 16 (3): 611–35. doi:10.1093/jeg/lbv011.
- Tavassoli, S., and Carbonara, N. 2014. The role of knowledge variety and intensity for regional innovation. Small Business Economics 43 (2): 493–509. doi:10.1007/s11187-014-9547-7.
- Tian, Z. 2013. Measuring agglomeration using the standardized location quotient with a bootstrap method. Journal of Regional Analysis and Policy 43 (2): 186–97.
- Tödtling, F., and Trippl, M. 2005. One size fits all? Towards a differentiated regional innovation policy approach. Research Policy 34 (8): 1203–19. doi:10.1016/j.respol.2005.01.018.
- Trippl, M., Grillitsch, M., and Isaksen, A. Forthcoming. Exogenous sources of regional industrial change: Attraction and absorption of non-local knowledge for new path development. Progress in Human Geography doi:10.1177/0309132517700982.
- Van den Berge, M., and Weterings, A. 2014. Relatedness in eco-technological development in European regions. The Hague: Planbureau voor Leefomgeving.
- Weitzman, M. L. 1998. Recombinant growth. Quarterly Journal of Economics 113 (2): 331–60. doi:10.1162/003355398555595.
Appendix 1: Tables
Table A1 Description and Summary Statistics of Main Variables
Table A2 Correlations of Main Variables
Table B1 The List of Regions (NUTS 2010 Classification)
Table B2 The List of Industries (NACE Version 2)
Table C1 The Effects of Density Indicator: By Manufacturing/Service or Country Group—Robustness Check or Adding The Criterion of Positive Employment Growth of Regional Specialization
Table C2 The Effects of Density Indicator: By Both Industry and Region Categories—Robustness Check for Adding the Criterion of Positive Employment Growth of Regional Specialization
Table D1 The Effects of Density Indicator: By Manufacturing/Service or Country Group—Robustness Check for The Stability of the Specialization Status
Table D2 The Effects of Density Indicator: By Both Industry and Region Categories—Robustness Check for the Stability of the Specialization Status
Table E1 The Effects of Density Indicator: By Manufacturing/Service or Country Group—Robustness Check for the Different Time Period
Table E2 The Effects of Density Indicator: By Both Industry and Region Categories - Robustness Check for the Different Time Period
Table F1 The Effects of Density Indicator: By Manufacturing/Service or Country Group—Robustness Check for Adding Time Varying Control Variables
Table F2 The Effects of Density Indicator: By Both Industry and Region Categories—Robustness Check for Adding Time-varying Control Variables
Appendix 2: The Shift-share Approach of Calculation of Sector-adjusted Entry Numbers
Due to data availability, we use employment for each industry to measure industrial structure across regions.Footnote1 First, we calculate the expected number of employment for each industry/region if all regions follow an identical industrial structure, see Equation (A1)
where subscripts i and j refer to industry i and region j, respectively; represents the number of employment for each industry i and region j;
is the total employment number for region j , and
is the share of the total employment in industry i in the total employment of all industries and regions in the analysis.
Second, we calculate the expected entry number for each region, as shown in Equation (A2).
The expected entry number for each region is calculated by summing up the product of the expected number of employment for each industry/region and the average entry rate of respective industry in all regions .
Third, we calculate the entry number caused by the differences between the industrial structure of each region and the average industrial structure of all regions, see Equation (A3).
Fourth, the sector-adjusted entry number is obtained by subtracting from the observed entry number for each region, as shown in Equation (A4)
where refers to the real entry number for each industry/region and
is sector-adjusted entry number for each region. The sector-adjusted entry number is assumed to filter out the differences caused by differences of industrial structures across regions.