
ABSTRACT
This paper examines the link between the clustering of long-term disadvantaged students within schools, and the attainment gap at age 11 between these disadvantaged students and the rest. The data comes from the National Pupil Database for England from 2006 to 2019. The analysis focuses on students who would go on to be officially recognised as living in relative poverty for all 11 years from when they arrived at primary school up until age 16. This subset of disadvantaged students is a stable proportion of around 4.4% of each age cohort. They would have attracted Pupil Premium funding for their schools in any year, if it had been available, and despite any legal or economic changes over time. Comparing the educational outcomes for this group in comparison to their peers therefore provides a fair test of the impact of the Pupil Premium funding policy on the clustering of the poorest children, and their attainment relative to their peers. The segregation of long-term disadvantaged students between primary schools declined nationally after the policy was introduced. This happened in all economic regions, especially in areas with higher proportions of such pupils, for all ethnic groups, and for students with a special educational need or disability. This drop is strongly correlated over time and place with a corresponding decline in the attainment gap at age 11. It provides potentially strong evidence of the benefit of a targeted additional funding scheme like the Pupil Premium, with implications for how such funds are best used worldwide.
Introduction
Pupil Premium funding was introduced in England in 2011 for all state-funded schools, in proportion to their intake of disadvantaged (mostly income poor) pupils (Roberts et al., Citation2021). It was given to provide assistance and interventions to decrease the apparent unattractiveness (during the allocation of school places) of disadvantaged students who might need more resources to achieve expected levels of attainment (Freedman & Horner, Citation2008), and to improve the attainment of poorer pupils, so reducing the poverty attainment gap (DfE, Citation2019; Gov.uk, Citation2010). For more on this, see Gorard et al. (Citation2019) and Gorard et al. (Citation2021). Living in poverty is a key determinant of child well-being, and cognitive and educational outcomes (Chaudry & Wimer, Citation2016). The onset and permanence of child poverty also appear to matter for children’s outcomes. Early, long-term family poverty generally leads to worse outcomes.
This paper starts with an overview of some of the existing evidence on focused funding initiatives, employed to improve educational outcomes for poorer children, and how these are best implemented. The key concern for the new evaluation presented in this paper is how to identify, and so label, those students who are clearly disadvantaged, and therefore eligible for additional targeted funding, using a method that is fair and stable over time. The paper outlines the practical difficulties of such an evaluation, describes the datasets, design and methods used, and then presents the findings and some implications for policy on educational funding.
Prior evidence
Focused educational funding
Internationally, we have found no prior studies looking at the effectiveness of additional funding, in itself, for reducing socioeconomic segregation between schools. The literature, on this clustering of poor pupils with others like them in specific schools, has largely been concerned with how strong the pattern is, why it arises, and what damage this causes (Danhier, Citation2018; Hewstone et al., Citation2018). For example, selecting pupils to schools by ability, or allocating them to ability-based tracks, also inadvertently (perhaps) sorts them out by family background to some extent (Gorard & Siddiqui, Citation2019). And the same thing happens when school places are allocated in terms of residential district, or where schools have a faith basis, or even a curriculum speciality. In fact, any kind of diversity of schooling within a national system is linked to segregated pupil intakes (Gorard, Citation2018).
This kind of socio-economic segregation is strongly associated with higher degrees of social reproduction (Reichelt et al., Citation2019). It has been shown that teachers tend to treat disadvantaged pupils differently in high disadvantage schools than they do in other schools (Gorard & Smith, Citation2010). Indeed the quality of teachers/teaching may vary in terms of such schools. There may also be a peer effect whereby young people adapt their expectations towards the average outcome expectations of their friends (according to Lorenz et al., Citation2020). On the other hand, exposure to a more varied set of possible friends, including some with higher attainment or motivation, can lead to improved role models for lower attaining pupils (Gorard, Citation2018; Dickerson et al., Citation2018), and more tolerant wider pupil attitudes such as trust in others (Bhattacharya, Citation2021). Segregation by poverty between schools is the antithesis of such mixed intakes. It is interesting to see how Pupil Premium funding in England affects (if it does) socioeconomic segregation between schools in England, and what benefits this might bring.
Using funding to improve the attainment of poorer pupils is a more common policy approach than using it to reduce pupil clustering by poverty. The approach has been used by governments and other agencies worldwide for many years (Children’s World Report, Citation2020). But it has apparently had little demonstrable effect, such as in the US (Hanushek et al., Citation2019). There are many variations, with money given to the school system to deploy, or to areas with high levels of disadvantage (as in Opportunity Areas in England, DfE, Citation2018a), to families either for them to deploy or as an incentive (so that parents encourage school attendance, for example), to teachers in Guinea (Barrera-Osorio et al., Citation2021), or to the disadvantaged students themselves in the US (Toutkoushian & Michael, Citation2007). There is little clear robust evidence so far on which approach is best.
Several evaluations suggest that giving the funding to students to improve their performance directly or through enhanced extrinsic motivation does not work in most subject areas, at least in the US (Bettinger, Citation2010; Fryer, Citation2010). Students also need to know how to improve their attainment. Therefore, paying them for the building blocks of improvement, such as for classroom behaviour or school attendance where students are more likely to know what to do, is more promising. A conditional cash transfer programme targeting middle school age girls in Pakistan led to increased enrolment in school (school enrolment is far less than 100%), and greater educational progression to high school (Alam et al., Citation2011). A cash transfer to underachieving students if they achieve a long-term objective like a school completion certificate could be effective, as was demonstrated in the US (Angrist & Lavy, Citation2009).
One large experimental study in Mexico found improved attainment in maths, compared to a control, for groups wherein students were paid if they increased their scores, and a group wherein students, teachers, and school leaders received the incentive (Behrman et al., Citation2015). There was little or no improvement for a group wherein only teachers were paid extra if students improved. Incentives can encourage teachers to take posts in disadvantaged areas and schools in the US (Clotfelter et al., Citation2005; Feng, Citation2014), but do not usually help retain them there, especially if the funding ceases or reduces (according to the international synthesis by See et al. 2020). So, directing the funding to pay for more or better teachers is not a particularly promising avenue.
The evidence on the benefits of paying parents is not much stronger. Giving poorer families substantially higher incomes, irrespective of their behaviours, can improve their children’s outcomes at schools (Cooper & Stewart, Citation2021). Riccio et al. (Citation2010) also suggests that giving low-income families cash rewards for engaging in educational activities improved attendance and perhaps maths scores. However, lack of parental engagement in children’s learning and school life has not been demonstrated to be a clear causal factor in equalising the academic outcomes of disadvantaged children. Therefore, funding programmes to support parental involvement for disadvantaged children is not a promising use of money if student attainment is the main objective (Gorard & See, Citation2013). There is evidence from the UK Education Maintenance Allowance (EMA) policy that providing this sum to the parent(s) of the young person was inefficient (Holford, Citation2015). The money was partly used for other things, and did not reduce young people’s working time (and so make time available for education and training) as much as would be expected. The study concludes that it would be preferable to make this cash transfer directly to the young person.
Although the international evidence on providing extra money to schools for them to improve is mixed (e.g. Mbiti et al., Citation2019, in Tanzania), some large studies have suggested that providing extra resources for schools can lead to greater gains than incentives for teachers do (Lavy, Citation2002). One promising approach, evaluated in a randomised control trial in China, is to tie the additional school funding to peer-tutoring (Tao et al., Citation2010).
It is crucial for any funding scheme intended to improve education for disadvantaged groups that the funding reaches its correct “target”, and this requires deciding on a clear definition of “disadvantage”. Many approaches are possible, and most have pros and cons, as we have discussed elsewhere (e.g. Gorard et al., Citation2019). Here we focus on the main indicator used in the official definition of eligibility for Pupil Premium – eligibility for free school meals, based on low family income. The funding then needs to be deployed and used effectively by schools. What this means in practice is discussed in Gorard et al. (Citation2017). The funding allocation must be fair, which depends on high quality administrative data (Baker et al., Citation2014), otherwise the intended recipients can miss out on the benefits (Minorini & Sugarman, Citation1999). Good intentions and extra money are not enough in themselves.
The Pupil Premium is perhaps most like the additional funding that schools in England have long received for individual pupils with statements of special educational needs (SEN) or a disability. Both funds are intended to assist those pupils facing long-term challenges in accessing the curriculum. Most of the SEN funding is not tied to compliance standards or other criteria. Despite reforms in 2014 and subsequently, the funding is still simply based on the needs of individuals attending schools (Long & Danechi, Citation2020). And its spending is directed by professional guidance and statements of needs/entitlement. This should reduce the chances of failure of implementation, as has happened previously with more complex schemes elsewhere (Bastagli, Citation2010). It is promising for a scheme such as Pupil Premium funding, which is also based on individuals attending each school but its expenditure is not tied to the individual in the same way as for SEN. However, it is required by the DfE to be used in an evidence-based way. The evidence on the impact of funding for poorer pupils is mixed but reasonably promising overall (Henry et al., Citation2010; Holmlund et al., Citation2010).
This new paper looks at these issues in the context of the Pupil Premium funding policy for schools in England, considering the issues of whether this is a promising route, how we identify disadvantage accurately, and how the funding might be used.
Pupil Premium funding
It is traditionally accepted by analysts that socio-economic inequality in education cannot be addressed simply by enacting equality laws (Gorard, Citation2018), just as with any policy legislation (Cerna, Citation2013). The Pupil Premium policy, however, is both a law giving duties to schools and teachers, and a way of channelling funding to at least some of the most needy pupils in England (Barrett, Citation2018), alongside providing a growing body of evidence on how that funding is best spent.
The widespread and expensive Pupil Premium policy was implemented in England without prior robust evaluation. Subsequent research has been limited by being very early (Carpenter et al., Citation2013), or weak and small scale (e.g. Copeland, Citation2019; Craske, Citation2018). And because the policy applies to all schools it is no longer possible to design an evaluation with a clear counterfactual group which does not receive Pupil Premium funding. Instead we have to rely on before-and-after time series analyses, coupled with attempts to factor out other changes to the law, to the economy and to assessment, that have taken place over the same period.
All prior attempts at evaluating the impact of Pupil Premium funding in this way have so far been found wanting in several crucial respects (Gorard et al., Citation2019). And there had been no evaluations of the impact on socio-economic segregation between schools, until a study of primary school intakes by Gorard et al. (Citation2021).
The poverty attainment gap is defined as the standardised difference between the attainment of a disadvantaged group and a not disadvantaged group of pupils. There have been some studies of the attainment gap which only looked at the picture since 2011, when Pupil Premium started, and so they cannot genuinely say that any trend was not already in existence beforehand (e.g. DfE, Citation2018b). Also, none of the prior studies of the attainment gap have taken into account confounding factors such as economic changes, new definitions of disadvantage, and non-educational policies such as the introduction of Universal Credit. Economic and policy changes matter because they will change the proportion and nature of the group officially labelled as disadvantaged in any year. And this will then alter the apparent attainment gap between pupils labelled disadvantaged and the rest in a way that is unrelated to the impact of the Pupil Premium, or the work of schools. The DfE (Citation2014) have attempted to deal with abrupt changes in the nature of assessment and grading by using national rankings of attainment scores rather than the raw scores themselves when assessing the poverty attainment gap. However, this approach does not address economic and legal changes, and anyway has been shown to produce the same substantive findings as using raw scores (Gorard, Citation2021).
Pupil Premium funding is based on pupils in each school with families in the armed forces, living in care, or who are eligible for free school meals (FSM). FSM-eligibility is by far the most prevalent of these, and is the only one that has been recorded consistently in the National Pupil Database (NPD) since at least 1992. Since 1989, the proportion of pupils registered as eligible for (or taking) FSM has varied with extremes from just above 10% of the school population to just above 20%. Assessing the impact of the Pupil Premium involves comparing the attainment gap for years before 2011 when there was no Pupil Premium with later years when there was. FSM is the only indicator possible to use here as a long-term criterion, because pupils living in care and Service children were not officially or consistently recorded in the NPD until relatively recently. Because FSM-eligibility varies so much over time, in some years the disadvantaged group would be much larger than in others.
Average attainment at Key Stage 4 (KS4) when aged 16 (and every other Key Stage) is known to be linked to the duration of pupils’ disadvantage. Pupils who have been FSM-eligible for more years by KS4 have lower average attainment than those who have been more temporarily FSM-eligible. In fact, the temporary FSM-eligible pupils are closer in average attainment to the majority never-eligible pupils than to the permanently poor (Gorard, Citation2018). This means that in years when the economy is poor, and there are more FSM-eligible pupils, then the newly eligible ones will have higher average attainment than the other longer-term FSM-eligible pupils, and so the official attainment gap will appear to decline. The opposite will happen when the economy improves, and the attainment gap will appear to increase. This is not, however, anything to do with Pupil Premium impact or the work of schools. So, analyses like those of Exley (Citation2015), National Audit Office (Citation2015), Public Accounts Committee (Citation2015), and Education Endowment Foundation (Citation2017), and Education Policy Institute (Citation2017), and the Social Mobility Commission (Citation2019), are misleading because what they are portraying as changes in the attainment gap are at least partly just changes in the economy. The same thing happens when a new law such as Universal Credit changes the proportion of pupils labelled as disadvantaged.
Similar things also happen when economic or educational changes lead to more or fewer families in England using the minority of private schools. The roughly 6.5% of privately educated pupils are not generally included in official estimates of the attainment gap based on the National Pupil Database, and are not often FSM-eligible. If the pupils on the cusp of using private schools are, on average, slightly higher attaining than the remaining pupils in the state-funded system then in years when they are in the state-funded system they will be included in the calculations, and so the attainment gap will appear larger. The official gap will appear smaller in years when such pupils are in private schools and omitted from the gap calculation. Again this is nothing, directly, to do with the impact of Pupil Premium funding. It will just confuse the conclusions drawn from a simple time series analysis (such as those cited above, including all official versions of the attainment gap).
Another, perhaps relatively minor, factor is that the existence of the Pupil Premium policy itself will have provided a further incentive for schools to register all potential target pupils as FSM-eligible. It was estimated that perhaps 50,000 or more pupils have been legally entitled to FSM but were not registered, or their status is otherwise unclear (Gorard et al., Citation2019). Registering more of these pupils in order to attract more Pupil Premium funding will reduce the amount of missing data, and so increase the apparent prevalence of disadvantage, thereby influencing the apparent attainment gap.
A substantial part of the apparent change in the official attainment gap in any year, area or school is therefore linked to factors such as changes in private school attendance, the economy, changes in the definition of poverty, and the duration of poverty (none of which are strictly anything to do with attainment levels, but which become confounding variables unless accounted for). These problems arise whether the gap is based on current FSM-eligible pupils and the rest, or pupils who have ever been FSM-eligible and the rest. If anything, the EverFSM indicator is even more sensitive to such concurrent changes than simple eligibility is.
In order to evaluate Pupil Premium impact directly we need a definition of disadvantage that can be used for the analysis of all cohorts, including those before and after 2011. We also need a dataset that contains common variables and measures available over all of that time. Under current conditions it is not possible to use actual measures of household income (HMRC have repeatedly refused access). We need to identify a sub-set of pupils who would have been eligible for Pupil Premium funding in any era, even when there was no funding, and under any legal, economic, or other conditions.
A recent study by Hutchinson et al. (Citation2020) took our advice on this, and looked at outcomes for what they called “persistently disadvantaged” pupils. They compared results for these long-term FSM-eligible pupils with the results of pupils who had never been eligible (excluding from analysis those who had ever been eligible in the past six years, but not persistently so). This is an advance on prior work, but it still has the problem of sensitivity to legal, economic and other changes over time that are nothing to do with schools, teachers, or attainment. As shown in later sections of this paper, temporarily disadvantaged students are more like the never disadvantaged than like the long-term disadvantaged. Changes in the economy may be more likely to affect them, for example, and so some years will include pupils as never disadvantaged who might have been temporarily so during a recession. It is safer always to compare a stable disadvantaged group (however defined) with the equally stable group of all of the remaining pupils in any cohort.
Hutchinson et al. (Citation2020) also excluded non-standard schools like Pupil Referral Units (PRUs) from their figures, even though PRUs are part of the Pupil Premium scheme, and the number of pupils in PRUs can also change over time according to policy, practice and the prevalence of pupils needing PRUs. This affects the apparent attainment gap because potential PRU students tend to have lower average attainment, and be more likely to be disadvantaged. In years when more of such pupils are in mainstream settings their scores will increase the estimated gap. The same kind of thing can happen over time with intakes to special schools and hospitals.
Methods used in this study
The findings in this paper are about a stably disadvantaged group of pupils, now known to have been FSM-eligible for every year while at both primary and secondary school in England (11 years at school in total). This group – the permanently FSM-eligible – would have been labelled disadvantaged in any year and under any economic conditions. This group is compared to all of the other pupils in the relevant cohort, including those who had been temporarily FSM-eligible at any stage over their 11 years at school. As shown below, this approach is the strongest way to assess the impact of Pupil Premium, unaffected by economic, legal and other changes over time.
The datasets
The data comes from the combined National Pupil Database (NPD) datasets, held by DfE and accessed via the Office for National Statistics (ONS), for the Key Stage 4 (KS4) cohorts completing their KS4 school years at age 16 in 2010/11 to 2018/19. All pupils in state-maintained schools at KS4 are included (regardless of school type, including PRUs and special schools), but only those in the correct age band for that school year. Only the variables that appear for all year cohorts are used, for consistency.
In order to look at pupils for the 11 years they spent in primary and secondary schools, the 2011 KS4 cohort is the earliest we can use with reasonably complete information. So, the analysis is for the 2011 to 2019 KS4 cohorts, and the headline figures focus on those pupils known to be eligible for 11 years while at school in England. The latest year is 2019 because there was no statutory attainment data for England in 2020 (or 2021). These 2011–2019 KS4 cohorts would have completed KS2 (end of primary school) from 2006 to 2014. This gives us cohorts in school well before the Pupil Premium and for several years after. The focus of this paper is therefore on pupils at the end of primary school, who (we now know) would go on to be FSM-eligible for their entire time at school.
There was a widespread boycott of KS2 assessment in 2010, and this seems to have affected more than the recorded KS2 scores. The values for 2010 are therefore sometimes out of alignment with 2009 and 2011, and can be largely ignored here. We have previously run separate analyses looking at the pupils who were FSM-eligible only for the six years at primary school (Gorard et al., Citation2021), or for the five years at secondary school (Gorard, Citation2021), which allowed us to use KS4 cohorts 2006 to 2019. This paper presents the first set of results for the most stably disadvantaged comparison groups, and so provides the most accurate assessment so far of whether Pupil Premium had any impact on between-school segregation or the poverty attainment gap.
Analyses
We created new values from the existing datasets, including:
how many years each pupil had been FSM-eligible for, by each stage
the number of years that knowledge of FSM-eligibility was missing, for each stage
a new category of missing, for any key categorical variables that had missing values
a new flag variable for missing or not, for any key numeric variables that had missing values
the national rank of each pupil in terms of their KS2 average points scores
standardised z-scores from KS2 average points scores
value-added residuals for each pupil based on regression models linking their KS1 and KS2 scores (the models for each cohort predicted later attainment with R at or above 0.7)
a segregation residual for each pupil.
Each segregation residual was computed as the number of FSM-eligible pupils in an individual’s school, divided by the number of FSM pupils in all maintained schools in England. From this we subtracted the number of all pupils in the schools, divided by the number of pupils in all schools. This paper uses these residuals to assess national, regional and local authority figures for the segregation of long-term socio-economic disadvantage between schools (Gorard, Citation2018). The mean of these absolute values for any area is termed the (Gorard) Segregation Index.
Where appropriate, including for attainment gaps and when comparing the segregation index between two sub-groups of disadvantaged pupils, we created “effect” sizes, computed as the difference between the means for disadvantaged groups and the rest, divided by their overall standard deviation.
We ranked all pupils in each year by their KS2 average points, and computed the difference between the average rank for long-term disadvantaged pupils and the rest. This is the approach used by the DfE from 2014 onwards, which is claimed to overcome abrupt changes in metrics, caused by changes in grading and assessment formats.
We looked at the characteristics of permanently disadvantaged pupils in terms of sex, ethnicity, and special educational need status (SEN). SEN status was aggregated with codes A (school action), P (school action plus) and S (statemented) treated as SEN, and N (no SEN) or missing as not SEN. This was to create larger cell sizes, especially for comparisons. ONS/GDPR rules do not allow release of findings based on small cell sizes. We similarly use only the major ethnic groups – Asian, black, Chinese, mixed, other, and white – for the same reason. Of course, it would have been preferable to have results for separate south Asian groups such as Indian and Pakistani origin, and for separate black groups such as black African and black Caribbean origin. These sub-groups may well have produced disparate findings. We looked at the gaps in mean segregation indices and KS2 score outcomes, for each of these groups. We also looked at the same outcomes in terms of the nine Economic Areas of England.
Many of the findings are presented as time series graphs. Strictly, line graphs are not the most appropriate for nine years of data points, but they are more readable. We also adjust the y axis (height) to make the patterns as clear as possible, meaning that the origin of each graph is not always zero.
Stability of permanent disadvantage
We have shown in Gorard et al. (Citation2019) how closely the prevalence of pupils labelled FSM-eligible (or disadvantaged) is tied to their segregation between schools, for example. When the economy is poor, as it was following the downturn in 2008, there are more pupils registered as FSM-eligible, and these appear to be more evenly spread between schools. Of course, this is not largely due to people changing schools but to pupils becoming FSM-eligible in the schools they already attended, due to changes in their family employment or income. The reverse happens when the economy improves. In this paper we address this confound by focusing on pupils who are permanently labelled FSM-eligible (and so less susceptible to economic turbulence), and later by also comparing the changes over time in segregation and the attainment gap with changes in GDP.
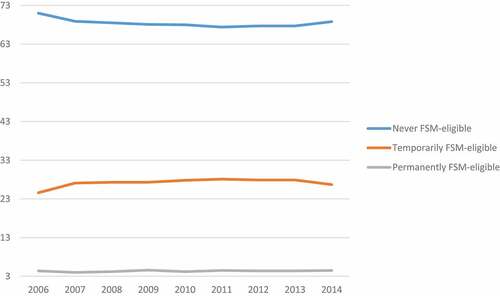
As noted above, in order to assess educational (rather than economic) changes over time, it is important to compare outcomes for a non-disadvantaged group with a disadvantaged group that would have been identified as such in any era. The group of pupils in any cohort who have been permanently FSM-eligible by the time they reach the end of KS4 is relatively stable over time (the lower line in ). This group of just over 4% of all pupils is largely unaffected by economic, political and legal changes. Therefore, we argue, they would have attracted Pupil Premium funding had it been available in any year, and under any conditions. The much larger group of temporarily FSM-eligible pupils (the middle line in ), who would have been eligible for some years while at school but not others, is much less stable. In the nine years for which we have full cohort data, their percentage ranges from around 24% to over 28%. This reflects changes in the legal definition of FSM-eligibility and in the economy (as discussed above). It means that some or even most of the annual variation in segregation and attainment gaps, as officially calculated, is attributable to changes in the proportion of the cohort attracting Pupil Premium, and nothing to do with the work of pupils, teachers and schools, or the impact of Pupil Premium funding. This temporary group cannot be used to make a fair assessment of the poverty attainment gap over time.
Figure 1. Percentage of all pupils of each FSM status, 2011 to 2019 KS4 cohorts.
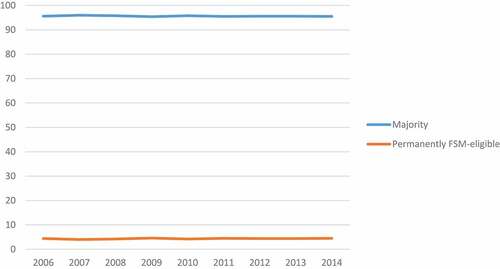
The even larger group of pupils who have never been FSM-eligible by the end of KS4 (the top line in ) is a mirror image of the proportion of temporarily eligible (because the small group of always eligible is so stable over time). Therefore, this group is also not a suitable comparator for assessing the poverty attainment gap because its size is affected by factors beyond schools’ control and largely unrelated to Pupil Premium funding. Comparing the never eligible pupils to all others is misleading because both groups will then have a size linked to economic and other non-educational changes. However, comparing the always eligible to only the never eligible (as EPI 2020 did) is equally problematic, because the latter group also changes so much. Instead, what this paper does, as suggested in Gorard et al. (Citation2019), is to compare the always eligible to everyone else. This creates two groups for comparison that are fairly stable over time (). The top line combines the never- and the only temporarily eligible pupils. It means that we can look at the impact of Pupil Premium funding unaffected by changes in legal definitions and economic fluctuations, because the smaller group would be labelled disadvantaged in any era and under any circumstances.
Figure 2. Percentage of all pupils of each FSM status, 2011 to 2019 KS4 cohorts.
Of course, adding the temporarily disadvantaged group to the majority comparator does not imply that they are not disadvantaged at all, or should not attract Pupil Premium funding. Nor does it suggest that the attainment gap should always be computed in this way. It will reduce the apparent size of the “real” gap. But it is a device used here for the purposes of research, to create a fair comparison group for assessing policy impact, given that an experiment or similar is no longer possible.
Pupil Premium status is based mostly on socio-economic disadvantage as represented by FSM eligibility, but it also includes pupils living in care, and there is a smaller Service Premium for those from Service families. We cannot look at these additional groups over the long term because the data on these is only available in NPD more recently. However, for the 2019 KS4 cohort, as an example, none of the 3,662 pupils (0.66% of the total) from Service families were long-term poor (and less than 0.003% had been in state care). This makes the Service Premium a separate issue from Pupil Premium, and is ignored hereon in this paper. For the same cohort, only 0.91% were looked after. But 10.4% of looked after pupils were long term poor (much higher than the overall 4.4% long-term poor). This suggests that the small number of looked after pupils are well represented in the disadvantaged group in .
The paper later considers outcomes for pupil sub-groups such as those identified as having a special educational need, from different ethnic origins, and in different areas of England. The composition of the long-term FSM-eligible group can change over time in terms of such sub-group characteristics, and so the analyses for these sub-groups do not have the same stable comparator as for the national figures. We already know that the prevalence of pupils with certain characteristics is linked to their patterns of segregation between schools (Gorard et al., Citation2019).
Segregation gap for permanently disadvantaged pupils
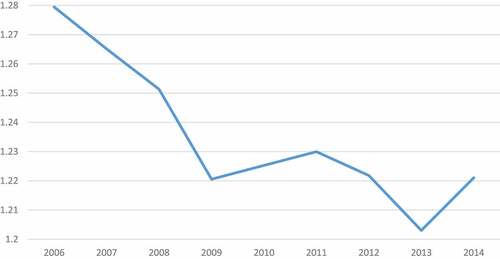
Our first set of substantive results concerns the extent to which long-term disadvantaged pupils are clustered in schools with other long-term disadvantaged pupils (as assessed by their mean segregation residuals). As might be expected, long-term disadvantaged pupils tend to go to schools with more pupils like themselves. And the not-disadvantaged and only temporarily disadvantaged pupils tend to go to schools with more not-disadvantaged and only temporarily disadvantaged pupils. For pupils in primary school in Year 6, the extent of this socio-economic segregation declined quite dramatically for the cohort that reached the end of KS2 from 2011 onwards (). These pupils would in fact have been the first year groups to do so after the Pupil Premium policy in 2011. The picture for the 2014 KS2 cohort including figures for the small number of looked after children is similar.
Figure 3. KS2 mean segregation residual for 11 year FSM-eligible pupils, 2006–2014.
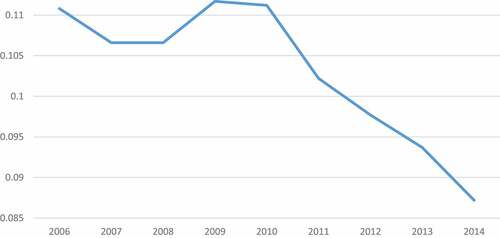
The picture is relatively flat until 2010 (around 11% of long-term disadvantaged pupils would have to exchange schools with a not-disadvantaged pupil to improve the situation). It then drops from 2011 (until by 2014 fewer than 9% of long-term disadvantaged pupils would have to exchange schools). The drop is not linked to changes in the economy (such as GDP change) or to the changing proportion of pupils in private education (Gorard et al., Citation2021). And it is possible to envisage how the Pupil Premium quickly made disadvantaged pupils more attractive to schools than they were previously because of the funding they bring with them. The picture might therefore be an indication of Pupil Premium impact. It would be useful to have data from further years.
The attainment gap for permanently disadvantaged pupils
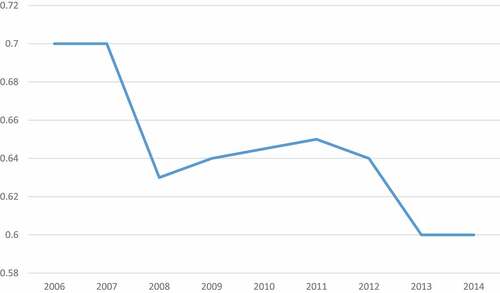
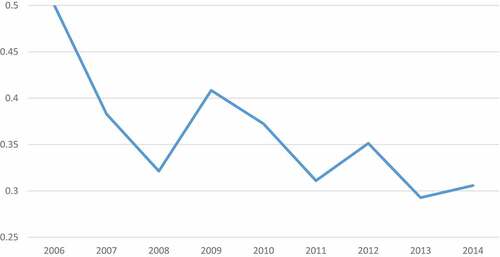
Turning to the poverty attainment gap, it is clear that something noteworthy has also happened at KS2. The decline of the long-term poverty attainment gap is most obvious for the 2008 cohort, and then again for cohorts from 2012 onwards (). As above, the drop after 2011 could be linked to the Pupil Premium. However, the 2008 KS4 cohort would involve pupils taking KS2 well before 2011. The curriculum for KS2, and so the nature of the assessment, began changing in England in 2014, and this could account for the drop in the attainment gap ceasing for the most recent cohort. The picture for the 2014 KS2 cohort including looked after pupils is again similar.
Figure 4. The attainment gap at KS2 between 11 year FSM-eligible pupils and the rest, KS2 2006 to 2014 cohorts.
Over time, the national KS2 poverty attainment gap correlates with the KS2 segregation index with a value of R = 0.75. This means that well over 50% of the variation in one is linked to variation in the other. As socio-economic segregation between schools has declined so has the attainment gap, in an erratic fashion (). This could be coincidence (but see below), or it could be the result of another factor. It is unlikely that a drop in the attainment is directly responsible for reducing segregation, but the reverse is more possible. If Pupil Premium funding did produce a drop in segregation this would mean that the most disadvantaged pupils were more evenly spread between schools. This could allow schools to focus help and interventions for some of the pupils more easily, such as those with the severest challenges or who could be seen as requiring more resource to reach any specified level of proficiency.
Figure 5. Scatterplot of segregation index and attainment gap, by year.
Characterising the permanently disadvantaged pupils
SEN
As might be expected, permanently disadvantaged pupils appear in about the same proportions as the majority of pupils in terms of some of their other characteristics, such as their reported sex, and these proportions remain the same across the KS2 cohorts 2006 to 2014. However, permanently disadvantaged pupils are more often reported as having a special educational need or disability (SEN) than the majority (Gorard et al., Citation2021), and this disproportion has generally grown across cohorts (). This growth is perhaps driven largely by growth in the national proportion of young people identified as facing a learning challenge. Non-SEN but long-term economically disadvantaged pupils remain at about the same and smaller proportion. The changes in composition of the long-term disadvantaged group mean that the patterns for segregation and attainment gaps over time (as below) are not based on stable comparison in the same way as the national figures are.
Figure 6. Percentage of SEN pupils also FSM-eligible for 11 years, 2007 to 2014 KS2 cohorts.
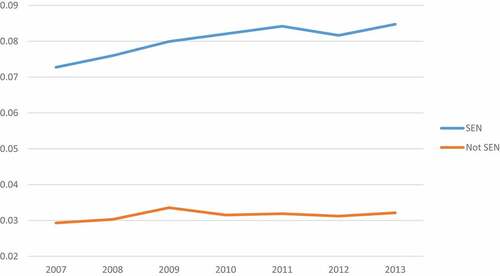
The segregation gap between long-term disadvantaged SEN and non-SEN pupils is high, suggesting that these two groups attend rather different sets of schools. However, there is a long-term decline in the segregation gap (). This long-term decline could be linked to the increase in the prevalence of SEN reporting amongst the long-term disadvantaged pupils (above), perhaps especially in mainstream primary school settings in the years 2006 onwards. There is also a discernible drop after 2011, but overall its scale in unremarkable.
Figure 7. Segregation gap for SEN pupils who are permanently FSM-eligible or not.
The attainment gap between long-term disadvantaged SEN and non-SEN pupils is also quite high, and again shows a decline that is not specifically associated with the Pupil Premium era (). Again, the trend is likely to be linked to the increase in SEN pupils who are also long-term poor.
Figure 8. KS2 attainment gap for SEN pupils who are permanently FSM-eligible or not.
Ethnic groups
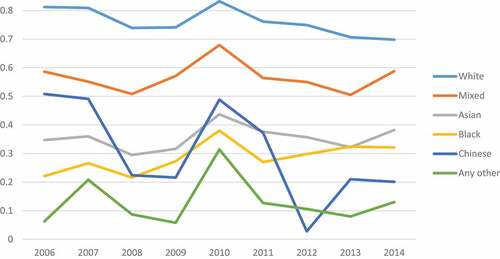
Historically, permanently disadvantaged pupils have been disproportionately from some ethnic minorities in England (especially Asian, black and mixed ethnicity), but this has declined markedly over time, alongside an increase of white permanently disadvantaged pupils (). As with the SEN analyses, these changes in composition mean that any comparisons over time between ethnic sub-groups are not based on stable comparators, and the changes could explain any differences over time in segregation or attainment gap outcomes for any ethnic group.
Figure 9. Percentage of each ethnic group also FSM-eligible for 11 years, 2007 to 2014 KS2 cohorts.
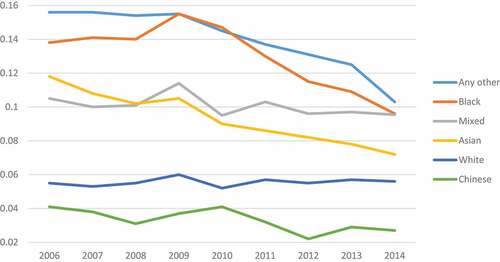
The segregation of long-term disadvantaged Asian, Black and Chinese pupils between schools in England has declined visibly since 2011 (). And this is despite them becoming a smaller proportion of the long-term disadvantaged group over time (above), which would normally (and all other things being equal) lead to an increase in estimates of segregation. Therefore, this reduction in segregation may be, at least in part, the result of Pupil Premium funding. Overall, schools are becoming slightly more mixed in intakes, in terms of poverty, ethnicity and special needs, as already portrayed using school-level data (e.g. Gorard, Citation2015). However, there is less of a decline in segregation (if at all) for the majority white origin long-term poor pupils. If the Pupil Premium has helped reduce ethnic and poverty segregation between schools then it is the Asian, black, Chinese, mixed and other groups of pupils who have been most affected so far.
Figure 10. Segregation gap for pupils of each ethnic group who are permanently FSM-eligible, or not.
Note: these are not gaps between ethnic groups, but gaps between long-term poor and others within each ethnic group.
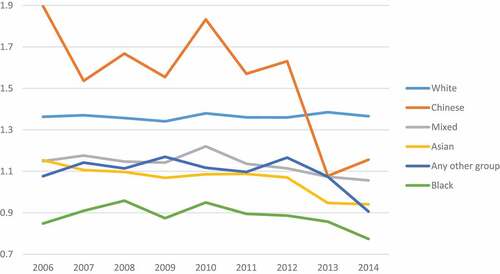
The attainment gap at KS2 between permanently FSM-eligible pupils and other pupils of Asian origin is lower than the national average (). The figures are volatile over time, but they are at a higher level than historically in 2014. The attainment gap for long-term poor black pupils is even lower than for poor Asian pupils. But again it has grown over time, even since 2011. Whatever benefits a decrease in segregation might bring these are not obvious in this attainment gap yet. The national (overall) decline in the KS2 attainment gap is really only visible for Chinese and white origin poor pupils, and the decline occurs both after 2007 and after 2011. More work is needed to understand this picture.
Figure 11. KS2 attainment gap for pupils of each ethnic group who are permanently FSM-eligible, or not.
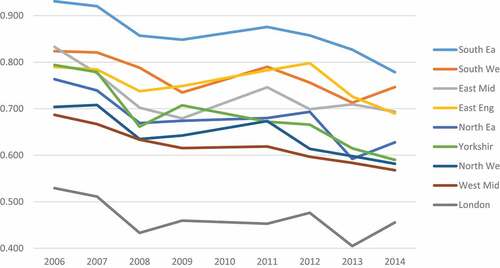
Regional variations
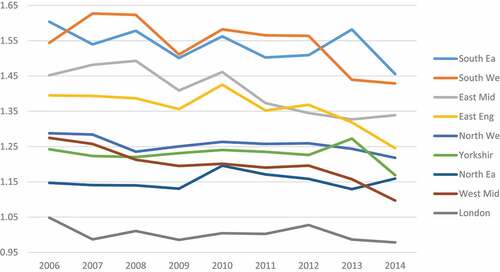
The gap in socio-economic segregation between schools, in terms of the most disadvantaged pupils, is lowest in areas where such pupils are most prevalent such as London, the North East and West Midlands (). It is highest in the South East, East, and South West of England. These areas have proportionately fewer long-term disadvantaged pupils. Segregation has declined in all areas since 2011, sometimes erratically.
Figure 12. KS2 11 year FSM segregation gap by economic area.
Note: As with all graphs in this paper, the key is in the same order as the appearance of the lines in 2014, from top to bottom
A similar picture is observed for the KS2 attainment gap, and again appears to be linked to the prevalence of long-term disadvantage (). The gap is highest in the South East and lowest in London and the West Midlands. The gap has declined over time, more erratically than segregation, in all areas and generally in line with the drop in poverty segregation, as also shown nationally (above).
Figure 13. KS2 11 year FSM attainment gap by economic area.
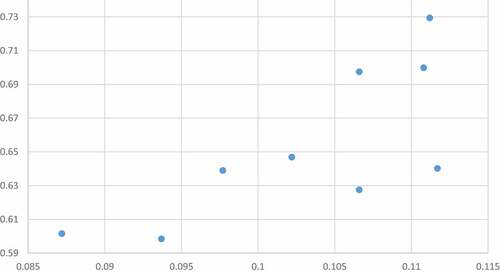
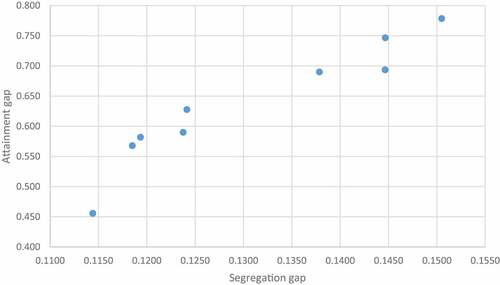
The geographical link between segregation and the attainment gap is very clear for the Economic Areas (even stronger than the link over time). If we cross-plot the figures for both values for the 2014 KS2 cohort (or indeed any cohort) there is a strongly linear relationship (). The figures correlate with R = +0.95. Clearly, areas with less segregation have correspondingly low attainment gaps between the long-term poor and the rest, and vice versa. This strengthens the finding of the relationship over time. Segregation appears to matter for educational outcomes as well as for social reasons (Gorard, Citation2018).
Figure 14. Scatterplot of segregation (x axis) by attainment gap (y axis) for economic areas.
Discussion
The good news is that national segregation and the long-term poverty attainment gap have declined over time and across regions, mostly in a way that can be associated specifically with the post-2011 Pupil Premium era. This has happened in all regions, and for students recognised as having a special educational need or disability (and segregation has also declined for all ethnic groups). This new picture should replace official versions based on an attainment gap that does not have before and after data, or which is sensitive to confounds such as economic and legal changes.
Using the most stable group of long-term disadvantaged students here focuses the comparisons over time on changes other than differences in the prevalence of official indicators of disadvantage caused by economic and legal changes over time. This means that the findings presented here are only about that sub-group. However, analyses we have presented elsewhere suggest that the same kind of improvements have occurred, for segregation and some Key Stages at least, for less permanently disadvantaged students as well (Gorard, Citation2021; Gorard et al., Citation2021).
There have been suggestions that the UK government is now less interested in the attainment gap than they were when Pupil Premium started, and is more interested in structural reforms like academisation (Whittaker, Citation2021). If so, the government is being supported in this by other commentators suggesting that Pupil Premium has not worked, or that the funding could be better used otherwise. However, this new study based on the largest possible dataset, over the longest possible time so far, comparing two stable groups, suggests that the policy is helping. It could be improved by calibrating the funds so that they are targeted more towards the permanently disadvantaged, and somewhat less towards the only temporarily disadvantaged. But the policy is worth pursuing for a few more cohorts at least, and then evaluating robustly again. The age cohort that arrived at school in 2011 is still in school. In policy terms, the Pupil Premium is actually still quite young.
It is relatively easy to envisage that allocating money like Pupil Premium funding to schools on the basis of their disadvantaged pupil intakes would make such pupils more attractive, and so could reduce their historic clustering in specific under-subscribed schools. One reason an over-subscribed school might be reluctant to offer places to poorer children (even if unconsciously) is that, on average, they could be harder to teach. The extra funding addresses that (as proposed by Freedman & Horner, Citation2008). An impact on segregation would simply require schools to allocate places partly taking the possibility of extra funding into account. The majority of admissions authorities in England are either Academies (or their chains) or community schools run by local authorities and faith-based organisations. They must use their published criteria to decide on oversubscribed school places, which can now include preference for pupils who are known to be eligible for the Pupil Premium (Gov.uk, Citationn.d.). Something like this appears to have happened, looking at the data here at a macro-level. Further in-depth investigation is needed to see if this really is the mechanism involved.
It is less likely that the mere existence of Pupil Premium funding would produce a reduction in the poverty attainment gap, and certainly not in the quick timeframe possible for a reduction in segregation. Of course, the funding might be effective simply by drawing attention to the gap. But it will more likely work on a longer-term basis by providing money for resources to address the gap. Ofsted uses the attainment gap as a factor in its inspections of schools. Schools are increasingly encouraged to ensure that the programmes they invest this extra funding in are “backed by evidence” (Schools Week, Citation2021a), and the most promising and wide-ranging evidence is available for the primary sector covered here, rather than for the secondary sector (Gorard, Citation2021). However, there are still disputes over what “backed by evidence” means (presumably robust, replicated, transferrable evidence), and it still seems that many schools are instead looking for “evidence” to deploy in support of what they want to do anyway (Gorard, Citation2020). There is limited but growing evidence of what has worked to improve the average attainment of poorer children. We need more of this robust evidence, and much more and better research on how to get that evidence into use most appropriately.
Segregation by poverty has declined for all groups covered in this paper, and in every area. And this decline is strongly correlated with a decline in the poverty attainment gap. When segregation is lower the attainment gap is lower. If the two are causally related it is far more likely that the decline in segregation has improved overall provision and led to a decline in the attainment gap than vice versa. This would be another reason to continue the policy, allowing schools to become more and more mixed, and see how much this leads to benefits in terms of attainment. One danger is that, even if the policy is retained, other education policies will be introduced that (inadvertently) start segregating students early in their lives again.
Segregation is lower and declining in areas of most long-term disadvantage, matched by lower attainment gaps in these areas as well. Policy-makers need to understand that areas like the West Midlands and North East of England, which have been criticised by the inspection regime Ofsted and others for apparently failing their students, are actually getting better results for long-term disadvantaged students than many other areas. Policy-makers and too many commentators are misled about the prevalence of long-term disadvantage, and the consequent challenges for schools, into believing that the local schools in poorer areas are somehow failing their pupils in a way that is not happening in the South East or South West. The wrong diagnosis must then lead to the wrong policy solutions.
If the improvements noted in this paper can be (at least partly) attributed to the Pupil Premium funding policy then there are also implications for school funding in other countries faced with similar issues. Given a choice between providing incentives for teachers, families or students, general funding for schools, and the kind of targeted resource represented by Pupil Premium funding, education systems should prefer the latter on the basis of the overall evidence. The funding must be tied to intakes (following students if they move) and not to areas, and its use must be exclusively for the most promising evidence-led resources and interventions.
Acknowledgments
This work contains statistical data from ONS, which is Crown Copyright. The use of the ONS statistical data in this work does not imply the endorsement of the ONS in relation to the interpretation or analysis of the statistical data. This work uses research datasets, which may not exactly reproduce National Statistics aggregates.
Thanks to Nadia Siddiqui and Beng Huat See for providing advice and help when planning this paper.
Disclosure statement
No potential conflict of interest was reported by the author(s).
References
- Alam, A., Baez, J., & Del Carpio, X. (2011). Does cash for schools influence young women’s behavior in the longer term? Evidence from Pakistan (Policy Research Paper No. 5669). World Bank.
- Angrist, J., & Lavy, V. (2009). The effects of high stakes high school achievement awards: Evidence from a randomized trial. American Economic Review, 99(4), 1384–1414. https://doi.org/10.1257/aer.99.4.1384
- Baker, B., Sciarra, D., & Farrie, D. (2014). Is school funding fair? A national report card. Education Law Center, Rutgers Graduate School of Education. https://edlawcenter.org/assets/files/pdfs/publications/Is_School_Funding_Fair_7th_Editi.pdf
- Barrera-Osorio, F., Cilliers, J., Cloutier, M., & Filmer, D. (2021). Heterogenous teacher effects of two incentive schemes. World Bank. https://openknowledge.worldbank.org/bitstream/handle/10986/35565/Heterogenous-Teacher-Effects-of-Two-Incentive-Schemes-Evidence-from-a-Low-Income-Country.pdf?sequence=1
- Barrett, D. (2018). The effective design, implementation and enforcement of socio-economic equality duties: Lessons from the pupil premium. Journal of Social Welfare and Family Law, 40(1), 57–77. https://doi.org/10.1080/09649069.2018.1414375
- Bastagli, F. (2010). Poverty, inequality and public cash transfers: Lessons from Latin America (Background Paper for the European Report on Development (ERD) 2010 on Social Protection for Inclusive Development). Florence: European University Institute. http://eprints.lse.ac.uk/36840
- Behrman, J., Parker, S., Todd, P., & Wolpin, K. (2015). Aligning learning incentives of students and teachers: Results from a social experiment in Mexican high schools. Journal of Political Economy, 123(2), 325–364. https://doi.org/10.1086/675910
- Bettinger, E. (2010). Paying to learn: The effect of financial incentives on elementary school test scores (NBER Working Paper No. 16333). National Bureau of Economic Research.
- Bhattacharya, S. (2021). Intergroup contact and its effects on discriminatory attitudes. Evidence from India (WIDER Working Paper 2021/42). United Nations University.
- Carpenter, H., Papps, I., Bragg, J., Dyson, A., Harris, D., Kerr, K., & Laing, K. (2013). Evaluation of pupil premium (DfE-RR282). Department for Education. https://assets.publishing.service.gov.uk/government/uploads/system/uploads/attachment_data/file/243919/DFE-RR282.pdf
- Cerna, L. (2013). The nature of policy change and implementation. OECD https://www.oecd.org/education/ceri/The Nature of Policy Change and Implementation.pdf
- Chaudry, A., & Wimer, C. (2016). Poverty is not just an indicator: The relationship between income, poverty, and child well-being. Academic Pediatrics, 16(3), S23–S29. https://doi.org/10.1016/j.acap.2015.12.010
- Children’s World Report. (2020). A unique worldwide view of children’s perspectives. https://isciweb.org/wp-content/uploads/2020/07/Summary-Comparative-Report-2020.pdf
- Clotfelter, C., Ladd, H., & Vigdor, J. (2005). Who teaches whom? Race and the distribution of novice teachers. Economics of Education Review, 24(4), 377–392. https://doi.org/10.1016/j.econedurev.2004.06.008
- Cooper, K., & Stewart, K. (2021). Does household income affect children’s outcomes? A systematic review of the evidence. Child Indicators Research, 41, 981–1005. https://doi.org/10.1007/s12187-020-09782-0
- Copeland, J. (2019). A critical reflection on the reasoning behind, and effectiveness of, the application of the Pupil Premium Grant within primary schools. Management in Education, 33(2), 70–76. https://doi.org/10.1177/0892020618781234
- Craske, J. (2018). ‘You can’t show impact with a new pair of shoes’: Negotiating disadvantage through Pupil Premium. Journal of Education Policy, 33(4), 526–557. https://doi.org/10.1080/02680939.2018.1435908
- Danhier, J. (2018). How big is the handicap for disadvantaged pupils in segregated school settings? British Journal of Educational Studies, 66(3), 341–364. https://doi.org/10.1080/00071005.2017.1322682
- DfE. (2014). Measuring disadvantaged pupils’ attainment gaps over time (updated): Statistical working paper. https://assets.publishing.service.gov.uk/government/uploads/system/uploads/attachment_data/file/398657/SFR_40_2014_Measuring_disadvantaged_pupils_attainment_gaps_over_time__updated_.pdf
- DfE. (2018a). Opportunity area programme. https://www.gov.uk/government/publications/opportunity-area-programme-research-and-analysis
- DfE. (2018b). Revised GCSE and equivalent results in England, 2016 to 2017 (SRF 01/2018). https://assets.publishing.service.gov.uk/government/uploads/system/uploads/attachment_data/file/676596/SFR01_2018.pdf
- DfE. (2019). Pupil premium: Funding and accountability for schools. https://www.gov.uk/guidance/pupil-premium-information-for-schools-and-alternative-provision-settings?utm_source=2e5c52b2-c00c-4268-82c5-e809ff49194d%26utm_medium=email%26utm_campaign=govuk-notifications%26utm_content=immediate#measuring-the-effectiveness-of-your-approach
- Dickerson, A., Maragkou, K., & McIntosh, S. (2018). The causal effect of secondary school peers on educational aspirations (CVER Discussion Paper Series - 2398-7553). Centre for Vocational Education Research. http://cver.lse.ac.uk/textonly/cver/pubs/cverdp017.pdf
- Education Endowment Foundation. (2017). The attainment gap. https://educationendowmentfoundation.org.uk/public/files/Annual_Reports/EEF_Attainment_Gap_Report_2018_-_print.pdf
- Education Policy Institute. (2017, August). Closing the gap? Trends in educational attainment and disadvantage. https://epi.org.uk/publications-and-research/closing-gaptrends-educational-attainment-disadvantage/
- Exley, S. (2015, February 4). Pupil premium ‘has failed to close attainment gap’, thinktank claims. Times Educational Supplement.
- Feng, L. (2014). Teacher placement, mobility, and occupational choices after teaching. Education Economics, 22(1), 24–47. https://doi.org/10.1080/09645292.2010.511841
- Freedman, S., & Horner, S. (2008). School funding and social justice. Policy Exchange. https://www.policyexchange.org.uk/wp-content/uploads/2016/09/school-funding-and-social-justice-oct-08-3.pdf
- Fryer, R. (2010). Financial incentives and student achievement: Evidence from randomized trials (NBER Working Paper No. 15898). National Bureau of Economic Research.
- Gorard, S. (2015). The complex determinants of school intake characteristics, England 1989 to 2014. Cambridge Journal of Education, 46(1), 131–146. https://doi.org/10.1080/0305764X.2015.1045446
- Gorard, S. (2018). Education policy: Evidence of equity and effectiveness. Policy Press.
- Gorard, S. (2020). Handling missing data in numeric analyses. International Journal of Social Research Methods, 23(6), 651–660. https://doi.org/10.1080/13645579.2020.1729974
- Gorard, S. (2021). What is the evidence on the impact of Pupil Premium funding on school intakes and attainment by age 16 in England? [Working Paper available from the author].
- Gorard, S., & See, B. H. (2013). Do parental involvement interventions increase attainment? A review of the evidence. The Nuffield Foundation. http://www.nuffieldfoundation.org/sites/default/files/files/Do_parental_involvement_interventions_increase_attainment1.pdf
- Gorard, S., See, B. H., & Siddiqui, N. (2017). The trials of evidence-based education. Routledge.
- Gorard, S., & Siddiqui, N. (2019). How trajectories of disadvantage help explain school attainment. SAGE Open. https://doi.org/10.1177/2158244018825171
- Gorard, S., Siddiqui, N., & See, B. H. (2019). The difficulties of judging what difference the Pupil Premium has made to school intakes and outcomes in England. Research Papers in Education, 36(3), 355–379. https://doi.org/10.1080/02671522.2019.1677759
- Gorard, S., Siddiqui, N., & See, B. H. (2021). Assessing the impact of Pupil Premium funding on primary school segregation and attainment. Research Papers in Education. Advance online publication. https://doi.org/10.1080/02671522.2021.1907775
- Gorard, S., & Smith, E. (2010). Equity in education. Palgrave.
- Gov.uk. (2010) Government announces pupil premium to raise achievement. https://www.gov.uk/government/news/government-announces-pupil-premium-to-raise-achievement
- Gov.uk. (n.d.). School admissions. https://www.gov.uk/schools-admissions/admissions-criteria
- Hanushek, E., Peterson, P., Talpey, L., & Woessmann, L. (2019). The achievement gap fails to close: Half century of testing shows persistent divide between haves and have-nots. Education Next, 19(3), 8–17. http://hanushek.stanford.edu/publications/achievement-gap-fails-close-half-centurytesting-shows-persistent-divide-between-haves
- Henry, G., Fortner, C., & Thompson, C. (2010). Targeted funding for educationally disadvantaged students: A regression discontinuity estimate of the impact on high school student achievement. Educational Evaluation and Policy Analysis, 32(2), 183–204. https://doi.org/10.3102/0162373710370620
- Hewstone, M., Ramiah, A., Schmid, K., Floe, C., van Zalk, M., Wolfer, R., & New, R. (2018). Influence of segregation versus mixing: Intergroup contact and attitudes among White-British and Asian-British students in high schools in Oldham, England. Theory and Research in Education, 16(2), 179–203. https://doi.org/10.1177/1477878518779879
- Holford, A. (2015). The labour supply effect of education maintenance allowance and its implications for parental altruism (IZA Discussion Paper No. 8822). SSRN. https://ssrn.com/abstract=2564955
- Holmlund, H., McNally, S., & Viarengo, M. (2010). Does money matter for schools? Economics of Education Review, 29(6), 1154–1164. https://doi.org/10.1016/j.econedurev.2010.06.008
- Hutchinson, J., Reader, M., & Akhal, A. (2020). Education in England: Annual report 2020. Education Policy Institute.
- Lavy, V. (2002). Evaluating the effect of teachers’ group performance incentives on pupil achievement. Journal of Political Economy, 110(6), 1286–1317. https://doi.org/10.1086/342810
- Long, R., & Danechi, S. (2020). Special educational needs and disability support. House of Commons Library https://commonslibrary.parliament.uk/special-educational-needs-and-disability-support-rescuing-the-reforms/
- Lorenz, G., Boda, Z., Salikutluk, Z., & Jansen, M. (2020). Social influence or selection? Peer effects on the development of adolescents’ educational expectations in Germany. British Journal of Sociology of Education, 41(5), 643–669. https://doi.org/10.1080/01425692.2020.1763163
- Mbiti, I., Muralidharan, K., Romero, M., Schipper, Y., Manda, C., & Rajani, R. (2019). Inputs, incentives, and complementarities in education: Experimental evidence from Tanzania. The Quarterly Journal of Economics, 134(3), 1627–1673. https://doi.org/10.1093/qje/qjz010
- Minorini, P., & Sugarman, S. (1999). School finance litigation in the name of educational equity: Its evolution, impact, and future. In H. Ladd, R. Chalk, & J. Hansen (Eds.), Equity and adequacy in education finance: Issues and perspectives (pp. 34–71). National Research Council.
- National Audit Office. (2015, June). Funding for disadvantaged pupils. https://www.nao.org.uk/wp-content/uploads/2015/06/Fundingfor-disadvantaged-pupils.pdf
- Public Accounts Committee. (2015, October 9) Funding for disadvantaged pupils (HC 327).
- Reichelt, M., Collischon, M., & Eberl, A. (2019). School tracking and its role in social reproduction: Reinforcing educational inheritance and the direct effects of social origin. The British Journal of Sociology, 70(4), 4. https://doi.org/10.1111/1468-4446.12655
- Riccio, J., Dechausay, N., Greenberg, D., Miller, C., Rucks, Z., & Verma, N. (2010). Toward reduced poverty across generations: Early findings from New York City’s conditional cash transfer program. MDRC.
- Roberts, N., Foster, D., & Long, R. (2021). The Pupil Premium. House of Commons Library Briefing Paper 6700.
- Schools Week. (2021, March 31). Schools face new checks to ensure pupil premium spending ‘backed by evidence’. Schools Week.
- Social Mobility Commission. (2019). State of the nation 2018-19. https://assets.publishing.service.gov.uk/government/uploads/system/uploads/attachment_data/file/798404/SMC_State_of_the_Nation_Report_2018-19.pdf
- Tao, L., Li, H., Rozelle, S., & Zhang, L. (2010 Cash incentives, peer tutoring, and parental involvement: A study of three educational inputs in a randomized field experiment in China. International initiative for impact evaluation. https://www.researchgate.net/profile/Linxiu-Zhang/publication/265006043_Cash_Incentives_Peer_Tutoring_and_Parental_Involvement_A_Study_of_Three_Educational_Inputs_in_a_Randomized_Field_Experiment_in_China/links/543bb0b00cf24a6ddb97864a/Cash-Incentives-Peer-Tutoring-and-Parental-Involvement-A-Study-of-Three-Educational-Inputs-in-a-Randomized-Field-Experiment-in-China.pdf
- Toutkoushian, R., & Michael, R. (2007). An alternative approach to measuring horizontal and vertical equity in school funding. Journal of Education Finance, 32(4), 395–421. https://eric.ed.gov/?id=EJ761694
- Whittaker, F. (2021, March 5). Narrowing attainment gap stopped being ‘main focus’ of DfE in 2015, says former permanent secretary. Schools Week. https://schoolsweek.co.uk/narrowing-attainment-gap-stopped-being-main-focus-of-dfe-in-2015-says-former-permanent-secretary/