
 ?Mathematical formulae have been encoded as MathML and are displayed in this HTML version using MathJax in order to improve their display. Uncheck the box to turn MathJax off. This feature requires Javascript. Click on a formula to zoom.
ABSTRACT
In the educational literature on peer effects, attention has been brought to the fact that the mechanisms creating peer effects are still to a large extent hidden in obscurity. The hypothesis in the study reported in this article was that the Frame Factor Theory (FFT) can be used to reveal such mechanisms. Using data from the Swedish TIMSS 2015 (N = 3761 students in 179 classes), a multilevel structural equation model (M-SEM) was specified in accordance with the FFT. As predicted, the SEM-model verified a strong relationship between class composition and a latent variable of limitations on instruction, a variable which in turn had a great impact on individual students’ results in TIMSS 2015. The study hereby seems to reveal a fundamental mechanism of peer effects and provides evidence for the FFT.
Introduction
For more than 50 years, there has been extensive research conducted into peer effects in education, with many researchers pointing to the Coleman-report (Citation1966) as a starting point in the US (Barr & Dreeben, Citation1977; Zimmerman, Citation2003). In educational research, the topic of interest has been labelled “compositional”, “contextual” or “structural” effects (Dreeben & Barr, Citation1988), while economists speak of “peer effects” (Arnott & Rowse, Citation1987; Epple & Romano, Citation2011; Yeung & Nguyen-Hoang, Citation2016). Yet, the issue at the heart of the research remains the same: How important are classmates for individual students’ results?
The combined literature on peer effects is extensive, but researchers have drawn attention to the fact that
there has been much less investigation of the ways in which they [peer effects] operate in schools or of their effects on school functioning or pupil progress. (Rutter & Maughan, Citation2002, p. 469)
Other studies have indicated that peer effects also might arise through the compositional effect that the class has upon the teacher’s instruction. Evidence of such effects was early reported by Bourke (Citation1986). In his study, Bourke showed that the average student ability in class, mediated by class size, affected teaching practices. This, in turn, affected student achievement. Further evidence of such effects was reported by Blatchford et al. (Citation2003), Garrison (Citation2004) and Blatchford et al. (Citation2007). Such a compositional effect has also been hypothesised by Thrupp (Citation1999). Referred to as the “school composition effect”, the hypothesis is that compositional effects on achievement are mediated by effects on processes such as organisational, pedagogical (instruction) or psychosocial (classroom environment). The hypothesis was empirically tested and confirmed by Thrupp et al. (Citation2002) and Dumay and Dupriez (Citation2007). Similar results were reported by Opdenakker and Damme (Citation2006).
In the study reported in this article, Lundgren's (Citation1972) Frame Factor Theory was applied to the issue of peer effects, as an attempt to enhance the theoretical understanding and thus explore their mechanisms. Building on Carroll (Citation1963), the theory predicts that class composition (mainly measured as prerequisite knowledge and aptitude) will steer and limit teachers’ instruction in class, in turn affecting student achievement. The theory was tested in a multilevel structural equation model using data from the Swedish TIMSS (Trends in International Mathematics and Science Study) 2015. The reported null-model showed that 27.4% of the variance in student achievement could be attributed to the between-class level. The full structural equation model explained 25.3% of this variance with the latent variable “Limitations on Instruction”, specified in accordance with the Frame Factor Theory, being the strongest predictor of achievement. Thus, the study seems to provide evidence of how compositional effects affect instruction, generating peer effects on individual outcomes.
The frame factor theory
As mentioned, several studies indicate that one important mechanism generating peer effects is the compositional effect the average class ability has upon teachers’ instruction. This indicates that the teachers’ practice in class to some extent is dependent on class composition. In contrast, the well-known theory of Mastery Learning (ML), formulated by Bloom (Citation1974, Citation1984), advocates a view that the teacher’s instruction should be independent of class composition (Barr & Dreeben, Citation1977). Hence, the ML-recommendations of individualised, sequenced and cumulative learning with teachers tutoring rather than instructing students (Block & Burns, Citation1976; Bloom, Citation1984). The significant keywords above are “should be” independent; researchers have contested whether this is even possible in real life, since classroom management is in fact a collective activity (Arlin, Citation1984; Barr & Dreeben, Citation1977; Dahllöf, Citation1999), or as put by Nuthall:
In order to take responsibility for a class of 25–35 students who have different knowledge, skills, interests, and motivations, teachers have to develop ways of managing the class as a whole. It is impossible to focus on the individual learning of any one student for more than very brief periods. (Nuthall, Citation2005, p. 903)
A common ground for both ML and the Frame Factor Theory (FFT) is Carroll’s (Citation1963) model of school learning. At the heart of the model is a notion of the relation between time needed (TN) for students to learn a specific unit in the curriculum (CU), and the actual time at hand (TA). If the time available is less than the time needed, then students will not learn:
As mentioned above, Bloom’s ML-conclusion is that time available therefore must be individualised for each student. The FFT on the other hand is based on a view that classroom management and instruction is a collective practice (Dahllöf, Citation1967; Lundgren, Citation1972). Therefore, the theory is based on the hypothesis that the class-aggregated time needed (measured as prerequisite knowledge) will steer and limit (i.e. frame!) what teachers are able to do in terms of instruction. As Lundgren showed in his empirical study, this includes content, methods, timing and pacing of instruction (Lundgren, Citation1972). An original paradigm of the FFT is depicted in .
Figure 1. Paradigm of the Frame Factor model (Lundgren, Citation1972, p. 43).
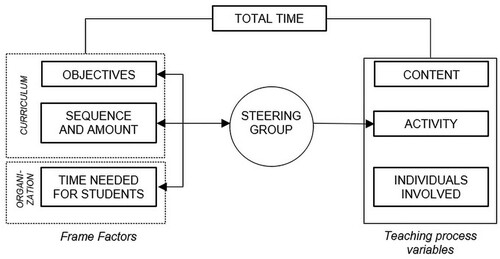
As shown in , the FFT hypothesises that the teacher’s instruction in class will be steered and limited by a steering criterion group (SCG). According to the hypothesis, the SCG consists of the pupils between the 10th and 25th percentile of aptitude in the class. Teachers will – mostly subconsciously – use the advancement of this group to make decisions about content, methods, timing and pacing of the instruction, decisions which will affect all students in class. The SCG-hypothesis originates from Dahllöf (Citation1967, Citation1970) and is supported empirically by Lundgren (Citation1972).
As a result, research into peer-effects in general, and research employing the FFT in particular, relates to other research fields such as Opportunity to Learn (OTL), effects of classroom heterogeneity and ability grouping. By combining results from these fields, several contradicting results are revealed. For instance, Beckerman and Good (Citation1981) reported evidence that both high- and low-aptitude students benefited from attending more favourable classes (measured as the share of high- and low-aptitude students in class). Similar results have been reported by Schindler Rangvid (Citation2007), Ammermueller and Pischke (Citation2009) and Yeung and Nguyen-Hoang (Citation2016). Yet other research, into the effects of classroom heterogeneity, has reported that classroom heterogeneity does not have a negative effect on students’ outcome measured as students’ conceptual understanding (Decristana et al., Citation2017), neither has ability grouping any effects – neither positive nor negative – on students’ outcomes (Slavin, Citation1990).
Aim of the study
Given the different and somewhat contradicting results from previous research referred to above, there is a need of theoretical synthesis of different research fields which all relate to the issue of how important classmates are for individual students’ results. As referred above, there is reason to believe that some of this potential effect on student outcomes is mediated through the compositional effect on teachers’ instructional practices in class (Blatchford et al., Citation2007; Bourke, Citation1986; Dumay & Dupriez, Citation2007; Evertson et al., Citation1981; Opdenakker & Damme, Citation2006; Thrupp et al., Citation2002). In the study presented in this article, the FFT was applied to the issue of peer effects to initiate such a synthesis. Since peer effects are compositional effects, they occur on the between-class level. The hypothesis, therefore, was that between-class variance in student achievement could to some extent be explained by the steering and limiting effect the SCG had upon teachers’ instruction. This hypothesis was tested in the study. The research questions for the study reported were:
How does class composition affect teachers’ instruction?
If teachers’ instruction is affected by class composition, does this then affect students’ results?
Method
Data set and sample
The study was conducted using data from the Swedish TIMSS 2015 (Trends in International Mathematics and Science Study). The dataset contained mathematic test results and survey data for 4090 students in 8th grade (on average 14 years old) and their 200 teachers in mathematics (Foy, Citation2017; Mullis & Hooper, Citation2016; Skolverket, Citation2016). Data on 8th grade were chosen for several reasons, including the fact that previous studies have shown that TIMSS test items have a stronger correlation to the Swedish 8th grade curricula than the 4th grade curricula (Skolverket, Citation2016).
Since the study was concerned with compositional effects in classroom instruction, there had to be more than a few students in the included classes. Only intact classes were included in the dataset. Descriptive statistical analysis revealed classes with missing data on class size, which therefore were excluded. Also, classes with less than 13 students proved to a large extent to be outliers in several variables included in the statistical modelling and of test results in mathematics (in the Swedish case, these classes are often for students with special needs or even located in smaller resource schools). These classes were therefore also excluded. The final dataset contained 3761 students in 179 classes, representing 92% of the students and 87% of the classes in the original sample. The gross and net sample is reported in along with some descriptive statistics. Data were weighted using “house weights” on the between-class level (Rutkowski et al., Citation2010).
Table 1. Descriptive statistics for gross and net sample in the study.
Operationalisation and measures
According to the FFT, the average ability of the SCG will steer and limit the teacher’s instruction in class. Here, ability is defined and operationalised as prerequisite knowledge. One major problem in the study was that the data lacked measures of students’ actual prior knowledge in mathematics. The problem was solved by aggregating the mean test results of the SCG for each class, which is a somewhat similar approach to that which Kang (Citation2007) used to study the importance of peers’ academic achievements in TIMSS for individual students’ own test results. It could be argued that this approach is insufficient, and that it could represent a circular argument where actual results are being used to explain actual results. But this was not the case in the analysis. First, the mean score of the SCG was only used as an independent variable, which the latent dependent variable “Limitations on Instruction” was regressed on. Individual test results were in turn regressed on that latent variable. Second, the mean score of the SCG only concerns some of the students, whilst this level in turn was used to explain the presence of limiting factors on instruction for the whole class. Third, the procedure was also based on previous research reporting strong correlations between prior knowledge and results (Nilsson & Tindrebäck, Citation2013; Seery, Citation2009), which implies that this proxy in fact would show a high correlation to actual prior knowledge if such measures could have been attained. One could argue that the third argument is insufficient, for example since Seery (Citation2009) reports evidence based on high-stakes tests when TIMSS in fact is a low-stake test. Previous research has shown that this influences students’ motivation of taking low-stakes tests (Eklöf & Knekta, Citation2017), which in the Swedish case also seems to have some minor effects on students’ results (Skolverket, Citation2015). Other studies in the Swedish setting have reported strong correlations between students’ mathematical results in TIMSS, their final grades in mathematics (r = 0.74) and high-stakes national tests in mathematics (r = 0.73) (Wiberg, Citation2019). This suggests that correlations between test results and actual prior knowledge also should be strong.
In the TIMSS 2015 teacher survey, there are several variables that measure different limiting aspects on instruction. These include disruptive classroom behaviour, lack of prerequisite knowledge and lack of student motivation. The following variables were used to specify a latent variable of “Limitations on Instruction” (LIMIT_INSTR):
In your view, to what extent do the following limit how you teach this class?
− Students lacking prerequisite knowledge or skills (BTBG15A),
− Students suffering from a lack of sleep (15C),
− Disruptive students (15D) and
− Uninterested students (15E).
The respondents answered in a Likert scale ranging from “not at all” (1) to “a lot” (3). The Cronbach’s Alpha was 0.756.
The FFT also hypothesises that one of the mechanisms creating peer effects is that the limitations on instruction, originating from the level of the SCG, will steer the time spent on elementary and advanced curricula units and also the number of advanced units being covered in instruction (Lundgren, Citation1972). The higher the level of the SCG in class, the more time will be spent on more advanced and complex units.
In TIMSS 2015, there are some basic data on curricula coverage, but these survey items only concern whether a topic has been addressed in class or not, not how much time has been spent on the topic or in what way the topic was handled by the teacher. These variables were therefore assessed as not being theoretically adequate for the study at hand. In accordance with previous research (Hansson, Citation2010, Citation2012), two latent variables measuring teacher responsibility of learning were therefore specified using variables from the teacher survey. As Hansson has reported, the dimensions of teacher responsibility differ between classes due to their composition. Therefore, one latent variable was specified to measure the presence of “teacher responsibility for content” (T_INSTR), which was intended to capture responsibility for elementary parts of the curricula. The variables chosen for this latent variable were:
In teaching mathematics to this class, how often do you ask students to do the following?
− Listen to me explain new mathematical content (BTBM18A),
− Listen to me explain how to solve problems (18B) and
− Memorise rules, procedures, and facts (18C).
The respondents answered in a Likert scale ranging from “never” (1) to “every lesson” (4). The Cronbach’s Alpha was 0.728.
Another latent variable was specified to measure the presence of more “Advanced Instruction” (T_ADVAN). The variables chosen for this latent variable were:
How often do you do the following when teaching this class?
− Ask students to complete challenging exercises that require them to go beyond the instruction (BTBG14C),
− Ask students to decide their own problem-solving procedures (BTBG14F) and
− Ask students to work on problems for which there is no immediately obvious method of solution (BTBM18G).
The respondents answered in a Likert scale ranging from “never” (1) to “every lesson” (4). The Cronbach’s Alpha was 0.749.
The FFT hypothesises that teachers’ instruction to some extent is dependent on class composition. In that sense, the FFT contradicts Bloom’s ML-assumption of teachers’ instructional independence of class composition. But in this respect, the FFT also stands in contrast to some OTL-research. For instance, Klapp and Jönsson (Citation2020) report results from a survey amongst Swedish students in 9th grade in which low-achieving students perceive that they primarily receive “simplified support” instead of “scaffolding support”, where the former consists of lowered standards and lowered expectations (thereby limiting the students’ opportunities to learn) and the latter consisting of “communicating expectations, helping students to structure their work, giving feedback, and building relationships”. Since such aspects – expectations, structuring work, explaining new concepts, giving feedback – have been shown to be positively related to students’ outcomes (Hattie, Citation2009; Rubie-Davies, Citation2010), it was deemed that a latent variable had to be specified to capture these dimensions so that the analysis could relate such dimensions to the dimension of limitations on instruction according to the FFT. By doing so, the study at hand could be able to contribute further to the understanding of such results as presented by Klapp and Jönsson (Citation2020); why would this happen within the teachers’ instructional practices? How is students’ perception of these aspects related to the possible limiting effect class composition has upon teachers’ instruction? Empirical (and to some extent theoretical) explanations of this phenomena can be found in previous research (Blatchford et al., Citation2007; Bourke, Citation1986; Garrison, Citation2004), but by specifying such a latent variable, from the student surveys, some synthesis of results could be made possible.
Following results from the research of Rubie-Davies, discussed in Rubie-Davies (Citation2010), one latent variable of such, “Instruction According to Students” (ST_INSTR), was specified using variables from the student survey. The variables chosen for this latent variable were:
How much do you agree with these statements about your mathematics lessons?
− My teacher is easy to understand (BSBM18B),
− My teacher has clear answers to my questions (18E),
− My teacher is good at explaining mathematics (18F),
− My teacher does a variety of things to help us learn (18H) and
− My teacher tells me how to do better when I make a mistake (18I)
In , descriptive statistics for all variables, including manifest control variables, are reported along with Cronbach Alpha values for each forthcoming latent variable (e.g. set of indicators).
Table 2. Descriptive statistics for all variables in the analysis.
Validity and reliability
Since the study is based on secondary data (Johnston, Citation2014; Smith, Citation2008), there is a need for a thorough discussion of validity and reliability. First, how well does TIMSS 2015 correspond to the Swedish lower secondary curricula in mathematics? Analyses from the Swedish National Agency for Education [Skolverket] show that the outcomes that are measured in TIMSS do correspond to the curricula, especially for 8th grade (in comparison to 4th grade which is also included in TIMSS). Although, all parts of the curricula aren’t measured (Skolverket, Citation2016). Similar results are reported by Sollerman (Citation2019).
Second, how well does TIMSS 2015 correspond to other measures of mathematic performance in Sweden? Sweden has had a long continuous decline in performance between 2000 and 2012 in both PISA and TIMSS. The same trends were reported in several other studies, suggesting a good external validity and reliability in TIMSS (Henrekson & Jävervall, Citation2016; Skolverket, Citation2014).
Third, are the surveys in TIMSS valid? In a study, Marsh et al. (Citation2013) reported that differences in students’ motivation for school work could to some extent be explained by specific contextual factors for different countries and the usage of language in the TIMSS-survey. Despite this, they reported that correlations between motivation and test results were similar between countries in TIMSS. Similar results are reported for Sweden (Eklöf & Knekta, Citation2017) and in other international studies (Smith & López-Castro, Citation2017). Results of such give some support to the external validity and reliability of TIMSS, but it is important to point out that the validity of different questionnaire scales is not directly generalisable to the scales used in this study.
With this said, the trends of Swedish students’ motivation, as measured by TIMSS, are also verified in Swedish longitudinal surveys, further indicating external validity and reliability of the TIMSS-survey (Skolverket, Citation2019).
One concern with the validity of student surveys in TIMSS – as with all self-reported survey data – regards questions about students’ educational resources and their parents’ educational background. There are studies that have reported significant errors in measurement concerning these survey items (Engzell, Citation2019; Engzell & Jonsson, Citation2015), indicating a risk of underestimation of such effects. In the study reported in this article, correlation analysis was conducted to ensure that the measures of home educational resources that were used as independent control variables in the model at least showed expected correlations. The final model in reports on these correlations. No other considerations were made.
Table 3. Results for all structural equation models (M1-4).
Regarding the reliability of TIMSS, and the variables used in the analysis, Cronbach’s’ Alpha measures have already been reported for each of the latent variables. They were assessed as being good enough for proceeding with the model since α = 0.7 < (Abedi & Baker, Citation1995; Ahmad et al., Citation2016; Bryman, Citation2008).
Data analysis
Peer effects are a result of pupils having peers. Thus, peer effects originate from the between-classroom variation. An analysis of peer effects therefore has to employ a multilevel approach to be able to handle both the selection problems in school systems (Manski, Citation1993; Sund, Citation2009) and the natural nested multilevel structure of school data (Heck et al., Citation2010; Hox, Citation2010).
In the study reported in this article, Multilevel Structural Equation Modeling (M-SEM) was employed, using MPLUS 8.2 with multilevel add-on. Data preparation was done using SAS Enterprise Guide 7.15.
Structural Equation Modeling (SEM) has grown rapidly within educational research (Gustafsson, Citation2009; Wang et al., Citation2017), mainly due to its flexible ability to combine the handling of complex relations between dependent and independent variables, mediation analysis and analysis of latent variables (Kline, Citation2015). SEM also provides useful tools for ensuring construct validity and reliability due to its inherent ways of testing internal consistency between multiple indicators (Abedi, Citation2002; Abedi & Baker, Citation1995; Marsh & Hau, Citation2007; Zhao & Gallant, Citation2012).
The aim of the study was to test the FFT’s ability to reveal and explain the mechanisms of peer effects. Variables in the analysis were therefore chosen in accordance with the theory. The SEM-framework – with its basis in Confirmatory Factor Analysis (CFA) – was therefore considered a suitable methodology (Kline, Citation2015).
Results
As a first step in multilevel analysis, an empty null-model is set up to investigate what variance in student results can be attributed to the within- and between-class levels. Such an analysis revealed an intraclass correlation coefficient (ICC) of 27.4%, a level which is similar to previous research into peer effects (Opdenakker & Damme, Citation2006; Rutter & Maughan, Citation2002). This means that about one fourth of the variance in individual students’ results could be attributed to which class the student attends.
The main variance of interest in the analysis, in reference to the aim of the study, was the variance on the between-class level. To clarify, the aim of the study was to explain this variance with a SEM-model derived from the FFT.
Measurement model
In SEM, the first step is to build a measurement model. The idea is to test whether the theorised model, with its latent variables, fits the data (Kline, Citation2015). Several measures are investigated to evaluate whether the model fits data or not. If it fits, then the dependent variable (in this case students’ test results) is introduced into a full structural equation model. If not, either a new model must be derived from the theory or the theory must be modified or rejected (Gustafsson, Citation2009; Kline, Citation2015).
In , the measurement model is reported. Maximum likelihood estimation with robust standard errors (MLR) was used for estimation. All reported coefficients are standardised (STDYX in MPLUS). The coefficients are significant (p < 0.05) if nothing else is stated. The left-hand side of the model holds the within-class level. The right-hand side holds the between-class level.
Figure 2. Results for the measurement model.
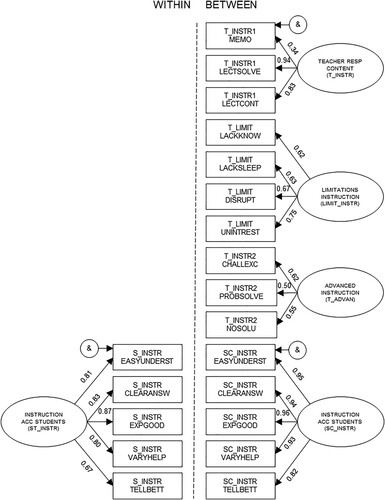
The fit indices reveal that the model had a good fit to data. This conclusion though, was not supported by the χ2-analysis which reported a high (χ2 = 371.9, df = 89) and significant (p = 0.000) value, indicating that the measurement model and actual data were significantly diverse from one another. This result was expected though, since the χ2-test is sensitive to large sample sizes (Gustafsson, Citation2009; Kline, Citation2015; Wang et al., Citation2017).
Apart from the χ2-test, all other indices revealed good or excellent model fit (Gustafsson, Citation2009; Hu & Bentler, Citation1999; Kline, Citation2015; Wang et al., Citation2017). The Root Mean Square Error of Approximation (RMSEA) was 0.029 (recommended < 0.05) and the Comparative Fit Index (CFI) was 0.972 (0.95 <), which suggested good model fit. The Standardized Root Mean Square Residual (SRMR) suggested a somewhat better fit on the within-class level (0.026) than on the between-class level (0.071) (recommended < 0.08), a result which was similar to those reported by Hansson (Citation2010, Citation2012) for her model.
Starting on the within-class level, the analysis showed that the latent variable (ST_INSTR) explained most of the variance in the variables concerning the teacher’s clear answers and good explanations, with standardised factor loadings of 0.83 and 0.87 respectively. The least of the variance was explained in the feedback variable that the teacher tells students what they can do better, with a factor loading of 0.67.
The same latent variable, but on the between-class level (SC_INSTR), explained even more of the variance in the manifest variables. All factor loadings but one exceeded 0.90.
Continuing with the between-class level, the analysis showed that each latent variable explained less variance in some of the manifest variables. One example is T_INSTR which only explained 11.6% of the variance (.34*.34) in the manifest variable measuring how often students are asked to memorise rules, procedures and facts. In general, these lower factor loadings for a few of the variables might explain the somewhat lower SRMR-value for the between-class level than the within-class level.
Structural equation model
Since the fit indices reported a good model fit to data, the complete structural equation model was tested. The dependent variable with student test results (BSMMAT)Footnote1 was introduced and a stepwise approach was employed. Four models were estimated (M1-4), with control variables and mediation tests added successively. The results and fit indices from the stepwise analysis are reported in .
In M1 the latent variables were used to estimate the dependent variable, without controls and tests for mediation. In M2 mediation tests for the latent variable “Limitations on Instruction” (LIMIT_INSTR), “Teacher Responsibility for Content” (T_INSTR) and “Advanced Instruction” (T_ADVAN) were added stepwise. Since the coefficients weren’t affected, the full mediating M2-model is reported in . As reported in , the mediation analysis had practically no impact on the estimated effect of “Limitations on Instruction” (LIMIT_INSTR) on the dependent variable (from −0.56 in M1 to −0.55 in M2). This is of great importance in reference to the research questions and the predictions done according to the FFT. This is discussed below.
In M3 controls were added on the within-class level and in M4 for the between-class level. As reported in , the final controls on the between class-level reduced the negative effect of “Limitations on Instruction” (LIMIT_INSTR) to some extent, from −0.54 in M3 to −0.43 in M4.
In , the complete model is reported. The figure has been somewhat simplified to facilitate the interpretation. All indicators of the latent variables, as depicted in , have been left out in (even though they were in the analysis).
Figure 3. Final structural equation model (M4). * = non-significant effects (p > 0.05).
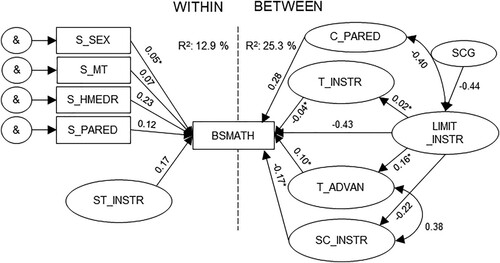
As reported in , the latent variable “Limitations on Instruction” (LIMIT_INSTR) had a great impact on students’ results (−0.43), a variable which in turn was affected by the level of the SCG (−0.44). These effects were all controlled for the mean level of parental education in class (C_PARED, 0.28). This was the main finding in the study. As hypothesised by the FFT, the steering and limiting effect class composition has upon teachers’ instruction seems to be a highly significant, and theoretically relevant, mechanism of peer effects in education. Similar results concerning school compositional effects were reported by Opdenakker and Damme (Citation2006).
An interesting result in the analysis concerns the latent variable “Instruction According to Students” (ST_INSTR). On the within-class level, under control of student characteristics, the latent variable showed a positive effect (0.17) on students’ test results (the effect was equal to the combined effect of parents’ educational background (0.12) and students’ sex (0.05) and was similar to those reported in earlier studies (Hattie, Citation2009; Rubie-Davies, Citation2010). But on the between-class level, the same aggregated latent variable (SC_INSTR) showed a non-significant negative effect (−0.17) on students’ test results. This result seems to have implications regarding teachers’ management of classrooms, which will be discussed further on in the article.
Even though the measurement model indicated that the two latent variables of teachers’ instruction, (T_INSTR) and (T_ADVAN), did capture different dimensions of teacher responsibility in instructionFootnote2 (Hansson, Citation2010), the structural equation model revealed that, firstly, the latent variable of limitations on instruction had no effect on the two mentioned variables and, secondly, that the two latent variables in turn had no effect on students’ test results.
As seen in , the model was specified with mediation analysis (Baron & Kenny, Citation1986; Field, Citation2018; Hayes & Matthes, Citation2009) between LIMIT_INSTR and the two latent variables of teachers’ instruction, T_INSTR and T_ADVAN. The analysis indicated that none of the original effects of “Limitations on Instruction” (LIMIT_INSTR) were mediated through T_INSTR or T_ADVAN.
These results contradict the expected results according to the FFT. Two alternative interpretations are suggested. Either the predictions of the FFT are incorrect or the latent variables T_INSTR and T_ADVAN were not able to capture the dimensions of instruction implied by the FFT. The first interpretation would imply that the FFT is refuted, the second that the two latent variables have a poor construct validity. Regarding the problem with use of secondary data, that data has been gathered for other purposes than for the study at hand, I argue that the second interpretation is more plausible in reference to reported results and previous research concerning the FFT (Lundgren, Citation1972).
In total, the structural equation model explained 12.9% of the within class variance and 25.3% of the between-class variance in individual TIMSS-results. These results are comparable with several previous studies of school compositional effects (Dumay & Dupriez, Citation2007; Opdenakker & Damme, Citation2006).
Discussion and future research
The study reported in this article provides some evidence on the mechanisms of peer effects in education. Given the cross-sectional design of TIMSS, the possibilities of drawing causal conclusions are limited. But since the results are in line with previous findings on compositional effects in education (Beckerman & Good, Citation1981; Rutter & Maughan, Citation2002; Yeung & Nguyen-Hoang, Citation2016), and their relation to compositional effects on teachers’ instructional practices (Bourke, Citation1986; Dumay & Dupriez, Citation2007; Evertson et al., Citation1981; Garrison, Citation2004; Lundgren, Citation1972; Thrupp et al., Citation2002) the results seem to verify the relation between class composition, teachers’ instructional practices and students’ outcomes.
By applying Lundgren’s (Citation1972) Frame Factor Theory (FFT) to the issue of peer effects, the study verified the prediction that some peer effects seem to arise due to the steering and limiting effect class composition has upon instruction. In reference to the research questions, the study revealed that class composition affects teachers’ instruction which in turn affects students’ results. The study also verified the Steering Criterion Group-hypothesis (SCG); the steering and limiting effect on instruction can be predicted by the mean level of the students in the 10th-25th percentile of aptitude in class. Hereby, the study also supports previous findings – but with another theoretical outlook – from research into school compositional effects (Dumay & Dupriez, Citation2007; Garrison, Citation2004; Opdenakker & Damme, Citation2006; Thrupp et al., Citation2002).
One FFT-prediction that the study could not verify was the modus operandi of the limitations on instruction. According to the FFT, the level of the SCG will affect the content, timing and pacing of instruction. Lundgren (Citation1972) operationalised this phenomenon in curricula units covered, their level of complexity and time spent. With no adequate data of such in TIMSS 2015, two latent variables capturing different dimensions of teachers’ instruction were specified in reference to previous research (Hansson, Citation2010, Citation2012). But the structural equation model revealed no relations or effects as predicted by the FFT. Even though the measurement model showed good fit to data, it is impossible to rule out the possibility of poor construct validity for these two latent variables (T_INSTR and T_ADVAN) in reference to the FFT. This conclusion summons future research into peer effects and the FFT to further investigate whether such effects can be verified.
With this said, the study did verify previous research implying that disruptive classroom behaviour is one of several mechanisms generating peer effects (Aizer, Citation2009; Cheema & Kitsantas, Citation2014; Lavy et al., Citation2011; Lazear, Citation2001), since such variables were included in the latent variable (LIMIT_INSTR).
In reference to previous research into the importance of teachers’ classroom practices (Hattie, Citation2009; Rubie-Davies, Citation2010), the model also included a latent variable measuring “Instruction According to Students” (ST_INSTR). Interestingly, the analysis revealed a significant positive effect (0.17) on the within-class level, but a similar opposing – though non-significant – negative effect (−0.17) on the between-class level. One proposed interpretation is that this yet again indicates that teachers’ instruction in class is dependent on the composition of the class (Dreeben & Barr, Citation1988; Nuthall, Citation2005; Weinert et al., Citation1989). What teachers do in class affects individual students’ learning, but in managing a whole class, the teacher is somewhat bound by the instructional conditions set by the composition of the class and aggregated prerequisite knowledge. Such an interpretation is supported by the fact that the latent variable of “Limitations on Instruction” (LIMIT_INSTR) had a negative effect (−0.22) on the aggregated variable of “Instruction According to Students” (SC_INSTR) on the between-class level. These results therefore summon future research into peer-effects, opportunity to learn and compositional effects to further try to synthesise theoretical perspectives and empirical estimation to enhance our understanding of the mechanisms of peer-effects.
Disclosure statement
No potential conflict of interest was reported by the author(s).
Correction Statement
This article has been corrected with minor changes. These changes do not impact the academic content of the article.
Additional information
Funding
Notes
1 In TIMSS IEA employs a method of “plausible values” (PV), i.e estimations of plausible values for each student. This is done so each student doesn’t have to answer each question in the test, thereby saving time. In TIMSS, five different PVs are reported (BSMMAT01-05) for each student. When analysing the results, MPLUS can be programmed to run the SEM-model on each PV and then report the mean estimated effect on the PVs. The fit indices are reported as means for each PV with a standard deviation between the estimates. This is reported in .
2 This was also confirmed with correlation analysis since R = 0.03 (p > 0.05).
References
- Abedi, J. (2002). A latent-variable modeling approach to assessing reliability and validity of a creativity instrument. Creativity Research Journal, 14(2), 267–276. http://doi.org/10.1207/S15326934CRJ1402_12
- Abedi, J., & Baker, E. L. (1995). A latent-variable modeling approach to assessing interrater reliability, topic generalizability, and validity of a content assessment scoring rubric. Educational and Psychological Measurement, 55(5), 701–715. http://doi.org/10.1177/0013164495055005001
- Ahmad, S., Zulkurnain, N., & Khairushalimi, F. (2016). Assessing the validity and reliability of a measurement model in Structural Equation Modeling (SEM). British Journal of Mathematics & Computer Science, 15(3), 1–8. http://doi.org/10.9734/bjmcs/2016/25183
- Aizer, A. (2009). Peer effects and human capital accumulation: The externalities of ADD. Cambridge: NBER Working paper no. 14354.
- Ammermueller, A., & Pischke, J. S. (2009). Peer effects in European primary schools: Evidence from the progress in international reading literacy study. Journal of Labor Economics, 27(3), 315–348. http://doi.org/10.1086/603650
- Arlin, M. (1984). Time, equality, and mastery learning. Review of Educational Research, 54(1), 65–86. http://doi.org/10.3102/00346543054001065
- Arnott, R., & Rowse, J. (1987). Peer group effects and educational attainment. Journal of Public Economics, 32(3), 287–305. http://doi.org/10.1016/0047-2727(87)90034-x
- Baron, R. M., & Kenny, D. A. (1986). The moderator-mediator variable distinction in social psychological research: Conceptual, strategic, and statistical considerations. Journal of Personality and Social Psychology, 51(6), 1173–1182. http://doi.org/10.1037/0022-3514.51.6.1173
- Barr, R., & Dreeben, R. (1977). Instruction in classrooms. Review of Research in Education, 5, 89–162. http://doi.org/10.2307/1167173
- Bäckström, P. (2020). School composition, disruptive classroom behaviour and student results: A study of mechanisms of peer effects. Nordic Studies in Education, 41(2), 167–184. http://doi.org/10.23865/nse.v41.2965
- Beckerman, T. M., & Good, T. L. (1981). The classroom ratio of high- and low-aptitude students and its effect on achievement. American Educational Research Journal, 18(3), 317–327. http://doi.org/10.3102/00028312018003317
- Blatchford, P., Edmonds, S., & Martin, C. (2003). Class size, pupil attentiveness and peer relations. British Journal of Educational Psychology, 73(1), 15–36. http://doi.org/10.1348/000709903762869897
- Blatchford, P., Russell, A., Basset, P., Brown, P., & Martin, C. (2007). The effect of class size on the teaching of pupils aged 7-11 years. School Effectiveness and School Improvement, 18(2), 147–172. http://doi.org/10.1080/09243450601058675
- Block, J. H., & Burns, R. B. (1976). Mastery learning. Review of Research in Education, 4, 3–49. http://doi.org/10.2307/1167112
- Bloom, B. (1974). Time and learning. American Psychologist, 29(9), 682–688. http://doi.org/10.1037/h0037632
- Bloom, B. (1984). The 2 sigma problem: The search for methods of group instruction as effective as one-to-one tutoring. Educational Researcher, 13(6), 4–16. http://doi.org/10.3102/0013189 ( 013006004
- Bourke, S. (1986). How smaller is better: Some relationships between class size, teaching practicies, and student achievment. American Educational Research Journal, 23(4), 558–571. http://doi.org/10.3102/00028312023004558
- Bryman, A. (2008). Social research methods. Oxford University Press.
- Carroll, J. B. (1963). A model of school learning. Teachers College Record: The Voice of Scholarship in Education, 64(8), 1–9. http://doi.org/10.1177/016146816306400801
- Cheema, J., & Kitsantas, A. (2014). Influences of disciplinary classroom climate on high school student self-efficacy and mathematics achievment: A look at gender and racial differences. International Journal of Science and Mathematics Education, 12(5), 1261–1279. http://doi.org/10.1007/s10763-013-9454-4
- Coleman, J. S., Campbell, E. Q., Hobson, C. J., McPartland, J., Mood, A. M., Weinfeld, F. D., & York, R. L. (1966). Equality of educational opportunity. US Department of Health, Education and Welfare.
- Dahllöf, U. (1967). Skoldifferentiering och undervisningsförlopp. Almqvist & Wiksell.
- Dahllöf, U. (1970). Curriculum process analysis and comparative evaluation of school systems. Paedagogica Europaea, 6, 21–36. http://doi.org/10.2307/1502497
- Dahllöf, U. (1999). Det tidiga ramfaktorteoretiska tänkandet. En tillbakablick. Pedagogisk forskning i Sverige, 4(1), 5–29.
- Decristana, J., Fauth, B., Kunter, M., Büttner, G., & Kliemec, E. (2017). The interplay between class heterogeneity and teaching quality in primary school. International Journal of Educational Research, 86, 109–121. http://doi.org/10.1016/j.ijer.2017.09.004
- Dreeben, R., & Barr, R. (1988). Classroom composition and the design of instruction. Sociology of Education, 61(3), 129–142. http://doi.org/10.2307/2112622
- Dumay, X., & Dupriez, V. (2007). Accounting for class effect using the TIMSS 2003 eighth-grade database: Net effect of group composition, net effect of class process, and joint effect. School Effectiveness and School Improvement, 18(4), 383–408. http://doi.org/10.1080/09243450601146371
- Eklöf, H., & Knekta, E. (2017). Using large-scale educational data to test motivation theories: A synthesis of findings from Swedish studies on test-taking motivation. International Journal of Quantitative Research in Education, 4(1/2), 52–71. http://doi.org/10.1504/ijqre.2017.10007536
- Engzell, P. (2019). What do books in the home proxy for? A cautionary tale. Sociological Methods & Research, 50(4), 1487–1514. http://doi.org/10.1177/0049124119826143
- Engzell, P., & Jonsson, J. O. (2015). Estimating social and ethnic inequality in school surveys: Biases from child misreporting and parent nonresponse. European Sociological Review, 31(3), 312–325. http://doi.org/10.1093/esr/jcv005
- Epple, D., & Romano, R. (2011). Peer effects in education: A survey of the theory and evidence. In J. Benhabib (Ed.), Handbook of social economics (pp. 1053–1163). Elsevier. http://doi.org/10.1016/b978-0-444-53707-2.00003-7
- Evertson, C. M., Sanford, J. P., & Emmer, E. T. (1981). Effects of class heterogeneity in junior high school. American Educational Research Journal, 18(2), 219–232. http://doi.org/10.3102/00028312018002219
- Field, A. (2018). Discovering statistics using IBM SPSS statistics (5th ed.). SAGE.
- Foy, P. (2017). TIMSS 2015 user guide for International database. IEA.
- Garrison, W. (2004). Profiles of classroom practices in U.S. Public schools. School Effectiveness and School Improvement, 15(3-4), 377–406. http://doi.org/10.1080/09243450512331383252
- Gustafsson, J.-E. (2009). Strukturella ekvationsmodeller. In G. Djurfeldt & M. Barmark (Eds.), Statistisk verktygslåda 2 - multivariat analys (pp. 269–321). Studentlitteratur.
- Hansson, Å. (2010). Instructional responsibility in Mathematics education: Modelling classroom teaching using Swedish data. Educational Studies in Mathematics, 75(2), 171–189. http://doi.org/10.1007/s10649-010-9249-2
- Hansson, Å. (2012). The meaning of mathematics instruction in multilingual classrooms: Analyzing the importance of responsibility for learning. Educational Studies in Mathematics, 81(1), 103–125. http://doi.org/10.1007/s10649-012-9385-y
- Hattie, J. (2009). Visible learning: A synthesis of over 800 meta-analyses relating to achievement. Routledge.
- Hayes, A., & Matthes, J. (2009). Computational procedures for probing interactions in OLS and logistic regressions: SPSS and SAS implementations. Behavior Research Methods, 41(3), 924–936. http://doi.org/10.3758/BRM.41.3.924
- Heck, R. H., Thomas, S. L., & Tabata, L. N. (2010). Multilevel and longitudinal modeling with IBM SPSS. Routledge Academic.
- Henrekson, M., & Jävervall, S. (2016). Svenska skolresultat rasar – vad vet vi? Kungliga Ingenjörsvetenskapsakademien (IVA).
- Hox, J. J. (2010). Multilevel analysis. Techniques and applications. Taylor & Francis Group.
- Hu, L-T, & Bentler, P. M. (1999). Cutoff criteria for fit indexes in covariance structure analysis: Conventional criteria versus new alternatives. Structural Equation Modeling: A Multidisciplinary Journal, 6(1), 1–55. http://doi.org/10.1080/10705519909540118
- Johnston, M. P. (2014). Secondary data analysis: A method of which the time has come. Qualitative and Quantitative Methods in Libraries, 3(3), 619–626.
- Kang, C. (2007). Academic interactions among classroom peers: A cross-country comparison using TIMSS. Applied Economics, 39(12), 1531–1544. http://doi.org/10.1080/00036840600606328
- Klapp, A., & Jönsson, A. (2020). Scaffolding or simplifying: Students’ perception of support in Swedish compulsory school. European Journal of Psychology of Education, 36(4), 1055–1074. http://doi.org/10.1007/s10212-020-00513-1
- Kline, R. B. (2015). Principles and practice of structural equation modeling. The Guilford Press.
- Lavy, V. M., Paserman, D., & Schlosser, A. (2011). Inside the black box of ability peer effects: Evidence from variation in the proportion of low achievers in the classroom. The Economic Journal, 122(559), 208–237. http://doi.org/10.1111/j.1468-0297.2011.02463.x
- Lazear, E. P. (2001). Educational production. The Quarterly Journal of Economics, 116(3), 777–803. http://doi.org/10.1162/00335530152466232
- Lundgren, U. P. (1972). Frame factors and the teaching process. A contribution to curriculum theory and theory on teaching. Göteborgs universitet.
- Manski, C. F. (1993). Identification of endogenous social effects: The reflection problem. The Review of Economic Studies, 60(3), 531–542. http://doi.org/10.2307/2298123
- Marsh, H. W., Abduljabbar, A. S., Abu-Hilal, M. M., Morin, A. J., Abdelfattah, F., Leung, K. C., Xu, M. K., Nagengast, B., & Parker, P. (2013). Factorial, convergent, and discriminant validity of TIMSS math and science motivation measures: A comparison of Arab and Anglo-Saxon countries. Journal of Educational Psychology, 105(1), 108–128. http://doi.org/10.1037/a0029907
- Marsh, H. W., & Hau, K.-T. (2007). Applications of latent-variable models in Educational Psychology: The need for methodological substantive synergies. Contemporary Educational Psychology, 32(1), 151–170. http://doi.org/10.1016/j.cedpsych.2006.10.008
- Mullis, M. M., & Hooper, I. V. (2016). Methods and procedures in TIMSS 2015. TIMSS & PIRLS International Study Center, Boston College. http://timssandpirls.bc.edu/publications/timss/2015-methods.html.
- Nilsson, H., & Tindrebäck, S. (2013). Utvärdering av det diagnostiska provet i matematik för gymnasieskolan ht 2012. Sweco.
- Nuthall, G. (2005). The cultural myths and realities of classroom teaching and learning: A personal journey. Teachers College Record, 107(5), 895–934. http://doi.org/10.1111/j.1467-9620.2005.00498.x
- Opdenakker, M.-C., & Damme, J. V. (2006). Differences between secondary schools: A study about school context, group composition, school practice, and school effects with special attention to public and catholic schools and types of schools. School Effectiveness and School Improvement, 17(1), 87–117. http://doi.org/10.1080/09243450500264457
- Rubie-Davies, C. M. (2010). Teacher expectations and perceptions of student attributes: Is there a relationship? British Journal of Educational Psychology, 80(1), 121–135. http://doi.org/10.1348/000709909 ( 466334
- Rutkowski, L., Gonzalez, E., Joncas, M., & von Davier, M. (2010). International large-scale assessment data: Issues in secondary analysis and reporting. Educational Researcher, 39(2), 142–151. http://doi.org/10.3102/0013189X10363170
- Rutter, M., & Maughan, B. (2002). School effectiveness findings 1979–2002. Journal of School Psychology, 40(6), 451–475. http://doi.org/10.1016/s0022-4405(02)00124-3
- Schindler Rangvid, B. (2007). School composition effects in Denmark: Quantile regression evidence from PISA 2000. Empirical Economics, 33(2), 359–388. http://doi.org/10.1007/s00181-007-0133-6
- Seery, M. K. (2009). The role of prior knowledge and student aptitude in undergraduate performance in chemistry: A correlation-prediction study. Chemistry Education Research and Practice, 10(3), 227. http://doi.org/10.1039/b914502h
- Skolverket. (2014). Grundskolan i internationella kunskapsmätningar – kunskap, skolmiljö och attityder till lärande. Rapport 407.
- Skolverket. (2015). Att svara eller inte svara. Svenska elevers motivation att genomföra PISA-provet.
- Skolverket. (2016). TIMSS 2015. Svenska grundskoleelevers kunskaper i matematik och naturvetenskap i ett internationellt perspektiv. Skolverket.
- Skolverket. (2019). Attityder till skolan. Rapport 479.
- Slavin, R. E. (1990). Achievement effects of ability grouping in secondary schools: A best-evidence synthesis. Review of Educational Research, 60(3), 471–499. http://doi.org/10.3102/00346543060003471
- Smith, E. (2008). Pitfalls and promises: The use of secondary data analysis in educational research. British Journal of Educational Studies, 56(3), 323–339. http://doi.org/10.1111/j.1467-8527.2008.00405.x
- Smith, P. K., & López-Castro, L. (2017). Cross-National data on victims of bullying: How does PISA measure up with other surveys? An update and extension of the study by Smith, Robinson, and Marchi (2016). International Journal of Developmental Science, 11(3-4), 87–92. http://doi.org/10.3233/dev-170227
- Sollerman, S. (2019). Kan man räkna med PISA och TIMSS? Relevansen hos internationella storskaliga mätningar i matematik i en nationell kontext. Stockholms universitet.
- Sund, K. (2009). Estimating peer effects in Swedish high school using school, teacher, and student fixed effects. Economics of Education Review, 28(3), 329–336. http://doi.org/10.1016/j.econedurev.2008.04.003
- Thrupp, M. (1999). School making a difference: Let's be realistic! school-mix, school effectiveness and the social limits of reform. Open University Press.
- Thrupp, M., Lauder, H., & Robinson, T. (2002). School composition and peer effects. International Journal of Educational Research, 37(5), 483–504. http://doi.org/10.1016/S0883-0355(03)00016-8
- Wang, J., Hefetz, A., & Liberman, G. (2017). Applying structural equation modelling in educational research. Cultura y Educación, 29(3), 563–618. http://doi.org/10.1080/11356405.2017.1367907
- Weinert, F. E., Schrader, F. W., & Helmke, A. (1989). Quality of instruction and achievement outcomes. International Journal of Educational Research, 13(8), 895–914. http://doi.org/10.1016/0883-0355(89)90072-4
- Wiberg, M. (2019). The relationship between TIMSS mathematics achievements, grades, and national test scores. Education Inquiry, 10(4), 328–343. http://doi.org/10.1080/20004508.2019.1579626
- Yeung, R., & Nguyen-Hoang, P. (2016). Endogenous peer effects: Fact or fiction? The Journal of Educational Research, 109(1), 37–49. http://doi.org/10.1080/00220671.2014.918528
- Zhao, J., & Gallant, D. J. (2012). Student evaluation of instruction in higher education: exploring issues of validity and reliability. Assessment & Evaluation in Higher Education, 37(2), 227–235. http://doi.org/10.1080/02602938.2010.523819
- Zimmerman, D. J. (2003). Peer effects in academic outcomes: Evidence from a natural experiment. The Review of Economics and Statistics, 85(1), 9–23. http://doi.org/10.1162/003465303762687677