
ABSTRACT
The present study uses meta-analysis to synthesise findings involving 480 effect sizes from 97 studies (dated 2000-2020) to provide insights on associations between school socioeconomic status (SES) and (a) student learning outcomes; (b) schools’ percentage of ethnic minority students and students’ prior ability; and (c) school processes in K-12 schools. It makes three contributions to the school SES scholarship. First, it elucidates the magnitude (r = .58) and nature of school SES effects (e.g. larger effect sizes for achievement (vis-à-vis attainment) outcomes). Second, it clarifies the conceptual meaning of school SES, namely that school SES is less associated with school processes than it is with schools’ percentage of ethnic minority students or students’ prior ability. Third, the study shows that school SES is more strongly associated with specific school processes (school leadership and climate, teacher capacity, parental involvement benefiting student learning) than others (instructional programmes, educational resources).
The Coleman Report (Coleman et al., Citation1966) is one of the most influential educational publications in the last fifty years (Hanushek, Citation2016). The report involving data from more than 3,000 schools and about 600,000 students in the US found that schools had little influence on student achievement after students’ family and social backgrounds were accounted for. For example, compared to school and classroom instructional processes, the mean level of student SES (i.e. school SES) and ethnic composition in schools explain a greater proportion of the variation in student learning outcomes. Implications of the study are stark; some have argued for school desegregation while others have highlighted the importance of families and irrelevance of schools (Perry & McConney, Citation2010).
Since the Coleman Report, decades of research have investigated the relationship between school SES and students’ learning outcomes (Early et al., Citation2020; Kim, Citation2019; Kim et al., Citation2019; Sirin, Citation2005). Students’ SES refers to their relative access to valued economic, cultural, and social resources that contribute to valued life outcomes. It is commonly measured using parental educational attainment, family income, parental occupational status, and home resources. School SES refers to the mean level of student SES in a school. Researchers measure school SES by averaging students’ SES levels within a school or by using other school-level variables such as parental education, family income, home possessions, percentage of students on free/reduced-price lunch or schooling (FRL), Title 1/non-Title 1 school classification (Sirin, Citation2005; van Ewijk & Sleegers, Citation2010).
There is evidence that compared to student SES, school SES is more strongly associated with students’ learning outcomes (OECD, Citation2016; Sirin, Citation2005). For example, Borman and Dowling’s (Citation2010) reanalysis of Coleman and colleagues’ original data using the same model specification but with a more advanced statistical technique (multilevel regression) found that schools’ social composition (students’ social class, race/ethnicity) was 1.75 times more important than students’ individual social and racial/ethnic background in explaining the variation in students’ learning outcomes. Relatedly, Sirin’s (Citation2005) meta-analysis reported a mean effect size of r = .73 for the relationship between school SES and students’ learning outcomes (e.g. achievement) in the US vis-à-vis r = .30 for the relationship between student SES and their learning outcomes.
Researchers have sought to investigate how and why school SES levels are associated with students’ learning outcomes (i.e. the school SES effect). Studies have generally found a positive association between school SES and students’ learning outcomes (Sirin, Citation2005; van Ewijk & Sleegers, Citation2010; Willms, Citation2010). On the one hand, school SES researchers recognise the importance of school SES and therefore, identify processes underpinning the school SES effect (Akay & Karadag, Citation2019; Li, Citation2018; Mitchell et al., Citation2016; Park et al., Citation2017; Xuan et al., Citation2019; Zhu et al., Citation2019). However, most scholars focus on specific processes instead of examining a comprehensive gamut of processes, thereby precluding the identification of more important influences. On the other hand, school SES research has been criticised on theoretical and methodological grounds (Armor et al., Citation2018; Zhou & Ma, Citation2021). For example, researchers sometimes make erroneous individual-level inferences from group aggregated data (Robinson, Citation1950). Specifically, a positive association between school SES and mean performance level does not mean that student SES is associated with student achievement. Other concerns with school SES research include school-level SES measures suffering from poor reliability (Marks, Citation2015) and model misspecification arising from omitted student variables (e.g. schools’ percentage of ethnic minority students, students’ prior ability) (Lauen & Gaddis, Citation2013; Marks, Citation2015; Mickelson et al., Citation2013; Snijders & Bosker, Citation2012).
The present study acknowledges these controversies and employs meta-analysis to clarify associations between school SES and (a) students’ learning outcomes; (b) schools’ percentage of ethnic minority students and students’ prior ability; and (c) school processes. The use of meta-analysis enables us to synthesise findings from the large number of studies examining school SES that have reported different patterns of results for the association between school SES and student outcomes. It also enables us to compare the magnitude of associations between school SES and different school processes. The study is important for two reasons. First, some scholars argue that, compared to school processes, family processes are more powerful predictors of student outcomes, especially when schools become more homogenous due to globalisation (Dumont & Ready, Citation2020; Heyneman, Citation2015), so ascertaining the strength of associations between school SES and students’ learning outcomes will contribute to the scholarship on the role of schools in student learning. Second, the present study unravels the “black box” (van Ewijk & Sleegers, Citation2010, p. 135) of processes associated with high-SES schools, thereby justifying policy interventions for the implementation of these processes in schools to improve student learning.
School SES indicators
Researchers measuring school SES using the average SES level of students within a school reduce measurement errors associated with measures of individual student SES, thereby producing more reliable estimates of school SES. The present study clarifies if school SES effect sizes reported in studies vary with types and the number of school SES indicators used (i.e. parental education, family income, home possessions, percentage of students on free/reduced-price lunch or schooling (FRL), Title 1/non-Title 1 school classification, combination of indicators). van Ewijk and Sleegers' (Citation2010) meta-analysis of the relationship between students’ peer SES (including classmates’ and school SES) and achievement found that studies reported larger effect sizes if peer SES was measured using a composite (vis-à-vis separate indicators).
The percentage of students qualifying for free/reduced-price lunch/schooling is commonly used to measure school SES in US and to a smaller extent, UK studies. Indeed, all except one of the 106 school SES effects measured using this indicator in the present study came from US-based studies; the one non-US-based study was conducted in England and Wales (Walker et al., Citation2005). In the US, students from families with income not exceeding 130% of the poverty level qualify for free meals while those from families with income between 130% and 185% of the poverty level qualify for reduced-price meals (Sirin, Citation2005). According to the BBC (Citation2020, October 26), students in the UK who live in households on income-related benefits qualify for free school meals if their annual household income (excluding welfare payments) does not exceed a specified amount after tax (£7,400 in England, Wales, and Scotland; £14,000 in Northern Ireland). In addition to the percentage of students who qualify for free/reduced-price lunch, a US school is classified as having low SES if it is a Title 1 school (Borman et al., Citation2001); Title 1 federal funds are granted to US public schools with a high proportion of students from low-income families to provide academic support to and learning opportunities for disadvantaged students.
School SES effects for different subjects
School SES effect sizes may vary for different student outcomes such as achievement (i.e. new skills acquired by students that are reflected in assessment grades and scores for different subjects) versus attainment (i.e. students obtaining important learning benchmarks such as being nominated for advanced mathematics programmes, being admitted to college, graduating from college) (Kim et al., Citation2019). The only published meta-analysis focusing on aggregated SES effects (including but not limited to school SES) by van Ewijk and Sleegers (Citation2010) did not find significant differences in school SES effect sizes for student achievement in languages and mathematics. However, results from other meta-analyses examining individual and aggregated SES effects report mixed results. For example, Sirin’s (Citation2005) meta-analysis found that SES had larger effect sizes for students’ mathematics (vis-a-vis verbal, science, or general) achievement. It is therefore unclear how school SES effects vary with different student outcomes – an area that is investigated in the present study.
Moderators
The study will examine moderating effects of contextual variables (students’ grade levels, school types, countries’ socioeconomic inequality) on the association between school SES and students’ learning outcomes. These contextual variables are examined for the following reasons. First, Sirin’s (Citation2005) meta-analysis showed that SES effects varied among students from different grade levels, with larger effect sizes for students from higher grade levels as compared to kindergarteners. Kim and colleagues’ (Citation2019) meta-analysis of student SES effects in developing countries reported larger effect sizes for the academic achievement of secondary versus elementary school students but no significant effect size differences in attainment outcomes for these two groups of students. Therefore, school SES effects may vary with students’ grade levels. Second, some researchers assert that school SES can explain differences in student performance in different school types (private versus public) (Dronkers & Robert, Citation2008; Thomson et al., Citation2013). For example, Thomson and colleagues (Citation2013) found that, compared to government-supported private schools or government schools, independent private schools in 16 countries had higher levels of mathematics performance that was fully explained by school SES. The third set of contextual variables pertains to levels of inequality in different countries/regions. The first variable is the country/region that the study is conducted in (US or other countries). The mainstream SES scholarship is largely based on studies conducted in the US (e.g. Sirin, Citation2005), so it is important to ascertain if effect sizes vary among different countries/regions. Two other national-level moderators are GINI (degree of inequality in the distribution of family income in a country) and education GINI indices (associations between GDP per capita and individuals’ average years of education) (Ziesemer, Citation2016). A previous study showed that societal SES gradient in mathematics achievement positively moderated the relationship between parental expectations (a SES-related cultural capital variable comprising families’ familiarity with high-brow cultural elements or evaluative standards of educational institutions) and students’ mathematics achievement (Tan, Citation2015). Therefore, the two GINI indices, as measures of socioeconomic inequality, may moderate the association between school SES and students’ learning outcomes.
In addition to contextual variables, the present study examines how four methodological variables (number of school SES indicators, measurement level of student outcome data, type of studies, sources of school SES data) may moderate school SES effects for the following reasons. First, van Ewijk and Sleegers' (Citation2010) meta-analysis found that student peer SES effect sizes were inversely related to the number of SES indicators used, so school SES effect sizes may vary with the number of SES indicators used. Second, previous studies suggest that school SES effects may vary with levels of measurement (school, student) of school SES and student outcome variables (Gorard, Citation2006). The third methodological variable pertains to study type such as published journal articles or unpublished doctoral theses; effect sizes may be larger in published articles (Polanin et al., Citation2016). Lastly, Sirin’s (Citation2005) meta-analysis showed that school SES effects computed from school SES data obtained from a variety of sources (students, parents, school administrators, state education departments, records on percentage of students who are eligible for free/reduced-price lunch/schooling, or combination of these indicators) may differ.
“Omitted” variables
Some researchers attribute school SES effects to model misspecification (Lauen & Gaddis, Citation2013; Marks, Citation2015; Mickelson et al., Citation2013; Snijders & Bosker, Citation2012; van Ewijk & Sleegers, Citation2010); school SES effects are attenuated if relevant variables are included in analyses of school SES effects. One frequently omitted variable is the school’s percentage of ethnic minority students (Mickelson et al., Citation2013); e.g. percentage of students who are non-White in an US public school. These students may be confronted with schooling experiences (e.g. racial discrimination) that disadvantage their learning (Goddard et al., Citation2009; King, Citation2013).
Researchers also argue that school SES effects are inflated when students’ prior ability levels are not accounted for (Marks, Citation2015; van Ewijk & Sleegers, Citation2010). For example, Marks' (Citation2015) longitudinal study involving achievement of Year 3, 5, and 7 students in Australia found that school SES effects were smaller when student- and school-level prior ability levels were controlled in the analysis. The present study examines effect sizes for relationships between school SES and (a) schools’ percentage of ethnic minority students and (b) students’ prior ability levels to address the issue of omitted variables.
School processes
Many scholars endeavour to identify processes mediating school SES effects (Reynolds et al., Citation2014). These processes include school leadership, school climate, teacher capacity, instructional programmes, school educational resources, and parental involvement. First, high-SES schools may be led by more effective school leaders; school leadership refers to “the exercise of influence on organizational members and diverse stakeholders toward the identification and achievement of the organization’s vision and goals” (Leithwood, Citation2021, p. 2). These school leaders may be more self-efficacious and experienced (Brouwer, Citation2018; Smith & Kearney, Citation2013), and they may emphasise student learning (Akay & Karadag, Citation2019) and establish school structures to enhance teaching and learning (Southern, Citation2018). Second, high-SES schools may have a more positive climate; school climate encapsulates the social atmosphere of the learning environment in which students learn (Block, Citation2011). These schools may have high levels of expectations and collective responsibility for academic expectations (Mitchell et al., Citation2016); positive relationships among school leaders, teachers, parents, and students (Forsyth et al., Citation2006; Goddard et al., Citation2009); and safe and conducive learning environments (Muijs et al., Citation2014). Third, high-SES schools may have higher levels of teacher capacity (i.e. the dispositions, expertise, and resources effective teachers need to achieve the school vision; Muijs et al., Citation2014). For example, teachers may have relevant pedagogical and content qualifications, teaching experience, and high levels of teaching self-efficacy (Akay & Karadag, Citation2019; Mitchell et al., Citation2016) and they benefit from school-supported professional development opportunities (Campoli, Citation2011; Fancera & Bliss, Citation2011). Fourth, high-SES schools may have well-designed instructional programmes (comprising coherent curriculum, student-centred pedagogy, and formative assessment; Reynolds et al., Citation2014) that effectively address students’ learning needs. Fifth, high-SES schools may have more effective educational resources (e.g. better student-teacher ratios, school infrastructure, equipment, curricular and educational materials) that enable quality learning for students (Hein et al., Citation2015; Mohammadpour & Ghafar, Citation2012; Tan & Hew, Citation2017).
The last set of processes is related to parental involvement (i.e. specific parental behaviours to enhance child development) pertaining to the family and school environments (Epstein, Citation2010; Tan, Citation2018, Citation2020). Park and colleagues (Citation2017) made a further distinction between home and school involvement when they argued that proximal, home-based involvement is directed toward helping children learn (i.e. parental involvement yielding “private” benefits) whereas school-based involvement benefits school improvement more generally (i.e. parental involvement as a “public” good). Private aspects of parents’ involvement are exemplified by parental home involvement, trust in schools, and networking to obtain resources for their children (Ahart, Citation2014; Park et al., Citation2017). Public aspects of parental involvement include parents’ formal participation in school platforms such as parent-teacher association and parents helping out in school activities (Johnson & Hull, Citation2014; Park et al., Citation2017).
Researchers have focused on specific instead of all the six categories of processes, so we do not know which processes are more important than others in explaining school SES effects. In a related study, Holzberger and colleagues’ (Citation2020) meta-analysis found that, compared to schools’ climate and material and personnel resources, processes such as schools’ academic press, classroom climate, instructional practices, and provision of out-of-school student activities had larger effect sizes for secondary school students’ mathematics and science learning. However, the study reported a substantially larger effect size for school SES (r = 0.30) when compared to those for school processes (0.03 ≤ r ≤ .18), so there is a need to identify other processes that are more highly correlated with school SES to better understand compositional effects. The study also did not examine associations between school SES and processes per se; instead, it computed effect sizes on associations between school processes (including school SES) and student learning outcomes. To address this knowledge gap, the present study will compare effect sizes for associations between school SES and different school processes.
Past meta-analyses and the present study
A literature review indicates that there are no meta-analyses examining school SES effects specifically. van Ewijk and Sleegers (Citation2010) examined student peer SES measured at the class, cohort, and school level. Sirin (Citation2005) examined effects of student, school, and neighbourhood SES using studies dated up to 2006, so there is a need to examine school SES effects using more recent studies; Kim and colleagues (Kim, Citation2019; Kim et al., Citation2019) only examined student SES effects. Additionally, Holzberger and colleagues’ (Citation2020) meta-analysis compared effect sizes of school processes for students’ mathematics and science learning outcomes, but it is unclear if these processes are related to school SES.
The present study addresses these knowledge gaps and examines four research questions:
What is the strength of relationships between school SES and student outcomes (achievement, attainment)?
How are these relationships moderated by contextual and methodological variables?
What is the strength of relationships between school SES and (a) schools’ percentage of ethnic minority students and (b) students’ prior ability?
What school processes are related to school SES?
Method
Meta-analysis was employed to summarise empirical findings across studies. It enables effects in individual studies to be converted to a common metric and compared across studies. In conventional meta-analysis, researchers address the requirement of effect size independence by ignoring the dependency and treating effect sizes independently, averaging the dependent effect sizes within a study, selecting only one effect size for each study, or selecting one unit of analysis and averaging effect sizes within the unit. These different approaches result in biased effect sizes. The present study employed a three-level meta-analysis instead of conventional meta-analysis (van den Noortgate et al., Citation2013, Citation2014). A three-level meta-analysis incorporates different variance components attributed to three levels of the meta-analytic model: sampling variance of effect sizes at level 1 (participants), variance between effect sizes from the same study at level 2 (e.g. effect sizes corresponding to different school SES indicators for the same student outcome or effect sizes corresponding to the association between a SES indicator and multiple student outcomes reported in the same study), and between-study variance at level 3. All relevant effect size information in each study can be included in a three-level meta-analysis and the correlations among effect sizes appropriately accounted for within and between studies. In the present study, the mean number of effect sizes per primary study was 4.95 (480 effect sizes from 97 primary studies) and 77 of the 97 primary studies had more than one effect size, thereby justifying the use of the three-level meta-analysis.
Study identification
The five members of the project team searched for studies (journal articles, doctoral dissertations, conference proceedings, reports) examining associations between school SES and (a) student outcomes (achievement, attainment) and/or (b) school processes mediating school SES – student outcome relationships in K-12 schools dated 2000–2020 using six computer databases (Academic Search Complete, British Education Index, ERIC, ProQuest Dissertations & Theses, PsychArticles, PsychINFO). Each person focused on 4–5 years in the search process; one research team member set the date of publication of the studies to 2000–2003 in the computer search, another team member focused on 2004-2007, and so on. Search terms in abstracts included combinations of relevant keywords (using Boolean operators OR and AND) pertaining to.
school SES (namely, school contextual effect OR school compositional effect OR school composite effect OR school aggregated effect OR SES OR socioeconomic status OR socio-economic status OR social class OR social status OR socioeconomic level OR socio-economic level OR social standing OR social position OR socioeconomic factor OR socio-economic factor) AND
student outcomes (namely, academic achievement OR educational attainment OR school performance OR school success OR student performance OR academic outcome OR academic progress OR academic success OR scholastic achievement OR student achievement OR educational achievement OR amount of schooling OR educational level completed OR level of education completed OR school years completed OR years of school completed OR enrolment OR attendance outcomes OR school attendance OR dropout OR school progression OR grade retention OR graduation OR schooling OR enrol OR absent* OR absence OR drop-out OR grade repetition OR repeat grade OR complete grade OR grade completion).
This search returned 39,469 potential studies.
This search was complemented by two sets of manual searches of relevant studies that might be missed from the computer searches. The first was a search of articles published in generalist education journals (American Educational Research Journal, Asia Pacific Education Review, British Educational Research Journal, Cambridge Journal of Education, Educational Studies, Journal of Educational Research, Oxford Review of Education, Research Papers in Education, Teachers College Record), school effectiveness journals (Journal of Research on Educational Effectiveness, School Effectiveness and School Improvement), and an educational sociology journal (Sociology of Education). This search was performed by reviewing the title and abstract of articles listed in different volumes and issues of the journals’ websites. The second manual search was performed by scouring through reference lists of past reviews (including meta-analyses) of school SES effects to identify potentially relevant primary studies. Studies which may be relevant from an examination of their title and abstract are added to the pool of potential studies derived from the computer searches. The two manual searches returned another 53 potential studies. Therefore, the search returned a total of 39,522 potential studies.
Coding procedure
A formal coding scheme was used to record details from the studies (); it was developed deductively from a broad review of the extant literature and revised to accommodate categories emerging from the coding of the studies when necessary:
Study identification details: author(s), publication year, title of study
School SES indicators: home possessions, parental education, family income, %free/reduced-price lunch/schooling, Title 1/Non-Title 1 schools, other single indicator, mixture (≥ 2 indicators), no information
Types of student outcomes: achievement, attainment, mixture (achievement, attainment)
Students’ subject areas: languages, mathematics, science, social sciences, mixture (≥ 2 subjects)
Processes associated with school SES: school leadership, school climate, teacher capacity, instructional programmes, school educational resources, parental involvement (private goods), parental involvement (public goods)
School SES effect size data: associations between school SES and (a) student outcomes; (b) schools’ percentage of ethnic minority students; (c) students’ prior ability; and (d) school processes
Student SES effect size data: association between student-level SES and outcomes
Student grade levels: early childhood, primary (G1-6), lower secondary (G7-9), upper secondary (G10-12), early childhood-primary (K-G6), early-childhood education-lower secondary (K-G9), early childhood-upper secondary (K-G12), primary-lower secondary (G1-9), primary-upper secondary (G1-12), lower secondary-upper secondary (G7-12)
School types: public, mixture (private, public)
Countries: US, non-US, mixture (≥ 2 countries/regions)
Country and education GINI
Sources of school SES data: students, parents, school administrators, state education department, records on %free/reduced-price lunch/Title 1/Non-Title 1 classification, other source, mixed (≥ 2 sources)
Number of school SES indicators used: 1-6, no information
Measurement level of student outcome data: school, student
Study type: journal article, thesis
Table 1. Categories/Range of Key Variables Coded from Studies.
Coding was performed at the effect size level. More specifically, in studies with more than one effect size, different effect sizes were separately coded. Effect sizes from a study that included samples from different countries were separately coded. Country and education GINI were mean-centred in the meta-regression.
The first author coded substantive and methodological aspects for the 97 studies included in the meta-analysis. Two other team members discussed and jointly performed the same coding for these studies. Results showed high inter-rater reliabilities between the two sets of coding (Cohen, Citation1960; McHugh, Citation2012) for different variables coded (k = .99 for school SES indicators; k = .99 for school SES data sources; k = .99 for achievement subject areas; k = .89 for measurement level of student outcomes; k = .94 for school processes; k = .99 for student grade levels). Coding differences were discussed, and a consensus was reached to inform the final coding.
Study selection
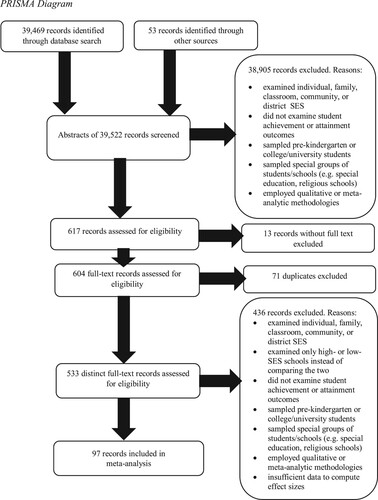
The authors collaboratively developed a set of inclusion and exclusion criteria for deciding whether studies should be included in the meta-analysis. Studies were included if they (a) examined effects of school SES on student outcomes (achievement, attainment) and/or processes that mediated relationships between school SES and student outcomes; (b) sampled K-12 students/schools; (c) employed quantitative analytical approaches; (d) reported relevant effect sizes (e.g. correlations, Cohen’s d, means/standard deviations); (e) were dated 2000-2020; and (f) were written in English. Studies were excluded if they (a) examined student, family, classroom, or community SES; (b) examined only high- or low-SES schools (and not providing a comparison of the two); (c) examined student outcomes other than achievement or attainment; (d) sampled college/university students; (e) sampled special groups of students/schools (e.g. special education or religious schools); (f) employed qualitative or meta-analytic methodologies; and (g) were not written in English. Each project team member then reviewed abstracts of the studies for the four to five-year period that they were responsible for to decide if the studies should be included in the meta-analysis. Studies were included if they met all six inclusion criteria. They were excluded if they met any of the seven exclusion criteria. 38,905 studies were excluded in the process.
After excluding another 13 studies without full text and 71 duplicate studies, the first and two other project team members independently reviewed the full text of the remaining 533 studies. They then discussed whether these studies were eligible to be included based on the inclusion and exclusion criteria; differences in opinions were consensually resolved. This collaborative process excluded 436 studies. Therefore, a final pool of 97 studies were included in the present study (). These studies examined school SES as an independent (n = 59) or a control variable (n = 38). Information coded from these studies is summarised in Supplementary Material 1. Examples of excluded studies are presented in Supplementary Material 2.
Figure 1. PRISMA Diagram.
GINI and Education GINI indices
Two sets of indices measuring the distribution of family income were included as moderators, namely GINI (https://www.cia.gov/the-world-factbook/field/gini-index-coefficient-distribution-of-family-income/country-comparison) and education GINI indices (Ziesemer, Citation2016). Both indices ranged from 0 to 1, with smaller values indicating societies that are more equal. GINI, being a broad measure of societal inequality, and education GINI, being a specific measure of educational inequality, are important measures of socioeconomic inequality that may moderate the association between school SES and students’ learning outcomes.
Calculating effect sizes
480 school SES effects were analysed using the metafor package in R (Viechtbauer, Citation2015). The effects comprised 387 Pearson’s correlation coefficients (r’s), 79 means/standard deviations (comparing high-SES with low-SES schools), and 14 Cohen’s d (comparing high-SES with low-SES schools). The magnitude of these effects was compared with that computed from another 85 effects (comprising 81 r’s and 4 means/standard deviations (comparing high-SES with low-SES students) pertaining to the association between student-level SES and learning outcomes. All effects were converted to Fisher’s z using Borenstein and colleagues’ (Citation2009) formulas. The Fisher’s z’s were weighted by the inverse of their variance in the analysis. The weighting enabled effect sizes from larger-sample studies to be given more weight than those from smaller-sample studies. Effect sizes were then converted back to Pearson’s correlations in the reporting of results because the aim was to examine associations between school SES and different variables.
Four sets of meta-analyses were performed:
Computing an overall effect size for the association between school SES and student outcomes (achievement, attainment) and comparing it to the effect size measuring the association between student-level SES and these outcomes
14 meta-analyses computing effect sizes for different SES school indicators and student outcomes ()
Meta-regression involving contextual and methodological variables () to ascertain sources of variation among effect sizes
Nine meta-analyses of relationships between school SES and (a) schools’ percentage of ethnic minority students; (b) students’ prior ability; and (c) different school processes ().
Table 2. Associations between School SES and Student Outcomes.
Table 3. Meta-regression (k = 218).
Table 4. Associations between School SES and (a) Schools’ Percentage of Ethnic Minority Students; (b) Students’ Prior Ability; and (b) School Processes.
Restricted maximum likelihood estimation (default in the metafor package in R) was used in estimating the parameters in the meta-analysis.
Random effects models
The random effects model was employed because (a) the true effect size was expected to vary from study to study, depending on the contextual and methodological characteristics of the studies; (b) it does not require that effect sizes come from the same underlying population; (c) it enables the generalisation of results beyond the studies examined; and (d) results will be identical to those from a fixed effect model even if the observed variance in effect sizes across studies is due to random sampling errors (Borenstein et al., Citation2009).
Publication bias
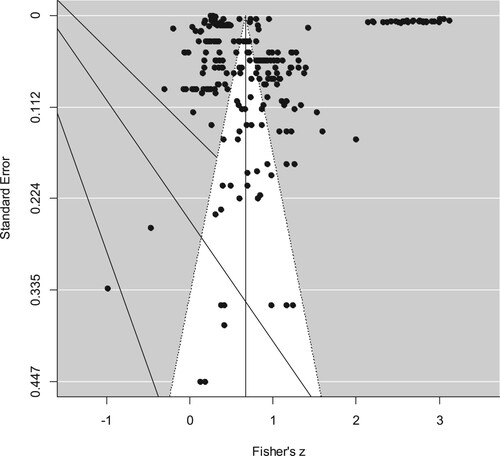
A common concern in meta-analyses is the presence of publication bias in studies (Polanin et al., Citation2016). This means that studies with significant effects are more likely to be published than those with nonsignificant effects. The funnel plot of standard errors by effect sizes shows that effect sizes from individual meta-analyses were distributed on both sides of the mean effect size and that there were effect sizes corresponding to studies with different standard errors (). Moderator analysis also indicates that standard errors were not a significant moderator for school SES effects (β = −0.34, p = .60, σ² (level 2) = 0.05, σ² (level 3) = 0.24), F (1, 239) = 0.27, p = .60). Therefore, there is no evidence of publication bias in the data.
Figure 2. Funnel Plot.
Results
School SES effect sizes
Results () show that the mean effect size for the random effects model was r = .58. This was large in magnitude according to Kraft’s (Citation2020) rules of thumb (r < .02 for small, .02 ≤ r < .10 for medium, r ≥ .10 for large effect sizes). This effect size means that school SES differences explained 33.64% of the variance in student learning outcomes. Most of the variance in effect sizes occurred within studies (level 2; 16.76%) and between studies (level 3; 83.23%); percentage of sampling variance of effect sizes at level 1 = 0.02%.
Mean effect sizes were large for school SES measured using family income (r = .68, k = 4), percentage of students enrolled in free/reduced-price lunch/schooling (r = .62, k = 106), and a variety of indicators to measure school SES (r = .51, k = 106). The effect size using home possessions was the largest at r = .78 but this finding was based on only one effect size. Mean effects for studies using Title 1/non-Title 1 school classification (r = .43, k = 15), parental education (r = .36, k = 3) or other single school SES indicator (r = .59, k = 3) were each based on a smaller number of effect sizes, so these findings must be interpreted with caution.
Next, mean effect sizes for achievement (r = .59, k = 232) and attainment (r = .39, k = 7) were large. The mean effect for studies using a combined measure of student achievement and attainment was r = .57 but this finding was based on only two effect sizes. The mean effect sizes for most subjects were large (languages, r = .58, k = 89; mathematics, r = .58, k = 97; science, r = .55, k = 18; combination of subjects, r = .62, k = 30). The mean effect for social sciences (r = .63) was based on only two effect sizes, so this finding must be interpreted with caution.
The analysis also computed the mean effect size for the association between student-level SES and learning outcomes. Results, computed from 85 effect sizes, show that r = .35. Therefore, the school SES effect size (r = .58) was 1.66 times that of the student SES effect size.
Meta-regression
Next, meta-regression was performed to examine potential sources of heterogeneity in effect sizes with regards to contextual and methodological variables. Results showed that apart from the comparison of school SES effect size between early childhood education-upper secondary and early childhood education (reference group), the regression coefficients for other variables were all very small (). In particular, the mean school SES effect size was smaller for studies involving early childhood-upper secondary schools (β = −1.49; k = 2) when compared to studies involving early childhoods (k = 4). It should be noted that findings for early childhood-lower secondary, early childhood-upper secondary, primary-upper secondary, and lower secondary-upper secondary school students were based on two to four effect sizes.
Schools’ percentage of ethnic minority students, students’ prior ability, and school processes
Results () show that school SES was negatively associated with schools’ percentage of ethnic minority students (r = -.43, k = 19) and positively associated with students’ prior ability levels (r = .54, k = 24). Effects pertaining to four school processes, namely school leadership (r = .12, k = 34), school climate (r = .31, k = 74), teacher capacity (r = .27, k = 27), and private parental involvement (r = .24, k = 5) were larger than those for schools’ instructional programmes (r = .20, k = 15) or school educational resources (r = .02, k = 35). It should be noted that compared to those for most school processes, the findings for private and public parental involvement were based on a smaller set of effect sizes and hence they should be interpreted with caution.
Discussion
The present study reveals a large variation among the 97 studies that examine school SES. The majority of studies use the percentage of free/reduced-price lunch/schooling as a single indicator to measure school SES, examine school SES effects on student achievement (especially in languages and mathematics) as opposed to student attainment, involve primary and lower secondary students instead of other groups of students, and are contextualised in the US instead of other countries/regions. Results show that the mean effect size of school SES on student learning outcomes was substantial at r = .58. The mean effect size for achievement outcomes (r = .59) was larger than that for attainment outcomes (r = .39), indicating that school SES is more strongly associated with students’ learning quality than their behavioural outcomes. Mean effect sizes for achievement in languages, mathematics, science, and a combination of subjects were large. These results are largely consistent with those reported by van Ewijk and Sleegers (Citation2010) indicating that student peer SES effect sizes did not vary across different subjects. They are also broadly consistent with Kim and colleagues’ (Citation2019) meta-analytic findings that student SES effect sizes did not differ between literacy/reading and mathematics/science achievement in developing countries. However, it should be noted that van Ewijk and Sleegers' (Citation2010) research did not focus on examining school SES while Kim and colleagues (Citation2019) examined student SES. The large effect sizes associated with student achievement in different subject areas (except social sciences) underscore school processes influencing teaching-and-learning in high-SES schools, thereby affirming the need to unravel these processes.
School SES is less strongly associated with school processes than with schools’ percentage of ethnic minority students or students’ prior ability
The present study shows that school SES was less strongly associated with school processes than with schools’ percentage of ethnic minority students or students’ prior ability. School processes which were positively associated with school SES were school leadership, school climate, teacher capacity, and parental involvement benefiting student learning directly. Among these processes, school SES had the largest association with school climate. However, the effect size (r = .31) was much smaller than that for associations between school SES and schools’ percentage of ethnic minority students (r = -.65) or between school SES and students’ prior ability (r = .54). The study also finds that school SES was not associated with other school processes such as instructional programmes, schools’ educational resources, and parental involvement benefiting students indirectly.
The significant association between school SES and schools’ percentage of ethnic minority students, and the association between school SES and various school processes (i.e. school leadership, school climate, teacher capacity) suggests that ethnic minority students may be attending less effective schools (indicative of school segregation) measured in terms of the quality of school leadership, school climate, and teacher capacity (King, Citation2013). The association between school SES and students’ prior ability means that school SES effect sizes may be smaller if students’ prior ability is controlled. However, there were only two studies that provided effect sizes for students with a specific level of prior ability (i.e. high or low-ability students), so it was not possible to compare school SES effect sizes between high- and low-ability students. The (negative) association between school SES and schools’ percentage of ethnic minority students, and the (positive) association between school SES and students’ prior ability indicate that it may be instructive to use an intersectionality perspective to examine school SES effects (Fahle et al., Citation2020). The findings also question the validity of examining school SES effects if these student variables are not included in the research design of primary studies. Importantly, it merits reiterating that the findings are associations, so they do not mean that all ethnic minority students or students with lower levels of prior ability attend low-SES schools or that the lower levels of student learning in low-SES schools are due to schools’ percentage of ethnic minority students or students’ prior ability levels. Rather, they indicate that school SES is associated with these student variables and that there are many variables contributing to student learning outcomes.
Measuring school SES using percentage of students on free/reduced-price lunch
Results show that most studies included in the meta-analysis used the percentage of students on free/reduced price lunch as a school SES indicator. Some researchers are concerned with reliability issues using this indicator (Sirin, Citation2005; van Ewijk & Sleegers, Citation2010); for example, the process to determine eligibility for such a scheme is prone to errors and that not all financially needy students will apply for this scheme (Sirin, Citation2005). Additionally, a high percentage of students on free/reduced lunch for a school does not imply that many students in the school are poor (Hill & Jenkins, Citation2001). Future school SES studies can explore the use of other indicators besides the percentage of free/reduced lunch students to measure school SES.
School processes
Results show that school SES was more associated with school leadership, school climate, teacher capacity, and parental involvement than with school instructional programmes or school educational resources, thereby elucidating the processes that may contribute to the more positive student learning outcomes in higher-SES schools.
Higher-SES schools have better leadership, teachers, and school climate
There is meta-analytic evidence that school leadership (including their role in building a shared vision and setting high expectations for student learning) is associated with organisational, teacher, and student outcomes (Tan et al., Citation2022), so higher-SES schools may be led by more effective school leaders galvanising the school community to establish a positive climate, and these two processes then contribute to student performance. Effective school leadership strategies need to be implemented via teachers to influence student learning (Hendriks & Scheerens, Citation2013). The present study underscores two teacher-related qualities associated with high-SES schools, namely school climate (e.g. teacher trust, motivation, commitment, responsibility) and teachers’ demonstrated capacity (e.g. teacher qualifications, experience, self-efficacy, professional development, collaboration, autonomy). The associations of school SES with school leadership and teacher quality suggest that higher-SES students may have better learning outcomes because competent school leaders and teachers cultivate a positive school climate (Berkowitz et al., Citation2017).
School SES is less associated with school resources or instructional programme
The present study shows that school SES was less associated with school resources. Some researchers argue that school resources have negligible or even negative effects on student learning outcomes (Häkkinen et al., Citation2003). Therefore, having more school resources are necessary but insufficient for student success. Schools need to have other conditions such as a positive school climate and competent teachers.
Relatedly, the present study also shows that school SES was less associated with instructional programmes than with other school variables such as school leadership, school climate, and teacher capacity. There are three possible reasons for this finding. First, the finding is consistent with the Heyneman-Loxley Effect promulgating that schools are less important in influencing student outcomes when countries become economically developed (Heyneman, Citation2015). Indeed, it can be argued that international sharing of best practices has converged in most instructional programmes in many schools (including low-SES schools) having elements of student-centeredness in their design and employing different assessment approaches to monitor student learning (Schweisfurth, Citation2015). Therefore, high-SES school students do not necessarily enjoy better instructional programmes than their peers in low-SES schools. Second, educational effectiveness research (Reynolds et al., Citation2014) suggests that schools may need other processes to support the implementation of instructional programmes. The third reason why school SES was less associated with instructional programmes is the diversity of data sources for instructional programmes in the studies analysed. Specifically, teachers, students, and school officials provided data for school instructional programmes (seven, five, and three effect sizes respectively); these data were used to measure the association between school SES and instructional programmes in the meta-analysis. However, teachers may overstate the implementation of instructional programmes whereas students may be more critical in their perceptions of instructional programmes, so the overall association between school SES and instructional programmes may be nullified.
The discussion so far suggests that students may have better learning outcomes in higher-SES schools because they benefit from access to quality human resources (competent, motivated school leadership and teachers) instead of more functional resources (instructional offerings, school educational resources). School leaders and teachers then cultivate a positive school climate (an intangible process) supporting student learning. A comparison of effects between school SES and processes in the present study shows that school climate had the largest effect size compared to those for school leadership and teacher capacity. Relatedly, Holzberger and colleagues’ (Citation2020) meta-analysis showed that processes such as school and classroom climate (.08 ≤ r ≤ .13) were more strongly associated with students’ science and mathematics outcomes than processes such as material and personnel resources (.03 ≤ r ≤ .08), thereby suggesting that students in higher-SES schools benefit from a positive school climate (made possible by quality school leadership and teachers).
Ecological fallacy
The present study shows that school SES effect size was 1.66 times that of the student SES effect size. This finding cautions researchers against committing the ecological fallacy when erroneous individual-level inferences are made from group aggregated data (Robinson, Citation1950). For example, a large positive association between the mean school SES level (i.e. school SES) and performance level of students in a school does not necessarily mean that student SES is strongly associated with student achievement (Marks, Citation2015; Robinson, Citation1950; Sirin, Citation2005; Snijders & Bosker, Citation2012; van Ewijk & Sleegers, Citation2010). The study also shows that school SES was associated with schools’ percentage of ethnic minority students, students’ prior ability, and specific processes (school leadership, school climate, teacher capacity). These different findings indicate that school and student SES are different constructs and that school SES effects may be explained by non-student SES factors (e.g. school processes). There is no clear evidence as to whether school SES effects are susceptible to the ecological fallacy.
Limitations
As with all studies, the present meta-analysis should be read with some limitations in mind. First, it covers studies dated 2000-2020, so results reported are more relevant for schools and student learning during this time period. Additionally, it only includes studies written in English. Future meta-analyses can include earlier studies and studies published in other languages and compare results with those reported in this study. Second, the present study ascertains associations between school SES and (a) schools’ composition of ethnic minority students and (b) students’ prior ability but it is unable to test if school SES effects will be attenuated when these student variables are controlled for due to insufficient data. Third, the meta-analysis ascertains associations between school SES and processes but is unable to determine if school processes mediate the relationship between school SES and student outcomes. Future studies can examine mediation effects of these school processes in experimental research. Lastly, the analysis has eschewed the usage of statistical tests of significance, including p values, because the primary studies included are not conducted at the population level, there is no evidence of random sampling in these studies, and information on missing values is incomplete at best. Researchers conducting future studies on school SES should consider more robust means of sampling (e.g. random sampling at the population level) and report the extent to which data are missing on key variables.
Conclusion
The present study is contextualised in the debate on the influence of school composition on student learning outcomes. Being the first meta-analysis to focus on school SES, it examines 480 effect sizes from 97 studies to provide insights on associations between school SES and (a) student learning outcomes; (b) schools’ percentage of ethnic minority students and students’ prior ability; and (c) school processes in K-12 schools. The study also clarifies the moderating influence of various contextual and methodological variables.
The study makes three theoretical contributions. First, it clarifies the magnitude and scope of school SES effects: the mean school SES effect size was large at r = .58 and school SES effects were larger for achievement (especially in language, mathematics, science subjects) than attainment outcomes. School SES effects influenced students in both private and public K-12 schools and were more pronounced in socioeconomically unequal countries/regions. Second, results enhance our understanding of school SES. Specifically, school SES was more strongly associated with schools’ percentage of ethnic minority students and students’ prior ability than with school processes. Results also show that the effect size for school SES was larger than that for student SES and that there was an over-reliance on the use of percentage of students on free/reduced-price lunch to measure school SES. Third, the study elucidates plausible reasons to explain why higher-SES school students outperform their peers from lower-SES schools by identifying processes that are associated with school SES. These processes comprise intangible school aspects (school leadership and climate, teacher capacity) and parental involvement directly benefiting student learning. In contrast, functional school resources (school instructional programmes, educational resources) and parental involvement benefiting school improvement were not associated with school SES. These results suggest that it may be beneficial for school leaders to develop their schools’ “software” (i.e. developing leadership and teacher capacity and building a positive school climate) in addition to “hardware” (i.e. functional resources). Put together, these contributions from the present study provide evidence of a large school SES effect similar to that first documented in the Coleman Report. Additionally, it advances our understanding of school SES effects beyond the Coleman Report by unravelling specific school processes that may explain the influence of school SES on students’ learning outcomes.
The present study has important implications for education policies related to school segregation (Reardon & Owens, Citation2014) and voucher schools (Epple et al., Citation2017). The finding from the study that there were more ethnic minority students in low-SES schools means that economic and racial segregation may coexist in schools. This school segregation has sometimes been attributed to education policies such as the school voucher scheme that has supposedly being designed to foster school competition (Epple et al., Citation2017). The findings that there were some processes that characterised high-SES schools (i.e. more effective school leadership, climate, teacher capacity) provide an opportunity for low-SES schools to prioritise their limited resources to improve these processes and become more competitive in the educational marketplace. The improved school processes may mitigate the inequality in teaching and learning resources arising from school segregation, thereby enriching learning opportunities for students in low-SES schools.
Supplemental Material
Download MS Word (86.3 KB)Acknowledgement
The authors acknowledge the research assistance of Kai Hong Lo.
Disclosure statement
No potential conflict of interest was reported by the author(s).
Additional information
Funding
References
- *Studies included in meta-analysis
- *Ahart, T. M. (2014). A comparative analysis of teacher perceptions of school culture in high-performing and low-performing Iowa schools [Unpublished doctoral dissertation]. Drake University, Iowa, US.
- Akay, E., & Karadag, E. (2019). Multilevel analyses of student, parent, and school indicators of achievement in high school transition in Turkey. School Community Journal, 29(2), 31–62.
- *Alexander, V., & Maeda, Y. (2015). Understanding student achievement in mathematics and science: The case of Trinidad and Tobago. Prospects, 45(4), 577–591. https://doi.org/10.1007/s11125-015-9373-y
- *Armor, D., Marks, G., & Malatinszky, A. (2018). The impact of school SES on student achievement: Evidence from U.S. statewide achievement data. Educational Evaluation and Policy Analysis, 40(4), 613–630. https://doi.org/10.3102/0162373718787917
- *Babb, C. A. (2012). An analysis of the relationship between organizational servant leadership and student achievement in middle level schools [Unpublished doctoral dissertation]. Widener University, Pennsylvania, US.
- *Bae, C. L., & Lai, M. H. (2020). Opportunities to participate in science learning and student engagement: A mixed methods approach to examining person and context factors. Journal of Educational Psychology, 112(6), 1128. https://doi.org/10.1037/edu0000410
- *Barber, C. (2007). Recognizing high achievement in context: A multilevel analysis of friends’ values and individuals’ motivation and background as associated with the identification of tenth-graders by teachers and test performance [Unpublished doctoral dissertation]. University of Maryland, Maryland, US.
- *Barton, J. D. (2015). An investigation of the relationship between school size, socio-economic status, expenditure-per-student, mobility rate, and percentage of non-white secondary students taking state science exams [Unpublished doctoral dissertation]. Texas A&M University, Texas, US.
- *Batiste, M. L. (2014). Leadership practices and the relationship between teacher attendances and teacher perceptions of leadership behaviors in a large urban school district [Unpublished doctoral dissertation]. Mercer University, Georgia, US.
- BBC. (2020, October 26). Free school meals: How many children can claim them? https://www.bbc.com/news/54693906.
- *Bednar, J. (2018). Effective school leaders and student achievement: an examination of 265 schools in Northern Illinois [Unpublished doctoral dissertation]. Northern Illinois University, Illinois, US.
- *Belfi, B., Haelermans, C., & De Fraine, B. (2016). The long-term differential achievement effects of school socioeconomic composition in primary education: A propensity score matching approach. British Journal of Educational Psychology, 86(4), 501–525. https://doi.org/10.1111/bjep.12120
- *Bergren, D. A. (2014). The impact of school climate on student achievement in the middle schools of the commonwealth of Virginia: A quantitative analysis of existing data [Unpublished doctoral dissertation]. The George Washington University, District of Columbia, US.
- *Berkowitz, R., Glickman, H., Benbenishty, R., Ben-Artzi, E., Raz, T., Lipshtat, N., & Astor, R. (2015). Compensating, mediating, and moderating effects of school climate on academic achievement gaps in Israel. Teachers College Record: The Voice of Scholarship in Education, 117(7), 1–34. https://doi.org/10.1177/016146811511700703
- Berkowitz, R., Moore, H., Astor, R. V., & Benbenishty, R. (2017). A research synthesis of the associations between socioeconomic background, inequality, school climate, and academic achievement. Review of Educational Research, 87(2), 425–469. https://doi.org/10.3102/0034654316669821
- *Bevel, R. K., & Mitchell, R. M. (2012). The effects of academic optimism on elementary reading achievement. Journal of Educational Administration, 50(6), 773–787. https://doi.org/10.1108/09578231211264685
- *Black, S., Cortes, K., & Lincove, J. (2016). Efficacy versus equity: What happens when states tinker with college admissions in a race-blind era? Educational Evaluation and Policy Analysis, 38(2), 336–363. https://doi.org/10.3102/0162373716629006
- Block, M. (2011). School climate. In S. Goldstein, & J. A. Naglieri (Eds.), Encyclopedia of child behavior and development (pp. 1291–1293). Springer. https://doi.org/10.1007/978-0-387-79061-9_2500.
- *Boonen, T., Pinxten, M., Van Damme, J., & Onghena, P. (2014a). Should schools be optimistic? An investigation of the association between academic optimism of schools and student achievement in primary education. Educational Research and Evaluation, 20(1), 3–24. https://doi.org/10.1080/13803611.2013.860037
- *Boonen, T., Speybroeck, S., Bilde, J., Lamote, C., Van Damme, J., & Onghena, P. (2014b). Does it matter who your schoolmates are? An investigation of the association between school composition, school processes and mathematics achievement in the early years of primary education. British Educational Research Journal, 40(3), 441–466. https://doi.org/10.1002/berj.3090
- Borenstein, M., Hedges, L. V., Higgins, J. P. T., & Rothstein, H. R. (2009). Introduction to meta-analysis. Wiley.
- Borman, G. D., & Dowling, M. (2010). Schools and inequality: A multilevel analysis of Coleman’s Equality of Educational Opportunity data. Teachers College Record, 112(5), 1201–1246. https://doi.org/10.1177/016146811011200507
- Borman, G. D., Stringfield, S. C., & Slavin, R. E. (2001). Title 1, compensatory education at the crossroads. Lawrence Erlbaum.
- *Bottiani, J. H., Bradshaw, C. P., & Mendelson, T. (2017). A multilevel examination of racial disparities in high school discipline: Black and white adolescents’ perceived equity, school belonging, and adjustment problems. Journal of Educational Psychology, 109(4), 532–545. https://doi.org/10.1037/edu0000155
- *Brooks, E., & Weiler, S. C. (2018). The relationship between the condition of Colorado elementary school facilities and student achievement. Journal of Education Finance, 43(4), 397–416.
- *Brouwer, J. L. (2018). Relationship between self-efficacy perceptions of the principal and collective teacher efficacy perceptions in four midwestern states [Unpublished doctoral dissertation]. The University of Iowa, Iowa, US.
- *Byun-Kitayama, C. (2012). Use of accountability indicators to evaluate elementary school principal performance [Unpublished doctoral dissertation]. University of southern California, California. US.
- *Caldas, S., Bernier, S., & Marceau, R. (2009). Explanatory factors of the black achievement gap in Montréal's public and private schools: A multivariate analysis. Education and Urban Society, 41(2), 197–215. https://doi.org/10.1177/0013124508325547
- *Caldas, S. J., & Reilly, M. S. (2019). The mediating influence of physical activity levels on 3rd-grade academic achievement. Journal of Research in Childhood Education, 33(2), 271–289. https://doi.org/10.1080/02568543.2019.1577775
- *Calvert, M. K. H. (2013). Administrator leadership and content knowledge: Effects on literacy achievement on male students grades four through eight [Unpublished doctoral dissertation]. University of Arkansas at Little Rock, Arkansas, US.
- *Campoli, A. J. (2011). A critical analysis of job-embedded professional learning within a distributed leadership framework [Unpublished doctoral dissertation]. University of Southern Mississippi, Mississippi, US.
- *Caponera, E., & Losito, B. (2016). Context factors and student achievement in the IEA studies: evidence from TIMSS. Large-scale Assessments in Education, 4(1), 1–22. https://doi.org/10.1186/s40536-016-0030-6
- *Cate, J. W. (2017). Students to computer ratio, socioeconomic status, and student achievement [Unpublished doctoral dissertation]. East Tennessee State University, Tennessee, US.
- *Chen, G., & Weikart, L. A. (2008). Student background, school climate, school disorder, and student achievement: An empirical study of New York City's middle schools. Journal of School Violence, 7(4), 3–20. https://doi.org/10.1080/15388220801973813
- Cohen, J. (1960). A coefficient of agreement for nominal scales. Educational and Psychological Measurement, XX(1), 37–46. https://doi.org/10.1177/001316446002000104
- Coleman, J. S., Campbell, E., Hobson, C., McPartland, J., Mood, A., Weinfeld, F., & York, R. (1966). Equality of educational opportunity OE-38001. Government Printing Office.
- *Davis, R. (2011). The effect of leadership orientations on student achievement [Unpublished doctoral dissertation]. Louisiana Tech University, Louisiana, US.
- Dronkers, J., & Robert, P. (2008). Differences in scholastic achievement of public, private government-dependent, and private independent schools: A cross-national analysis. Educational Policy, 22, 541–577. https://doi.org/10.1177/0895904807307065
- Dumont, H., & Ready, D. D. (2020). Do schools reduce or exacerbate inequality? How the associations between student achievement and achievement growth influence our understanding of the role of schooling. American Educational Research Journal, 57(2), 728–774. https://doi.org/10.3102/0002831219868182
- Early, E., Miler, S., Dunne, L., Thurston, A., & Filiz, M. (2020). The influence of socio-economic background and gender on school attainment in the United Kingdom: A systematic review. Review of Education, 8(1), 120–152. https://doi.org/10.1002/rev3.3175
- *Eddy, R. M. (2003). Effects of school size on student achievement [Unpublished doctoral dissertation]. The Claremont Graduate University, California, US.
- *Edgerton, J. D., Peter, T., & Roberts, L. W. (2014). Gendered habitus and gender differences in academic achievement. Alberta Journal of Educational Research, 60, 182–212. https://doi.org/10.1080/09540253.2016.1263290
- Epple, D., Romano, R. E., & Urquiola, M. (2017). School vouchers: A survey of the economics literature. Journal of Economic Literature, 55(2), 441–492. https://doi.org/10.1257/jel.20150679
- Epstein, J. L. (2010). School/Family/Community partnerships: Caring for the children we share. Phi Delta Kappan, 76(9), 701–712. https://doi.org/10.1177/0031721711009200326
- Fahle, E. M., Reardon, S. F., Kalogrides, D., Weathers, E. S., & Jang, H. (2020). Racial segregation and school poverty in the United States, 1999-2016. Race and Social Problems, 12(1), 42–56. https://doi.org/10.1007/s12552-019-09277-w
- *Fancera, S., & Bliss, J. (2011). Instructional leadership influence on collective teacher efficacy to improve school achievement. Leadership and Policy in Schools, 10(3), 349–370. https://doi.org/10.1080/15700763.2011.585537
- *Forsyth, P. B., Barnes, L. L., & Adams, C. M. (2006). Trust-effectiveness patterns in schools. Journal of Educational Administration, 44(2), 122–141. https://doi.org/10.1108/09578230610652024
- *Fortner, T. (2017). Assessing the effectiveness of New Hampshire elementary schools: An effective schools approach [Unpublished doctoral dissertation]. Plymouth State University, Plymouth, US.
- *Franco, M. S. (2006). The relationships among building level school/non-school factors and value-added scores in Ohio [Unpublished doctoral dissertation]. University of Cincinnati, Ohio, US.
- *Freeman, A. S. (2014). The effects of instructional schedule type on student achievement, attendance, and graduation at the high school level [Unpublished doctoral dissertation]. Indiana State University, Indiana, US.
- *Furr, B. (2018). Collective efficacy, teacher beliefs and socioeconomic status in title I and Non-title I schools [Unpublished doctoral dissertation]. Gardner-Webb University, North Carolina, US.
- *Garcia, J. C. (2017). A Texas study of school principals’ leadership style, attendance, and socioeconomic status [Unpublished doctoral dissertation]. Our Lady of the Lake University, Texas, US.
- *Goddard, R. D., & Goddard, Y. L. (2001). A multilevel analysis of the relationship between teacher and collective efficacy in urban schools. Teaching and Teacher Education, 17(7), 807–818. https://doi.org/10.1016/S0742-051X(01)00032-4
- *Goddard, R., Salloum, S., & Berebitsky, D. (2009). Trust as a mediator of the relationships between poverty, racial composition, and academic achievement: Evidence from Michigan's public elementary schools. Educational Administration Quarterly, 45(2), 292–311. https://doi.org/10.1177/0013161X08330503
- Gorard, S. (2006). Is there a school mix effect? Educational Review, 58(1), 87–94. https://doi.org/10.1080/00131910500352739
- *Graziano, D. (2013). The relative influence of faculty mobility on NJ HSPA scores [Unpublished doctoral dissertation]. Seton Hall University, New Jersey, US.
- *Gregoire, M. A., & Algina, J. (2000). Reconceptualizing the debate on school climate and students’ academic motivation and achievement: A multilevel analysis [Unpublished doctoral dissertation]. University of Florida, Florida, US.
- *Haim, O. (2018). Academic proficiency performance in second and third language: The role of school context. Language, Culture and Curriculum, 31(2), 182–198. https://doi.org/10.1080/07908318.2018.1427759
- *Hallmark, B. S. (2013). Examining the relationship between academic optimism and student achievement: A multi-level approach [Unpublished doctoral dissertation]. Texas A&M University, Texas, US.
- Hanushek, E. A. (2016). What matters for student achievement: Updating Coleman on the influence of families and schools. Education Next, 16(2), https://www.educationnext.org/what-matters-for-student-achievement/.
- *Harper, W. A. (2016). Exploring the role of the principal in creating a culture of academic optimism: A sequential quan-qual mixed methods study [Unpublished doctoral dissertation]. University of Alabama at Birmingham, Alabama, US.
- Häkkinen, I., Kirjavainen, T., & Uusitalo, R. (2003). School resources and student achievement revisited: New evidence from panel data. Economics of Education Review, 22(3), 329–335. https://doi.org/10.1016/S0272-7757(02)00060-2
- *Hein, S., Tan, M., Aljughaiman, A., & Grigorenko, E. (2015). Gender differences and school influences with respect to three indicators of general intelligence: Evidence from Saudi Arabia. Journal of Educational Psychology, 107(2), 486–501. https://doi.org/10.1037/a0037519
- *Hendriks, M. A., & Scheerens, J. (2013). School leadership effects revisited: A review of empirical studies guided by indirect-effect models. School Leadership & Management, 33(4), 373–394. https://doi.org/10.1080/13632434.2013.813458
- Heyneman, S. (2015). The Heyneman/Loxley effect: Three decades of debate. In S. A. McGrath, & Q. Gu (Eds.), Routledge handbook of international education and development (pp. 150–167). Routledge.
- Hill, M. S., & Jenkins, S. P. (2001). Poverty among British children: chronic or transitory? In B. Bradbury, S. P. Jenkins, & J. Micklewright (Eds.), The dynamics of child poverty in industrialised countries (pp. 174–195). Cambridge University Press.
- *Holmes, S. L. (2012). An investigation of no child left behind and its primary purpose to close the achievement gap [Unpublished doctoral dissertation]. Northern Arizona University, Arizona, US.
- *Holt, J. L. (2020). The effects of socioeconomic status on mathematical achievement [Unpublished doctoral dissertation]. Lindenwood University, Missouri, US.
- Holzberger, D., Reinhold, S., Lüdtke, O., & Seidel, T. (2020). A meta-analysis on the relationship between school characteristics and student outcomes in science and maths – evidence from large-scale studies. Studies in Science Education, 56(1), 1–34. https://doi.org/10.1080/03057267.2020.1735758
- *Huang, X. (2011). Family SES and schoolmate effects on the development of young students’ academic achievement [Unpublished doctoral dissertation]. Chinese University of Hong Kong, Hong Kong SAR, People’s Republic of China.
- *Isoye, S. T. (2011). School leadership capacity and student achievement [Unpublished doctoral dissertation]. Northern Illinois University, Illinois, US.
- *Jeter-Twilley, R., Legum, H., & Norton, F. (2007). Parental and community involvement in schools: Does socio-economic status matter? [Unpublished doctoral dissertation]. Bowie State University, Maryland, US.
- *Johnson, U., & Hull, D. (2014). Parent involvement and science achievement: A cross-classified multilevel latent growth curve analysis. The Journal of Educational Research, 107(5), 399–409. https://doi.org/10.1080/00220671.2013.807488
- *Kemker, K. J. (2007). Technology in low socio-economic K-12 schools: Examining student access and implementation [Unpublished doctoral dissertation]. University of South Florida, Florida, US.
- Kim, S. W. (2019). Is socioeconomic status less predictive of achievement in East Asian countries? A systematic and meta-analytic review. International Journal of Educational Research, 97, 29–42. https://doi.org/10.1016/j.ijer.2019.05.009
- Kim, S. W., Cho, H., & Kim, L. Y. (2019). Socioeconomic status and academic outcomes in developing countries: A meta-analysis. Review of Educational Research, 89(6), 875–916. https://doi.org/10.3102/0034654319877155
- *King, M. L. (2013). The relationship between African American high school students’ desire to attend college, their perceived likelihood to attend college and actual college enrollment [Unpublished doctoral dissertation]. University of Missouri - Kansas City, Missouri, US.
- *Korat, O., & Schiff, R. (2005). Do children who read more books know “what is good writing” better than children who read less? A comparison between grade levels and SES groups. Journal of Literacy Research, 37(3), 289–324. https://doi.org/10.1207/s15548430jlr3703_2
- Kraft, M. A. (2020). Interpreting effect sizes of education interventions. Educational Researcher, 49(4), 241–253. https://doi.org/10.3102/0013189X20912798
- *Krakehl, R., Kelly, A. M., Sheppard, K., & Palermo, M. (2020). Physics teacher isolation, contextual characteristics, and student performance. Physical Review Physics Education Research, 16(2), 020117. https://doi.org/10.1103/PhysRevPhysEducRes.16.020117
- *Ladd, H. F., & Walsh, R. P. (2002). Implementing value-added measures of school effectiveness: getting the incentives right. Economics of Education Review, 21(1), 1–17. https://doi.org/10.1016/S0272-7757(00)00039-X
- Lauen, D. L., & Gaddis, S. M. (2013). Exposure to classroom poverty and test score achievement: Contextual effects or selection? American Journal of Sociology, 118(4), 943–979. https://doi.org/10.1086/668408
- *Lea, G. P. (2011). High school principal leadership and student achievement: the effects of transformational leadership on the Illinois Prairie State achievement examinations [Unpublished doctoral dissertation]. Capella University, Minnesota, US.
- *Lee, H. S. (2006). Multilevel analysis of teacher and school effects on 8 th grade math achievement across 32 nations [Unpublished doctoral dissertation]. University of Virginia, Virginia, US.
- Leithwood, K. (2021). A review of evidence about equitable school leadership. Education Sciences, 11(8), 377–425. https://doi.org/10.3390/educsci11080377
- *Li, D. (2018). Opportunity to learn informational text and literary text and their relations with student reading achievement: An examination with the PIRLS 2011 and the NAEP 2011 Reading assessments [Unpublished doctoral dissertation]. Lowa State University, Lowa, US.
- *Lindahl, R. A., Sr, C., & M, P. (2012). A study of school size among Alabama's public high schools. International Journal of Education Policy and Leadership, 7(1), 1–27. https://doi.org/10.22230/ijepl.2012v7n1a309
- *Lyle, S. (2018). The relative contribution of transformational leadership, socioeconomic status, and years of principal experience on overall school effectiveness [Unpublished doctoral dissertation]. The University of Alabama at Birmingham, Alabama, US.
- *Marks, G. N. (2015). Are school-SES effects statistical artefacts? Evidence from longitudinal population data. Oxford Review of Education, 41(1), 122–144. https://doi.org/10.1080/03054985.2015.1006613
- *McCord, G. A. (2014). An examination of the impact that selected school characteristics have on the academic achievement of students attending high schools in South Carolina [Unpublished doctoral dissertation]. South Carolina State University, South Carolina, US.
- McHugh, M. L. (2012). Interrater reliability: The kappa statistic. Biochemia Medica, 22(3), 276–282. https://doi.org/10.11613/BM.2012.031
- Mickelson, R. A., Bottia, M. C., & Lambert, R. (2013). Effects of school racial composition on K–12 mathematics outcomes: A meta regression analysis. Review of Educational Research, 83(1), 121–158. https://doi.org/10.3102/0034654312475322
- *Milford, T. (2009). An investigation of international science achievement using the OECD's PISA 2006 data set [Unpublished doctoral dissertation]. University of Victoria, British Columbia, Canada.
- *Mitchell, R., Mendiola, B., Schumacker, R., & Lowery, X. (2016). Creating a school context of success. Journal of Educational Administration, 54(6), 626–646. https://doi.org/10.1108/JEA-02-2015-0018
- *Mohammadpour, E., & Ghafar, M. N. A. (2012). Mathematics achievement as a function of within- and between-school differences. Scandinavian Journal of Educational Research, 58(2), 189–221. https://doi.org/10.1080/00313831.2012.725097
- Muijs, D., Kyriakides, L., Van der Werf, G., Creemers, B., Timperley, H., & Earl, L. (2014). State of the art – teacher effectiveness and professional learning. School Effectiveness and School Improvement, 25(2), 231–256. https://doi.org/10.1080/09243453.2014.885451
- *Mumphord, K. M. (2013). Elementary teachers’ perceptions of instructional leadership and student achievement [Unpublished doctoral dissertation]. Texas A&M University, Texas, US.
- OECD. (2016). PISA 2015 results: Excellence and equity in education (Vol. I). OECD Publishing. https://doi.org/10.1787/9789264266490-en.
- *Park, S. (2008). The effects of student characteristics and school factors on the transition to postsecondary education [Unpublished doctoral dissertation]. The University of Iowa, Iowa, US.
- *Park, S., Stone, S., & Holloway, S. (2017). School-based parental involvement as a predictor of achievement and school learning environment: An elementary school-level analysis. Children and Youth Services Review, 82, 195–206. https://doi.org/10.1016/j.childyouth.2017.09.012
- *Peoples, A. (2008). The relationship of school size and socioeconomic status to middle grades growth status on End of grade tests in North Carolina [Unpublished doctoral dissertation]. East Tennessee State University, Tennessee, US.
- Perry, L. B., & McConney, A. (2010). Does the SES of the school matter? An examination of socioeconomic status and student achievement using PISA 2003. Teachers College Record, 112(4), 1137–1162. https://doi.org/10.1177/016146811011200401
- *Plevier, M. M. (2016). The influence of length of school day on grade 4 and grade 5 language arts and mathematics performance in the state of New Jersey [Unpublished doctoral dissertation]. Seton Hall University, New Jersey, US.
- Polanin, J. R., Tanner-Smith, E. E., & Hennessy, E. A. (2016). Estimating the difference between published and unpublished effect sizes: A meta-review. Review of Educational Research, 86(1), 207–236. https://doi.org/10.3102/0034654315582067
- *Ransdell, S. (2012). There’s still no free lunch: Poverty as a composite of SES predicts school-level reading comprehension. American Behavioral Scientist, 56(7), 908–925. https://doi.org/10.1177/0002764211408878
- *Rathmann, K., Herke, M., & Richter, M. (2020). The role of class-level composition and schoolś contextual characteristics for school-aged childreńs life satisfaction: A three-level multilevel analysis. International Journal of Adolescence and Youth, 25(1), 12–24. https://doi.org/10.1080/02673843.2019.1573743
- Reardon, S. F., & Owens, A. (2014). 60 years after Brown: Trends and consequences of school segregation. Annual Review of Sociology, 40(1), 199–218. https://doi.org/10.1146/annurev-soc-071913-043152
- *Reddick, K. M. (2014). Investigating the relationships among leadership influence, collective teacher efficacy, and socio-economic status as predictors of student achievement [Unpublished doctoral dissertation]. Capella University, Minnesota, US.
- Reynolds, D., Sammons, P., De Fraine, B., Van Damme, J., Townsend, T., Teddlie, C., & Stringfield, S. (2014). Educational effectiveness research (EER): A state-of-the-art review. School Effectiveness and School Improvement, 25(2), 197–230. https://doi.org/10.1080/09243453.2014.885450
- Robinson, W. S. (1950). Ecological correlations and the behavior of individuals. American Sociological Review, 15(3), 351–357. https://doi.org/10.2307/2087176
- *Roscigno, V. J. (2000). Family/school inequality and African-American/Hispanic achievement. Social Problems, 47(2), 266–290. https://doi.org/10.2307/3097201
- *Ross, C. (2016). Title I versus Non-Title I students and standardized test scores in a school district in Georgia [Unpublished doctoral dissertation]. Capella University, Minnesota, US.
- *Schaffer, S. A. (2015). The relationships between principal preparation, leadership, and school effectiveness [Unpublished doctoral dissertation]. Azusa Pacific University, California, US.
- *Schreiber, J. B. (2002). Institutional and student factors and their influence on advanced mathematics achievement. The Journal of Educational Research, 95(5), 274–286. https://doi.org/10.1080/00220670209596601
- Schweisfurth, M. (2015). Learner-centred pedagogy: Towards a post-2015 agenda for teaching and learning. International Journal of Educational Development, 40, 259–266. https://doi.org/10.1016/j.ijedudev.2014.10.011
- *Servoss, T., & Finn, J. (2014). School security: For whom and with what results? Leadership and Policy in Schools, 13(1), 61–92. https://doi.org/10.1080/15700763.2014.890734
- *Sharpe, S. T. (2011). Examining the characteristics of high schools in which black students achieve in mathematics [Unpublished doctoral dissertation]. University of Miami, Florida, US.
- Sirin, S. R. (2005). Socioeconomic status and academic achievement: A meta-analytic review of research. Review of Educational Research, 75(3), 417–453. https://doi.org/10.3102/00346543075003417
- *Smith, P. A., & Kearney, W. S. (2013). The impact of achievement press on student success in elementary schools. International Journal of Educational Management, 27(4), 387–401. https://doi.org/10.1108/09513541311316322
- *Smyth, C. A. M. (2001). The effects of school policies and practices on eighth-grade science achievement: A multilevel analysis of TIMSS [Unpublished doctoral dissertation]. St. John's University (New York), School of Education and Human Services, New York, US.
- Snijders, T. A. B., & Bosker, R. J. (2012). Multilevel analysis: An introduction to basic and advanced multilevel modelling (2nd ed.). Sage.
- *Southern, R. K. (2018). Teacher autonomy and centralization: Predicting school effectiveness [Unpublished doctoral dissertation]. University of Alabama, Alabama, US.
- *Swanson, P. L. (2009). A quantitative study of school characteristics that impact student achievement on state assessments and those assessments’ associations to ACT scores in Tennessee [Unpublished doctoral dissertation]. East Tennessee State University, Tennessee, US.
- *Tan, C. Y. (2015). The contribution of cultural capital to students’ mathematics achievement in medium and high socioeconomic gradient economies. British Educational Research Journal, 41(6), 1050–1067. https://doi.org/10.1002/berj.3187
- Tan, C. Y. (2018). Socioeconomic status, involvement practices, and student science achievement: Insights from a typology of home and school involvement patterns. American Educational Research Journal, 56(3), 899–924. https://doi.org/10.3102/0002831218807146
- Tan, C. Y. (2020). Family cultural capital and student achievement: Theoretical insights from PISA. Springer.
- *Tan, C. Y., Gao, L., & Shi, M. (2022). Second-order meta-analysis synthesizing the evidence on associations between school leadership and different school outcomes. Educational Management Administration & Leadership, 50(3), 469–490. https://doi.org/10.1177/1741143220935456
- *Tan, C. Y., & Hew, K. F. (2017). Information technology, mathematics achievement, and educational equity in developed economies. Educational Studies, 43(4), 371–390. https://doi.org/10.1080/03055698.2016.1277137
- *Tanner, C. K. (2008). Explaining relationships among student outcomes and the school's physical environment. Journal of Advanced Academics, 19(3), 444–471. https://doi.org/10.4219/jaa-2008-812
- *Taylor, S. A., & Harris, K. C. (2003). School integration and the achievement test scores of Black and White students in Savannah, Georgia. North American Journal of Psychology, 5(2), 301–310.
- *Thomas, J. P. (2000). Influences on mathematics learning and attitudes among African American high school students. The Journal of Negro Education, 69(3), 165–183. https://doi.org/10.2307/2696230
- Thomson, S., De Bortoli, L., & Buckley, S. (2013). PISA 2012: How Australia measures up. Australian Council for Educational Research.
- *Tiruchittampalam, S., Nicholson, T., Levin, J. R., & Ferron, J. M. (2018). The effects of preliteracy knowledge, schooling, and summer vacation on literacy acquisition. The Journal of Educational Research, 111(1), 28–42. https://doi.org/10.1080/00220671.2016.1190911
- *Uline, C., & Tschannen-Moran, M. (2008). The walls speak: The interplay of quality facilities, school climate, and student achievement. Journal of Educational Administration, 46(1), 55–73. https://doi.org/10.1108/09578230810849817
- van den Noortgate, W., Lopez-Lopez, J. A., Marın-Martınez, F., & Sanchez-Meca, J. (2013). Three-level meta-analysis of dependent effect sizes. Behavior Research Methods, 45(2), 576–594. https://doi.org/10.3758/s13428-012-0261-6
- van den Noortgate, W., Lopez-Lopez, J. A., Marın-Martınez, F., & Sanchez-Meca, J. (2014). Meta-analysis of multiple outcomes: A multilevel approach. Behavior Research Methods, 46(1), 1–14. https://doi.org/10.3758/s13428-013-0342-1
- van Ewijk, R., & Sleegers, P. (2010). The effect of peer socioeconomic status on student achievement: A meta-analysis. Educational Research Review, 5(2), 134–150. https://doi.org/10.1016/j.edurev.2010.02.001
- *van Laere, E., Aesaert, K., & van Braak, J. (2014). The role of students’ home language in science achievement: A multilevel approach. International Journal of Science Education, 36(16), 2772–2794. https://doi.org/10.1080/09500693.2014.936327
- *Viechtbauer, W. (2015). Meta-analysis package for R. https://cran.r-project.org/web/packages/metafor/metafor.pdf.
- *von Keyserlingk, L., Becker, M., Jansen, M., & Maaz, K. (2020). Effects of student composition in school on young adults’ educational pathways. Journal of Educational Psychology, 112(6), 1261–1272. https://doi.org/10.1037/edu0000411
- *Walker, S. O., Petrill, S. A., & Plomin, R. (2005). A genetically sensitive investigation of the effects of the school environment and socio-economic status on academic achievement in seven-year-olds. Educational Psychology, 25(1), 55–73. https://doi.org/10.1080/0144341042000294895
- *Wang, C., & Liou, P. (2017). Students’ motivational beliefs in science learning, school motivational contexts, and science achievement in Taiwan. International Journal of Science Education, 39(7), 898–917. https://doi.org/10.1080/09500693.2017.1310410
- *White, G. W., Stepney, C. T., Hatchimonji, D. R., Moceri, D. C., Linsky, A. V., Reyes-Portillo, J. A., & Elias, M. J. (2016). The increasing impact of socioeconomics and race on standardized academic test scores across elementary, middle, and high school. American Journal of Orthopsychiatry, 86(1), 10–23. https://doi.org/10.1037/ort0000122
- *Wiley, S. (2001). Contextual effects on student achievement: School leadership and professional community. Journal of Educational Change, 2(1), 1–33. https://doi.org/10.1023/A:1011505709050
- Willms, J. D. (2010). School composition and contextual effects on student outcomes. Teachers College Record, 112(4), 1008–1037. https://doi.org/10.1177/016146811011200408
- *Xuan, X., Xue, Y., Zhang, C., Luo, Y., Jiang, W., Qi, M., & Wang, Y. (2019). Relationship among school socioeconomic status, teacher-student relationship, and middle school students’ academic achievement in China: Using the multilevel mediation model. PloS One, 14(3), E0213783. https://doi.org/10.1371/journal.pone.0213783
- Zhou, H., & Ma, X. (2021). A partial simulation study of phantom effects in multilevel analysis of school effects: The case of school socioeconomic composition. Sociological Methods & Research, https://doi.org/10.1177/0049124120986195
- *Zhu, J., Kennedy, K., Mok, M., & Halse, C. (2019). Chinese immigrant students in Hong Kong: Exploring performance and influences on their civic learning. PsyCh Journal, 8(4), 465–479. https://doi.org/10.1002/pchj.260
- Ziesemer, T. (2016). Gini coefficients of education for 146 countries, 1950-2010. Retrieved from: https://ideas.repec.org/p/unm/unumer/2016044.html.