
Abstract
To prevent single-bicycle crashes, this study is the first to evaluate effects of slanted kerbstones, edge lines, shoulder strips, and edge strips on cycling behaviour of cyclists ≥50 years. In Experiment 1, 32 participants cycled on a control path and paths with edge lines, slanted kerbstones, and three types of 0.5 m wide shoulder strips (with grey artificial grass, green artificial grass, or concrete street-print). In Experiment 2, 30 participants cycled a different route including a control path and paths with edge lines or 0.3 m white edge strips. Cyclists rode closer to the main cycle path’s edge in the shoulder strips conditions, although the presence of these strips resulted in a larger total distance to the verge compared to the control condition. Furthermore, cyclists cycled further from the verge in the edge strip condition than the control condition. Safety implications of the shoulder and edge strips are considered to be positive.
Practitioner Summary: Older cyclists have a high risk for single-bicycle crashes (e.g. riding into the verge). In two experiments, cyclists ≥50 years cycled a route where different treatments were applied on a cycle path. Shoulder and edge strip treatments were related to more efficient path use and safer distances from the verge.
Abbreviations: AGS: artificial grass strip; CL: control location; CSS: concrete street-print strip; ELC: edge line continuous; ELI: edge line intermittent; LP: lateral position; SDLP: standard deviation of the lateral position; SK: slanted kerbstones; WCES: white chippings edge strip
1. Introduction
1.1. Crashes of older cyclists
In The Netherlands, the bicycle is widely used as a daily means of transport and increasing amounts of older people (65+) use a bicycle (Schepers, Stipdonk, et al. Citation2017). Cycling contributes to healthy, independent mobility (Oja et al. Citation2011) and a safe infrastructure can help to prevent crashes (Reynolds et al. Citation2009). Although the cycling infrastructure in The Netherlands is traditionally considered world leading in terms of safety (Schepers, Twisk, et al. Citation2017), increasing amounts of (older) cyclists and the developments with regard to electric bicycles demand authorities to ensure that the infrastructure is also suitable for these contemporary demands (Wegman, Zhang, and Dijkstra Citation2012).
Single-bicycle crashes are common in the Netherlands and older cyclists are particularly at risk for sustaining serious injury in these crashes (Schepers Citation2013). Therefore, current policies in the Netherlands emphasise that the safety of older cyclists should be improved (Rijkswaterstaat Citation2016). It is estimated that 21% of all cyclist crashes, including younger and middle-aged cyclists, are caused by accidently leaving a road and cycling into the verge (Schepers and Klein Wolt Citation2012). Potential causes are cycling too close to the edge, swerving, being distracted, misjudging the course of the infrastructure, or being hit by another road user (Schepers and Klein Wolt Citation2012; Davidse et al. Citation2014). Westerhuis and De Waard (Citation2016) found that this situation also occurs on cycle paths: 20% of their cyclists sample ≥50 years accidentally entered the verge at least once during one week of everyday cycling trips. Fortunately, these occurrences did not result in falls or crashes. However, with level differences, near objects, or a marshy verge this may lead to injuries. According to Davidse et al. (Citation2014) in 15–27% of crashes they investigated cyclists hit a kerb or entered the verge unintentionally.
Electric bicycles have gained popularity because these allow people to cycle with less physical effort compared to conventional bicycles (Theurel, Theurel, and Lepers Citation2012; Berntsen et al. Citation2017). Longer distances and ascending trajectories become easier to cycle and this makes it also useful for older cyclists or people with physical complaints (Dill and Rose Citation2012). There are indications, however, that e-cyclists have an increased risk for a crash that requires treatment at an emergency department (Schepers et al. Citation2014) and that the injuries after a crash with an electric bicycle are more severe compared to conventional bicycles, in particular for older cyclists (Poos et al. Citation2017). A reason could be that e-cyclists ride with higher speeds or accelerate faster compared to conventional cyclists (e.g. Vlakveld et al. Citation2015; Dozza, Bianchi Piccinini, and Werneke Citation2016; Kovácsová et al. Citation2016; Schleinitz et al. Citation2017) although similar speeds and behaviour are also found (e.g. Langford, Chen, and Cherry Citation2015; Westerhuis and De Waard Citation2016).
Since crashes due to entering the verge can lead to serious injuries, particularly for older cyclists, the current study assesses infrastructure treatments that aim to prevent cyclists from leaving a cycle path and entering the verge. The goal of these treatments is to provide extra guidance or offer more space to correct course deviations while cycling.
1.2. Infrastructure treatments for run-off crashes
Although the current knowledge of infrastructure treatment effects on cycling behaviour is limited, important conclusions can be learned from car driving research (Zegeer and Council Citation1995). Numerous studies use on-road observations or crash data that are collected with treatments in the real world (see e.g. Hatfield et al. Citation2009). Although this could be considered a preferred method because of ecological validity (Hoc Citation2001), these studies can be prone to confounding of treatments due to other unique properties of locations (Fridstrom et al. Citation1995, cited in Hatfield et al. Citation2009; Wegman, Zhang, and Dijkstra Citation2012). Therefore, simulators can be an alternative, although this method seems to limit ecological validity compared with measuring on-road behaviour (see e.g. Branzi, Domenichini, and La Torre Citation2017; O’Hern, Oxley, and Stevenson Citation2017).
1.2.1. Line marking
Cyclists can be guided by delineation or line marking. Line marking can be applied on the edge or in the centre of a road or path to influence the position of cyclists (i.e. edge lines or centrelines, respectively). For example, Van Houten and Seiderman (Citation2005) found that cyclists keep more distance from parked cars when edge lines are applied, compared to locations without markings. On these locations, cyclists were positioned in-between the car travel lane and parked cars. Effects were found both when there was only an edge line between the car travel lane and the cyclists, and when there was a full cycling lane between the car travel lane and the parked cars (i.e. edge lines to the left and the right of the cyclists). Based on detailed crash information, Schepers and den Brinker (Citation2011) argue that edge lines and centrelines should be present on cycle paths to reduce single-bicycle crashes.
For car driving, McKnight, McKnight, and Tippetts (Citation1998) found that only very low contrast delineation conditions were related to reduced lane keeping performance compared to normal or higher contrast conditions. Steyvers and De Waard (Citation2000) compared driving behaviour on edge-lined roads with control conditions either containing no delineation or centre-axis delineation only. After comparing with roads without edge lines, they found that car drivers keep a greater distance from the road’s edge when edge lines are applied. Additional results showed no differences in perceived mental effort, driving performance, and subjective ratings, suggesting that edge lines are a basic and efficient way to keep drivers away from the verge. Speed comparisons indicated that drivers drove faster on edge-lined roads compared to non-delineated roads, but there was no difference with speed on roads with dashed centre markings (Steyvers and De Waard Citation2000).
Few studies have been performed on centrelines on shared paths for cyclists and pedestrians. In a blind curve on a path that contained a yellow centreline and a directional arrow, relatively more cyclists were found to remain cycling in the proper lane, compared to a pre-measurement at the same location (Jordan and Leso Citation2000). Hatfield and Prabhakharan (Citation2016) found comparable effects: more cyclists tended to cycle in their own lane on a shared path with a centreline than on a path without a centreline. The behavioural effects of centrelines on cycling behaviour, therefore, seem similar to car driving, because in a driving simulator study De Waard, Steyvers, and Brookhuis (Citation2004) found that applying centrelines on a two-way road caused drivers’ lateral position to move closer to the edge, and therefore more into their own lane, than on roads with no delineation.
The effects of shared path centrelines on cycling speed are mixed: observations of Hatfield and Prabhakharan (Citation2016) revealed that a centreline was related to a lower cycling speed, while Boufous, Hatfield, and Grzebieta (Citation2018) concluded that cyclists were more likely to cycle at higher speeds when a centreline was present. They argue that this difference could potentially be explained by the idea that cyclists can interpret a centreline as being part of a road for cars, and therefore might increase their speed. The strongest predictor of an increased cycling speed was for visually segregated paths: higher speeds were more likely to occur when the areas for cyclists and pedestrians differed in surface type or colour (Boufous, Hatfield, and Grzebieta Citation2018).
1.2.2. Haptic feedback
Road users may also be warned that they are about to drive off the road by haptic feedback. Haptic feedback is often applied as an addition to lane marking by means of rumble strips, Audio Tactile Lane Marking, or Profile Lane Marking (PLM). These are milled-in or raised markings that cause vibrations in the vehicle to warn drivers that they are deviating from their lane. Hatfield, Murphy, and Soames Job (Citation2008) interviewed 775 Australian drivers on PLM and reported that 75% believed it was an effective treatment to remain on the road. In particular, the increased visibility of the road edges and the urge to avoid the marking because of unpleasant sound and vibration seem to increase road safety. The most frequent application of edge rumble strips is on alerting sleepy drivers (e.g. Anund et al. Citation2008).
Haptic feedback may also be applied to centreline markings in order to reduce head-on crashes on two-lane rural roads (Persaud, Retting, and Lyon Citation2004). Hatfield et al. (Citation2009) suggest based on crash data that profile markings both in the centre and near the edge of the road are most effective in reducing crash risk. Furthermore, haptic feedback is not necessarily restricted to rumble strips. For example, De Waard et al. (Citation1995) investigated whether haptic feedback could decrease comfort for speeding drivers and prevent crashes due to swerving out of lane. They found that combining visual narrowing of the lanes and applying rippled surfaces on road edges reduced driving speed compared to a control location with edge and centreline marking due to increased mental workload and discomfort while driving at higher speed. Overall, Khan, Abdel-Rahim, and Williams (Citation2015) concluded that rumble strips lead to fewer crashes in car drivers. However, Wu, Donnel, and Aguero-Valverde (Citation2014) did not find effects on injury severity.
1.2.3. Road widening
Zegeer et al. (Citation1988) defined four factors to reduce crashes on two-lane roads: lane width, shoulder width, shoulder type, and roadside characteristics. Observations on cyclist and pedestrian shared paths indicate that a wider path is related to higher cycling speeds (Boufous, Hatfield, and Grzebieta Citation2018). However, the safety effects of widening a road on car driving are mixed as Manuel, El-Basyouny, and Islam (Citation2014) found a negative association between the amount of collisions and the width of the road, for example. Some drivers might take more risk on wider roads and drive at higher speeds than on roads that are narrower (Lewis-Evans and Charlton Citation2006). Widening a road is also an expensive treatment and might therefore not be possible in many occasions.
1.2.4. Shoulders and shoulder characteristics
So-called ‘forgiving roadsides’ can be applied to allow road users who are drifting off the road to safely return back onto that road without risking a crash (Wegman, Aarts, and Bax Citation2008). Safety effects can be achieved by paving the shoulders (Ogden Citation1997) or by increasing the width of the shoulder (Gross and Donnel Citation2011).
Objects near a road or cycle path are also potentially dangerous for causing a crash while cycling (Fabriek, De Waard, and Schepers Citation2012). For car drivers, collisions with objects (e.g. trees or poles) are related to a higher risk for severe or fatal injuries compared to crashes with guardrails or concrete barriers (Holdridge, Shankar, and Ulfarsson Citation2005). Limiting or removing roadside objects increases the forgivingness of a road because obviously a road user cannot collide with these anymore but they can often also return to the road safely (Wegman, Aarts, and Bax Citation2008). Since it is not always possible to remove such objects, their visibility can also be increased by changing colour, increasing contrast, or adding delineation (Schepers and den Brinker Citation2011; Fabriek, De Waard, and Schepers Citation2012).
1.2.5. Infrastructure treatments for forgiving cycle paths
The current study evaluates infrastructure treatments designed to increase cycling safety by changing the edge of a cycle path. For this, the influence of different types of edge lines, shoulder strips, and edge strips on cyclists’ lateral position, swerving (SDLP), speed, and subjective opinion was measured to explore their potential use for providing safety and comfort for older cyclists. An increase in lateral position and a decrease in the amount of swerving are considered safer, because the chance of (accidentally) leaving the path are smaller and there is more space available to correct a potential mistake. Effects on speed were also explored because bicycle infrastructure treatments are also known to influence cycling speed differently (e.g. Hatfield and Prabhakharan Citation2016; Boufous, Hatfield, and Grzebieta Citation2018). Therefore, no concrete hypotheses with regard to speed were defined.
2. Methodology
2.1. Design
Two separate within-subjects experiments were performed on two locations where different variants of cycle path treatments were applied. The experimental treatments were specifically designed for this research and constructed in cooperation with the provincial authorities of Fryslân and Overijssel in the Netherlands. Because the provided locations were 70 km apart and the accompanying treatments were produced at different time periods, two separate experiments were performed: Experiment 1 and Experiment 2.
In Experiment 1, two variants of edge markings and three types of 0.5 m wide paved shoulder strips were added next to a cycle path. These were compared with two control conditions that contained a similar sized cycle path without treatment. In Experiment 2, three types of edge lines and one condition with a 0.3 m wide white edge strip of light coloured chippings was placed on the edge of the cycle path. These treatments were compared with one control condition. The participants only participated in one of the experiments and were asked to cycle a short predefined route on their own bicycle that we equipped with research instrumentation. During the experiment, they passed the infrastructural treatments while lateral position, swerving, speed, and subjective opinion were measured. Ethical consent was provided by the Ethical Committee Psychology (ECP) of the University of Groningen (PPO‐013‐253 & PPO-015-007).
2.2. Participants
Thirty-two and 30 cyclists participated in Experiment 1 and Experiment 2, respectively (see ). The minimum age for participation was 50 years and all participants had to be capable of riding their own bicycle safely and independently through everyday traffic. One participant in Experiment 2 was excluded due to not having cycled for many years. Two groups were included in each experiment: cyclists with a conventional bicycle and cyclists with an electric bicycle. No specific selection strategy was applied, however. The participants were asked to preferably use their own bicycle although a loan bicycle was also available.
Table 1. Participants’ demographic characteristics.
Recruitment took place by means of advertisements in local news media, posters in local supermarkets, invitations sent to local cycling clubs and unions, and via word of mouth. The participants were told that the study was about ‘the experience of a cycle path’ and that cyclists older than 50 years were invited to bring their own bicycle to cycle a fixed route of 12 or 6 km on a cycle path near their village. No further details were provided other than that their bicycle would be equipped with small cameras, that they would be asked several questions about their experience, and that a financial compensation of €15 was offered.
2.3. Locations and experimental designs
In Experiment 1, the participants cycled a 6 km cycle path in a rural area and passed five experimental and two control sections. The experimental conditions contained infrastructural treatments such as white Edge Lines Continuous (ELC), white Slanted Kerbstones (SK), and three types of shoulder strip conditions: Grey and Green Artificial Grass Strips (AGS) and Concrete Street-print Strips (CSS, see ). These shoulder strips were different from the cycle path’s main surface and caused clear and uncomfortable vibrations in the bicycle to warn the cyclists that they had left the cycle path. Although the surfaces were sufficiently firm to safely return to the cycle path, they were not designed to cycle continuously over and acted as a buffer zone in-between the cycle path and the verge.
Figure 1. All conditions from Experiment 1. (A) Edge Lines, (B) White Slanted Kerbstones, (C) Grey Artificial Grass Strips, (D) Green Artificial Grass Strips, (E) Concrete Street-print Strips, (F) Control Location 1, (G) Control Location 2.
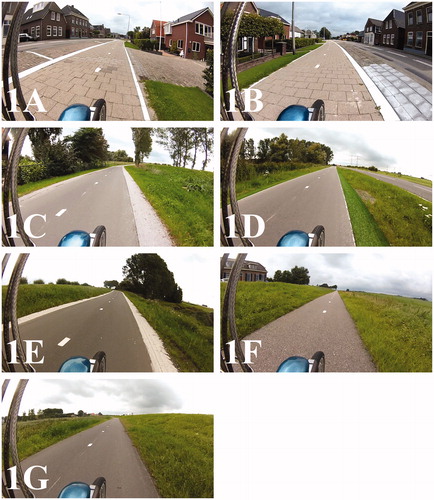
As the route consisted of one straight cycle path, the participants turned around halfway and rode the same path back to the starting point. The lengths of the treatment areas differed between 50 m and 225 m and the order of the conditions was fixed (see ). Two Control Locations (CL1 and CL2; ) that matched the width of the treated cycle paths were also measured. Because the SK treatment was applied on an asymmetrical cycle path that was wider than any cycle path in the near area, this treatment was also compared with CL1.
Table 2. Experimental conditions properties.
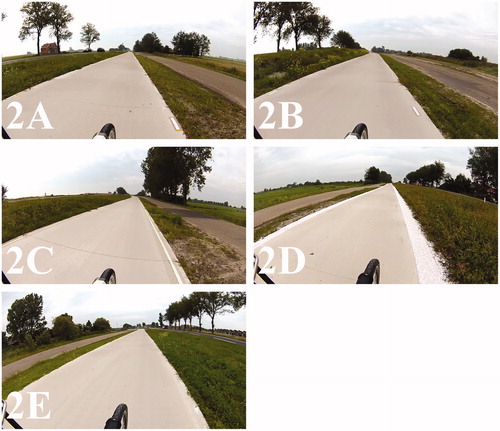
In Experiment 2, the participants cycled a 2.5 km long two-way cycle path in a rural area and passed four experimental conditions and one control condition in a fixed order. This route was also a ‘there and back’ trip, meaning that the participants covered a total distance of 5 km. The experimental treatments either had intermittent edge lines located 5 cm or 15 cm from the path’s edge (ELI 5 and ELI 15, respectively), a continuous edge line located 15 cm from the path’s edge (ELC 15), or White Chippings Edge Strips (WCES) each 30 cm wide on both sides of the path (see ). The design of the edge strip was different from the shoulder strips in Experiment 1 because the edge strip was placed on the edge of the main cycle path and therefore a part of the cycle path’s main surface. The lengths of the treatment areas varied between 135 and 950 m and there was little to no distance in-between treatments (see ). The Control Location (CL3) was equally wide as the pavement of the experimental locations and did not contain edge lines or strips (see ).
Figure 2. All conditions from Experiment 2. (A) Intermittent Edge Lines 5 cm, (B) Intermittent Edge Lines 15 cm, (C) Continuous Edge Lines 15 cm, (D) 30 cm White Chippings Edge Strip, (E) Control Location 3.
2.4. Materials and equipment
The bicycle rides were recorded with two Contour + 2™ digital action cameras with GPS that were mounted on the participants’ bicycles. The cameras recorded videos with a resolution of 1280 × 720 (180 degrees field of view) at 30 frames per second. A measurement tool was used before each bicycle ride to capture the real-world distances in the video (Westerhuis et al. Citation2017). A public-transport (loan) bicycle was also provided in case participants could not bring their own bicycle.
2.5. Questionnaires and interviews
The participants gave written informed consent and completed a questionnaire and a semi-structured interview. The questionnaire concerned demographics and cycling habits and the interview after the bicycle ride was about the participants’ subjective experiences of the experimental treatments. During this interview, participants were asked whether they remembered the treatments and what their opinion was about the effectiveness and safety of these. Pictures of the conditions were used if participants could not remember a location. Based on the experiences of Experiment 1, the questions for Experiment 2 were made more succinct to increase the efficiency of the interviews. An overview of the questions in the interviews is listed in Appendix A.
2.6. Procedure
Participants who were interested contacted the researchers by email or telephone. Before the experiment, they received a package with general information about the experiment, directions to the study location, and the questionnaire concerning demographics and cycling habits. Participants were invited to bring their own bicycle and were awaited by two researchers. One researcher provided them with additional information about the purpose and the rationale of the experiment, the camera instrumentation, and the route, while the other researcher installed and calibrated the two cameras on the bicycle. The cameras were mounted on the handlebars as described in Westerhuis et al. (Citation2017). One camera was aimed forward to record the cyclist’s view and the other was aimed downward to measure lateral position (see ). GPS data concerning position and speed was also recorded. A measurement tool was used to determine real world distances ().
Figure 3. The lateral position measurement process with VLC Media Player™ and JRuler Pro™. In this example, the lateral position is measured and calculated as 75 cm + 12 cm = 87 cm.
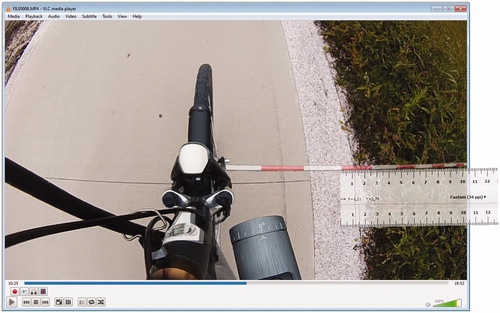
Figure 4. A schematic representation of the conditions for Experiment 1 (left: 1A = Edge Line, 1B = Slanted Kerbstones, 1C = Grey Artificial Grass, 1D = Green Artificial Grass, 1E = Street-print, 1F = Control Location 1, 1G = Control Location 2) and Experiment 2 (right: 2A = Intermittent Edge Lines 5 cm, 2B = Intermittent Edge Lines 15 cm, 2C = Continuous Edge Lines 15 cm, 2D = White Chippings Edge Strip, 2E = Control Location 3). The notch represents the edge of the path that was used to measure the lateral position.
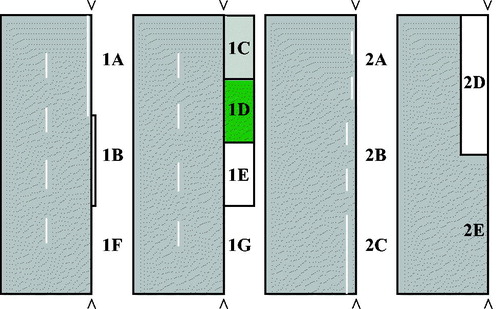
Figure 5. The average lateral position (in cm) per condition: 0 = right hand cycle path edge as indicated in . The error bars represent the standard error of the mean (S.E.).
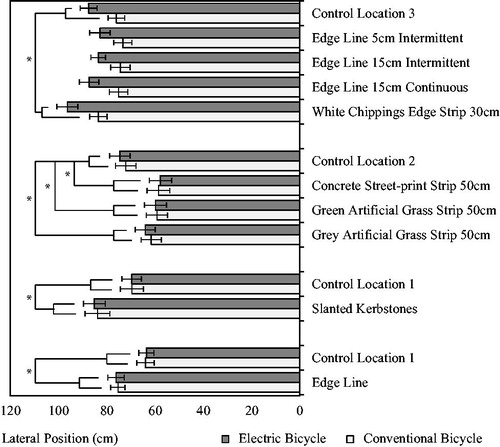
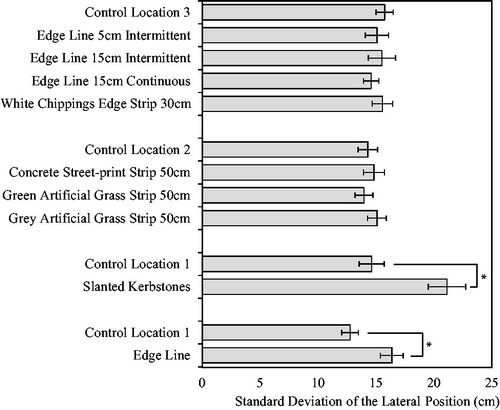
Figure 6. The average SDLP (in cm) per condition. The error bars represent the standard error of the mean (S.E.).
Although the routes differed between Experiment 1 and Experiment 2, the procedures were the same. All participants were asked to cycle alone to prevent the influence of a companion (De Waard et al. Citation2010). The instructions were to cycle normally and they were given a phone number to call the researcher if necessary. No hints or instructions concerning any of the treatments were provided. The participants could enter the cycle path and cycle in the indicated direction until they noticed a ‘Turn Around’ sign. At this point, they turned and cycled the same route back to the starting location.
After the ride, the participants were asked by means of open-ended and Likert-scale questions whether they recognised each condition and what their opinion was about the treatments. The questions concerned general opinion, perceived usefulness, and estimated effects on safety. In Experiment 1, open conversations concerning the shoulder strip and control conditions were initiated by the experimenters. In Experiment 2, the participants were asked about all conditions, although the questions in this experiment were more specific and structured to save time based on the experience of Experiment 1. Questions concerning the edge lines that were 5 and 15 cm from the path’s edge were combined because it was difficult to see the difference while cycling. To explore whether participants remembered the locations in Experiment 1, they were first asked what they have seen without mentioning anything specific about the conditions. If they were unable to recall a location, a photo was shown after which the remaining questions were asked. The participants also watched video recordings of their own bicycle ride on a laptop screen in Experiment 1. In Experiment 2, participants were explicitly asked whether they could remember an intervention (yes or no) after they were shown a photo and to what extent they believed that a condition would help to keep cyclists on the cycle path (on a 5-point Likert scale ranging from ‘not’ to ‘very much’).
2.7. Data processing and statistical analysis
Video and speed data were analysed with the Contour Storyteller™ for Windows™, VLC Media Player™, and a digital ruler (JRuler Pro™). The videos were viewed in Contour Storyteller™ to determine when participants passed each condition in the video. The GPS data of these timeframes were exported to a comma-separated values file (.csv) and average speed data were calculated in Microsoft™ Excel™. All locations were selected to have minimal gradient differences, although the Grey Artificial Grass treatment in Experiment 1 contained some level differences within the lateral position sampling area. For this reason, a larger speed sampling window for this treatment was measured.
Lateral position was measured by inserting the recording of a measurement tool as a video overlay in VLC Media Player™ (see ). As each stripe of the tool represented 25 centimetres, the lateral position was measured by adding up all stripes plus the measured value of the last stripe that hit the shoulder. JRuler Pro™ was calibrated to reflect the size of the last stripe and its value was measured.
For each condition and participant, lateral position samples over a fixed measurement area were scored and mean Lateral Position (LP) and Standard Deviation of the Lateral Position (SDLP) were calculated as the primary dependent variables. The size of the measurement areas ranged between 50 m and 102 m per condition (see in section 2.3). Lateral position was sampled on fixed visible parts of the path, in Experiment 1 these were the dashed centrelines, in Experiment 2 these were the transition points of the cycle path’s surface blocks. Because the participants turned around halfway the route, all conditions were passed and measured twice except for the Slanted Kerbstones condition that was only applied to one side of the cycle path (see ). Lateral position was measured as the distance between the bicycle’s front wheel and the edge of the main cycle path’s pavement to keep the measurements the same between conditions.
The first analyses concerned potential differences between users of conventional and electric bicycles. Mann Whitney U Tests were performed to compare lateral position, swerving, and speed measurements between the groups collapsed over all conditions. Omnibus tests and pairwise comparisons were performed by means of the Friedman Test and Wilcoxon Signed Ranks Test, respectively. Treatment and control locations that best matched the width of the treated sections were compared. In Experiment 1, the Edge Lines and Slanted Kerbstones treatments were compared with Control Location 1 and the shoulder strips conditions were compared with Control Location 2. In Experiment 2, all treatment conditions were compared with Control Location 3 (see ). Because non-parametric analyses do not allow testing for interaction effects, ipsative scores of each treatment were calculated and compared per bicycle type by means of Mann Whitney U Tests. For all pairwise comparisons, Bonferroni correction was applied to control for alpha inflation error in multiple testing (i.e. α = .0055). Effect sizes for non-parametric data were calculated and interpreted using the r statistic (Fritz, Morris, and Richler Citation2012). An effect size of r > .1 is considered a small effect, r > .3 a medium effect, and r > .5 resembled a large effect.
During the study, 10 participants were either initiating or performing an overtaking manoeuvre. This manoeuvre increased their lateral position and swerving values compared to when they were not overtaking a cyclist. The overtaking manoeuvres for these participants were therefore discarded from the analyses by removing all samples in-between a continuously increasing sequence of lateral position values followed by a continuously decreasing sequence of lateral position values. A similar procedure was performed when participants entered one of the shoulder strips to try these out. In total, 14 overtaking manoeuvres and 11 manoeuvres in which participants intentionally entered the shoulder strips were removed from the dataset (see Appendix B for more details).
The average cycling speed for each condition was derived from the camera’s GPS data and analysed as the third dependent variable. The same overtaking and try-out manoeuvres that were discarded during the lateral position sampling process were also removed in the speed sampling procedure. One condition of one participant was additionally removed as he or she encountered a small group of cyclists who could not be overtaken before the condition ended. This event slowed the participant down.
The answers in the post-ride interviews about the experimental treatments of Experiment 1 were clustered and assigned to one of three categories (i.e. positive, neutral, and negative) by two researchers independently. Inter-rater reliability was calculated by means of the linear weighed kappa statistic (Hallgren Citation2012). Hereafter, the researchers reached a joint agreement on the items that were rated differently and the resulting percentages of the coded answers were calculated. In Experiment 2, the participants’ answers were recoded into ‘very helpful’ (categories ‘much’ and ‘very much’), ‘rather helpful’ (categories ‘a little’ and ‘to some extent’) and ‘not helpful’ (category ‘not’). For this reason, the categories differ per experiment.
3. Results
3.1. Bicycle type
No significant effects of bicycle type on any of the infrastructure treatments were found in Experiment 1. In Experiment 2, only the overall mean lateral position of cyclists with an electric bicycle was higher compared to cyclists using a conventional bicycle (see ). No effects on swerving or speed were found in Experiment 2. For this reason, only lateral position was analysed per bicycle type to explore potential effects of the experimental conditions.
Table 3. Descriptive statistics and non-parametric test results for the differences between users of conventional and electric bicycles, collapsed over all conditions.
3.2. Lateral position
In , the mean lateral position values per condition and bicycle type are shown. The first analysis revealed a significant main effect of the conditions on lateral position in Experiment 1 (χ2 (7) = 136.39, p < .001). Pairwise comparisons with the control conditions showed that the mean lateral position at the Edge Line and Slanted Kerbstones locations was significantly higher than in the Control Condition. Furthermore, in all the Shoulder Strip conditions cyclists rode significantly closer to the edge of the main path than in the Control Condition. There were large effect sizes (see ). The analyses of Experiment 2 also revealed a significant main effect on lateral position (χ2 (4) = 34.19, p < .001). Pairwise comparisons revealed that only the mean lateral position on the White Chippings Edge Strip location was higher compared to the Control Condition ().
Table 4. The results for the pairwise effects on lateral position for the conditions in Experiment 1 and 2.
Because in the overall analyses of bicycle type only effects were found on lateral position in Experiment 2, additional analyses were performed for each intervention condition in this experiment. As displayed in , the analyses revealed that cyclists with an electric bicycle maintained a larger distance from the edge than cyclists with a conventional bicycle in all conditions. However, due to the Bonferroni correction for multiple comparisons, these effects did not reach significance. Also none of the ipsative scores comparisons revealed significant effects of bicycle type.
Table 5. Lateral position effects of bicycle type for each condition in Experiment 2.
3.3. Swerving (SDLP)
As displayed in , all SDLP values were similar to the Control Condition with the exception of the Edge Line and Slanted Kerbstones in Experiment 1. The Non-Parametric Friedman Test resulted in a significant main effect of location on swerving in Experiment 1 (χ2 (7) = 47.67, p < .001) and, as displayed in , these effects were only significant in the Edge Line and Slanted Kerbstones conditions compared to the control condition. The analyses of Experiment 2 did not reveal a main effect of SDLP (χ2 (4) = 3.65, p = .46). Furthermore, analyses in which the treatments’ ipsative scores of SDLP were compared per bicycle type, only showed a medium effect on the Edge Line Intermittent 15 location. On this treatment are, it seems as if cyclists with an electric bicycle swerve less than cyclists with a conventional bicycle (MConventional = 1.87 (±6.47) and MElectric = −4.46 (±2.70). However, this effect did not reach Bonferroni-corrected significance (U = 39; z = −2.68, p = .007, r = .47).
Table 6. The results for the pairwise effects on swerving (SDLP) for the conditions in Experiment 1 and 2.
3.4. Speed
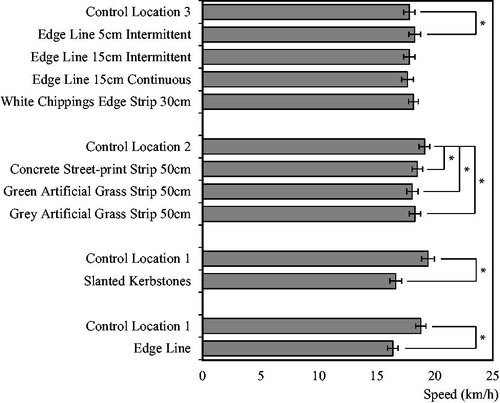
In , the average speeds per condition are listed. A non-parametric Friedman Test revealed a significant main effect in Experiment 1 (χ2 (7) = 142.43, p < .001). Further comparisons resulted in large significant differences between the control condition and each of the intervention conditions (see ), meaning that participants cycled at a higher speed in the control conditions than in the experimental conditions. The analyses also revealed a significant main effect in Experiment 2 (χ2 (4) = 27.93, p < .001) and, based on the pairwise comparisons, this effect was only significant in the 5 cm Edge Line condition (see ).
Table 7. The results for the pairwise effects on speed for the conditions in Experiment 1 and 2.
For the Green Artificial Grass and Concrete Street-print treatments, large significant effects of bicycle type on the ipsative scores of speed were found. Cyclists with an electric bicycle decreased their speed less than cyclists with a conventional bicycle on these treatment areas (see ).
Table 8. Mann–Whitney U significant test results (α ≤ .0055) for the effects of bicycle type on the Ipsative Scores of Speed per Treatment.
3.5. Subjective opinion
According to the guidelines of Landis and Koch (Citation1977, cited in Hallgren Citation2012), the researchers reached moderate, substantial, and almost perfect inter-rater reliability for the Green Artificial Grass Strip, the Concrete Street-print Strip and the Grey Artificial Grass Strips, respectively, in Experiment 1 (see ). The average percentages of the researchers’ joint agreements are also displayed in . A majority of participants remembered the interventions except for the Grey Artificial Grass strip condition in Experiment 1. Furthermore, there were no distinct differences between the subjective evaluations of the shoulder strip conditions in Experiment 1 and no clear preference could therefore be derived. In Experiment 2, however, the 15 cm Continuous Edge Line and the 30 cm White Chippings Edge Strip were the most positively evaluated interventions (see ). Examples of specific comments for the 30 cm White Chippings Edge Strip ranged from ‘clear’ and ‘smart, you will feel it instantly’ to ‘keep away from that strip!’ and ‘it makes me insecure’.
Table 9. Subjective opinions in percentages for the treatments in Experiment 1.
Table 10. Subjective opinions in percentages for the treatments in Experiment 2.
4. Discussion
4.1. Main findings
In this study, the effects of nine interventions on or near the edge of a cycle path on lateral position, swerving, and speed were examined with cyclists aged 50 years and older. Two experiments were performed of which the first contained a cycle path with either edge lines, slanted kerbstones, or three types of shoulder strips with surfaces made of grey and green artificial grass, and street-print. In the second experiment, three types of edge lines or a white edge strip made of chippings were added onto the surface of the cycle path. The participants cycled a route in one of the experiments and they passed the intervention locations and control locations, for which the latter only contained a similar sized cycle path with no additional interventions.
Participants with either a conventional or a pedal electric bicycle were recruited for the experiments. The first analyses concerned potential behavioural differences between the users of the two bicycle types. Only differences on the overall lateral position measurements are found in Experiment 2, where cyclists with an electric bicycle cycle further away from the edge of the path than cyclists with a conventional bicycle. Because this effect was only found on lateral position in Experiment 2 and not in Experiment 1, it is unclear whether these effects are generalisable to other locations. Perhaps the larger width of the path or the absence of centrelines influenced the lateral position, although this did not lead to differences in swerving behaviour or speed between the two groups.
The effects of the Edge Line treatments on cycling behaviour are inconsistent between experiments and conditions. In Experiment 1, cyclists were found to keep more distance from the edge of the cycle path, to swerve more, and to cycle slower in the Edge Line condition compared to the Control condition. In Experiment 2, however, it was found that only in the 5 cm Intermittent Edge Line condition cyclists tend to cycle faster and closer to the edge of the cycle path than in the control condition. These were large and medium effects, respectively, of which only the first reached significance. The analyses of the remaining conditions did not reveal any effects.
Because the effects are opposite and the absolute differences between the means in Experiment 2 are very small, it is difficult to fully attribute the effects to the Edge Line interventions. Because the Edge Line location of Experiment 1 was within a village, contained a slight curve in the first (outbound) part, and a bus stop platform in the second (return) part of the cycle path, it is possible that these elements also affected cycling behaviour. The outbound and return journeys of the Edge Line and control conditions in Experiment 2 were all in a very similar (rural) environment and this could explain the absence of differences between the Edge Line conditions in Experiment 2. A limitation of Experiment 2 is that there was no centreline marking and that the contrast between the road surface and the edge line conditions was lower compared to Experiment 1. It seems unlikely, however, that the contrast was too low to have an effect (McKnight, McKnight, and Tippetts Citation1998) because the vast majority of participants could remember these interventions.
The effects of the White Slanted Kerbstones are similar to the effects of the Edge Line condition of Experiment 1. Cyclists at this location cycle further away from the edge of the cycle path, swerve more, and have a lower speed compared to the control condition. Perhaps a similar limitation as with the Edge Line condition of Experiment 1 applies here as well: because the cycling lane of this intervention was 20 cm wider than the control location, it is difficult to fully ascribe the found effects to the treatment. Also, during the data scoring process the researchers noticed that many participants cut the (slight) curve on this location and it could be that this affected lateral position and SDLP. For this reason, it is recommended to further investigate these effects with a pre-post-test study design that enables measurements of both conditions in the same environment or very similar locations.
Large and significant effects were consistently found on lateral position and speed for all the shoulder strip treatments in Experiment 1. On these locations, the cyclists are positioned between 11 and 15 cm closer to the edge of the cycle path (i.e. the edge of the asphalt) and cycled up to 1 km/h slower on average compared to the control condition. This finding is similar to the behaviour of car drivers, as multiple studies such as Bella (Citation2013) and Mecheri, Rosey, and Lobjois (Citation2017) found that increasing the size of the shoulder is related to a lateral position shift towards the edge of a road. A possible explanation for the decreased lateral distance could be that the cyclists experience the shoulder strips as clear zones, similar to the effect of car drivers who are positioned closer to the edge of a road when there is less vegetation or when there are less trees or other objects near a road’s edge (Fitzpatrick, Samuel and Knodler Citation2016).
With regard to run-off crashes, a treatment is considered to increase safety if the position of cyclists is further away from the verge compared to the control condition. For this reason, the effects of the shoulder strips on lateral position seem to decrease rather than increase safety. However, the distances that cyclists shift to the right (i.e. between 11 and 15 cm) were smaller than the space that was added by the shoulder strips in-between the cycle path and the verge (i.e. 50 cm). Because the shoulder strips are only designed to create a buffer zone for cyclists to return to the cycle path, the net distance between the cyclists and the soft verge actually increased with 35–39 cm. An implication for this finding is that with the addition of shoulder strips, cyclists use the available space on the cycle path more efficiently when these strips are applied and this could provide more room for overtaking or oncoming cyclists, both being difficulties that older cyclists experience (Westerhuis and De Waard Citation2016). At the same time, the distance to the verge is also increased with a buffer zone between the cycle path and the verge.
In the 30 cm edge strip condition in Experiment 2, the cyclists were positioned approximately 8 cm further away from the verge than in the control condition. This seems as an opposite effect compared with the shoulder strips in Experiment 1, although it is important to note that the edge strip was painted on the cycle path surface itself and only visually decreases the total width of the cycle path, although it is still part of the cycle path’s surface. This could mean that the edge strip is effective in moving a cyclist away from the verge without paving an additional strip next to the cycle path. This treatment is therefore more a relocation rather than a creation of space, and these effects are similar to increasing the size of the shoulder of car drivers by shifting the edge line towards the centre of the road (Mecheri, Rosey, and Lobjois Citation2017).
The effects of the treatments in Experiment 1 on cycling speed were all large and consistent: in all treatment areas the cyclists rode slower. This can also be considered a safety increase because with a lower speed there is more time to correct a mistake compared to higher speeds. Furthermore, it is important to note that the cycling speeds were still sufficient to balance a bicycle (CROW Citation2007, cited in De Waard et al. Citation2010). In Experiment 2, however, limited effects of the treatments on cycling speed were found.
With regard to the type of bicycle (conventional or electric), it seems that the decrease in cycling speed on the Green Artificial Grass and Concrete Streetprint treatments was stronger for cyclists with a conventional bicycle than for cyclists with an electric bicycle. It could be that the speed reduction for electric bicycles is less pronounced because these bicycles will keep providing some support even if a cyclist is only pedalling slower and not braking. However, it is unclear why this effect only occurred on these specific treatments. It could be that, because of the relative ‘open’ landscape that surrounded these treatments (i.e. relatively few trees and buildings), the wind had more influence on the speed of cyclists with a conventional bicycle than on cyclists with an electric bicycle. In particular when cycling against the wind, the support that an electric bicycle provides can assist with maintaining speed.
The 30 cm edge strip was also among the most positively evaluated treatments by the cyclists in Experiment 2. Because no clear subjective preference could be derived regarding the shoulder strip conditions in Experiment 1, the concrete street-print and the white chippings edge strip treatments seem to be the preferred options based on their effects on cycling behaviour and the subjective ratings. Also, because the placement of artificial grass requires a foundation made of concrete or a similar material, the concrete street-print strip is presumably the least expensive form of the shoulder strip conditions and provides the largest effects. Although the size of the lateral position effect of the edge strip is smaller than the shoulder strips of Experiment 1, this intervention could also be cheaper to construct and be less prone to subsidence. For this reason it might be more suitable for locations where the available space next to a cycle path is restricted.
4.2. Limitations
There were also several limitations due to the study and its design. First, it is possible that the cyclists who participated in the study were relatively ‘fit’ compared to the ‘average’ older cyclist. A potential reason for this is that the study required participants to be able to cycle at least 12 or 6 km, and that they could come to the research location with their own bicycle. We would have liked to also include cyclists that rarely cycle or struggle with cycling, but response rate to calls to participate of these people is low.
Because the participants were all asked to cycle the same route, they passed all the locations in the same order in each experiment. It could therefore be that participants’ bias increased with the number of treatment conditions that they encountered because they could make an estimation of the goal of the study based on the treatments that were already passed (expectancy effect). Also the number of passed treatments alone can cause expectations and practice, independently of the content. The preferred option would be to present the conditions in a randomised order, but this was physically not possible in this research setting.
A third limitation is that all interventions were entirely new for the participants and that there might have been a novelty effect that influenced their behaviour. It could therefore be that the participants were looking at the treatments and that this lured them towards the edge of the road, automatically resulting in a different lateral position compared to a control location. Although the researchers tried to control for these influences by filtering out overtaking and ‘try out’ manoeuvres, it cannot be ruled out that an influence of these novelties remains to exist. Additionally, it could be that cyclists were more ‘used’ to one condition than another because they had spent more time on longer treatment sections than sections that were shorter. Also, small gaps between treatments can make a new encountered treatment attract attention and influence behaviour. Although the researchers tried to maintain some distance between the measurement stretches of each condition, this was not always possible due to other factors such as limited space to perform measurements or the presence of curves that prevented measurements on part of the treatment areas. These factors could therefore have influenced the measurements, although the lengths of the sections should be sufficient to assess effects especially given the fact that this study was performed in a real world situation. Further research to assess the long-term effects of the infrastructure treatments is also recommended because it is possible that cyclists get used to the different environments. As a consequence, it could be that the effects diminish over time.
4.3. Experimental control in applied research
With regard to the limitations, it should be noted that the researchers tried to gain as much experimental control as they could, although due to the applied character of this study this was not possible in all instances. However, because the treatments in this study were tested in a real cycling environment in which cyclists used their own bicycles, this is also considered a strength because of the high ecological validity.
In future studies, perhaps a more balanced approach of experimental control and applied, ecologically valid measurements can be used. For example, it could be possible to use a bicycle simulator to pre-select measures that are potentially the most effective in influencing cycling behaviour (e.g. O’Hern, Oxley, and Stevenson Citation2017). Also because it is very expensive and time-consuming to construct these treatments on a real cycle path, a simulator could give insight into the expected effects of different treatments in the real world. In a simulator, it would be possible to test different treatments in exactly the same (virtual) environments, to balance order of conditions over participants, and construct the most effective treatments in larger areas on a real cycle path.
5. Conclusions
To the best of the authors’ knowledge, this paper describes one of the first studies in which the effects of different edge lines, slanted kerbstones, shoulder strips, and edge strips on cycling behaviour are measured using a within-subjects experiment with older participants on their own bicycles. Although the effects of the edge lines and slanted kerbstones were inconsistent, large effects of the shoulder and edge strip conditions were found on cycling behaviour. In the treatments where shoulder strips were placed next to the cycle path, and contained a different type of surface than the main cycle path, cyclists maintained a smaller distance from the edge of the path and cycled at lower speeds compared to the control condition. However, because the shoulder strips were placed in-between the main cycle path and the soft verge, the net distance to the verge is increased because the average distance that cyclists moved to the right was less than the width of the shoulder strip. The white chippings edge strip condition, however, was not added next to the path but was part of the main cycle path’s surface. This treatment therefore resulted in a larger distance from the soft verge compared to the control location, essentially drifting cyclists away from the verge without paving new strips in the shoulder of a cycle path: the path is only visually narrowed. The most preferred strip interventions were the concrete street-print shoulder strips and white chippings edge strips, because these seem to have the largest effects on lateral position, are presumably the least expensive to construct, and offer solutions for different types of locations.
TERG-2019-0024-File021.docx
Download MS Word (30.4 KB)TERG-2019-0024-File020.docx
Download MS Word (30.4 KB)Acknowledgements
The authors would like to thank Bart Jelijs, Berfu Ünal, Chris Dijksterhuis, Lisa Theil, and Sietske Meuleman for their valuable assistance during the study. We would also like to thank Kees Mourits for his support with recruiting participants and the provinces of Overijssel and Fryslân for making this study possible. This study was part of the ‘Forgiving Cycle Path’ project, which is a collaboration between Royal HaskoningDHV, De Fietsersbond [Dutch Cycling Union], and the University of Groningen.
Disclosure statement
No potential conflict of interest was reported by the author(s).
Figure 7. The average cycling speed (km/h) per condition. The error bars represent the standard error of the mean (S.E.).
Additional information
Funding
References
- Anund, Anna, Göran Kecklund, Anna Vadeby, Magnus Hjälmdahl, and Torbjörn Åkerstedt. 2008. “The Alerting Effect of Hitting a Rumble Strip: A Simulator Study with Sleepy Drivers.” Accident Analysis & Prevention 40 (6): 1970–1976. doi:10.1016/j.aap.2008.08.017.
- Bella, Francesco. 2013. “Driver Perception of Roadside Configurations on Two-Lane Rural Roads: Effects on Speed and Lateral Placement.” Accident Analysis & Prevention 50: 251–262. doi:10.1016/j.aap.2012.04.015.
- Berntsen, Sveinung, Lena Malnes, Aleksander Langåker, and Elling Bere. 2017. “Physical Activity When Riding an Electric Assisted Bicycle.” International Journal of Behavioral Nutrition and Physical Activity 14 (1): 55. doi:10.1186/s12966-017-0513-z.
- Boufous, Soufiane, Julie Hatfield, and Raphael Grzebieta. 2018. “The Impact of Environmental Factors on Cycling Speed on Shared Paths.” Accident Analysis & Prevention 110: 171–176. doi:10.1016/j.aap.2017.09.017.
- Branzi, Valentina, Lorenzo Domenichini, and Francesca La Torre. 2017. “Drivers’ Speed Behaviour in Real and Simulated Urban Roads – A Validation Study.” Transportation Research Part F: Traffic Psychology and Behaviour 49: 1–17. doi:10.1016/j.trf.2017.06.001.
- CROW. 2007. Design Manual for Bicycle Traffic. Ede, The Netherlands: CROW (the National Information and Technology Platform for Transport, Infrastructure and Public Space).
- Davidse, R. J., K. van Duijvenvoorde, M. J. Boele, M. J. A. Doumen, C. W. A. E. Duivenvoorden, and W. J. R. Louwerse. 2014. Bicycle Crashes of People Aged 50 and Older: Characteristics and Accident Scenarios of Single-Sided Accidents and Collisions with Other Slow Traffic. [In Dutch]. The Hague: SWOV Institute for Road Safety Research. Accessed 29 January 2020 . https://www.swov.nl/sites/default/files/publicaties/rapport/r-2014-03a.pdf.
- De Waard, Dick, Maaike Jessurun, Frank J. J. M. Steyvers, Peter T. F. Reggatt, and Karel A. Brookhuis. 1995. “Effect of Road Layout and Road Environment on Driving Performance, Drivers’ Physiology and Road Appreciation.” Ergonomics 38 (7): 1395–1407. doi:10.1080/00140139508925197.
- De Waard, Dick, Paul Schepers, Wieke Ormel, and Karel Brookhuis. 2010. “Mobile Phone Use While Cycling: Incidence and Effects on Behaviour and Safety.” Ergonomics 53 (1): 30–42. doi:10.1080/00140130903381180.
- De Waard, Dick, Frank J. J. M. Steyvers, and Karel A. Brookhuis. 2004. “How Much Visual Road Information is Needed to Drive Safely and Comfortably?” Safety Science 42 (7): 639–655. doi:10.1016/j.ssci.2003.09.002.
- Dill, Jennifer, and Geoffrey Rose. 2012. “Electric Bikes and Transportation Policy: Insights from Early Adopters.” Transportation Research Record: Journal of the Transportation Research Board 2314 (1): 1–6. doi:10.3141/2314-01.
- Dozza, Marco, Giulio Francesco Bianchi Piccinini, and Julia Werneke. 2016. “Using Naturalistic Data to Assess e-Cyclist Behavior.” Transportation Research Part F: Traffic Psychology and Behaviour 41: 217–226. doi:10.1016/j.trf.2015.04.003.
- Fabriek, Eva, Dick De Waard, and J. Paul Schepers. 2012. “Improving the Visibility of Bicycle Infrastructure.” International Journal of Human Factors and Ergonomics 1 (1): 98–115. doi:10.1504/IJHFE.2012.045274.
- Fitzpatrick, Cole D., Siby Samuel, and Michael A. Knodler Jr. 2016. “Evaluating the Effect of Vegetation and Clear Zone Width on Driver Behavior Using a Driving Simulator.” Transportation Research Part F: Traffic Psychology and Behaviour 42 (1): 80–89. doi:10.1016/j.trf.2016.07.002.
- Fridstrom, L., J. Ifver, S. Ingebrigtsen, R. Kulmala, and T. L. Krogsgard. 1995. “Measuring the Contribution of Randomness, Exposure, Weather, and Daylight to the Variation in Road Accident Counts.” Accident Analysis & Prevention 27 (1): 1–20. doi:10.1016/0001-4575(94)E0023-E.
- Fritz, C. O., P. E. Morris, and Jennifer J. Richler. 2012. “Effect Size Estimates: Current Use, Calculations, and Interpretation.” Journal of Experimental Psychology: General 141 (1): 2–18. doi:10.1037/a0024338.
- Gross, Frank, and Eric T. Donnel. 2011. “Case–Control and Cross-Sectional Methods for Estimating Crash Modification Factors: Comparisons from Roadway Lighting and Lane and Shoulder Width Safety Effect Studies.” Journal of Safety Research 42 (2): 117–129. doi:10.1016/j.jsr.2011.03.003.
- Hallgren, K. A. 2012. “Computing Inter-Rater Reliability for Observational Data: An Overview and Tutorial.” Tutorials in Quantitative Methods for Psychology 8 (1): 23–34. doi:10.20982/tqmp.08.1.p023.
- Hatfield, Julie, Susanne Murphy, and R. F. Soames Job. 2008. “Beliefs and Behaviours Relevant to the Road Safety Effects of Profile Lane-Marking.” Accident Analysis & Prevention 40 (6): 1872–1879. doi:10.1016/j.aap.2008.07.004.
- Hatfield, Julie, Susanne Murphy, R. F. Soames Job, and Wei Du. 2009. “The Effectiveness of Audio-Tactile Lane-Marking in Reducing Various Types of Crash: A Review of Evidence, Template for Evaluation, and Preliminary Findings from Australia.” Accident Analysis & Prevention 41 (3): 365–379. doi:10.1016/j.aap.2008.12.003.
- Hatfield, Julie, and Prasannah Prabhakharan. 2016. “An Investigation of Behaviour and Attitudes Relevant to the User Safety of Pedestrian/Cyclist Shared Paths.” Transportation Research Part F: Traffic Psychology and Behaviour 40: 35–47. doi:10.1016/j.trf.2016.04.005.
- Hoc, J. M. 2001. “Towards Ecological Validity of Research in Cognitive Ergonomics.” Theoretical Issues in Ergonomics Science 2 (3): 278–288. doi:10.1080/14639220110104970.
- Holdridge, Jason M., Venky N. Shankar, and Gudmundur F. Ulfarsson. 2005. “The Crash Severity Impacts of Fixed Roadside Objects.” Journal of Safety Research 36 (2): 139–147. doi:10.1016/j.jsr.2004.12.005.
- Jordan, Gihon, and Larry Leso. 2000. “Power of the Line: Shared-Use Path Conflict Reduction.” Transportation Research Record: Journal of the Transportation Research Board 1705 (1): 16–19. doi:10.3141/1705-03.
- Khan, Mubassira, Ahmed Abdel-Rahim, and Christopher J. Williams. 2015. “Potential Crash Reduction Benefits of Shoulder Rumble Strips in Two-Lane Rural Highways.” Accident Analysis & Prevention 75: 35–42. doi:10.1016/j.aap.2014.11.007.
- Kovácsová, N., J. C. F. de Winter, A. L. Schwab, M. Christoph, D. A. M. Twisk, and M. P. Hagenzieker. 2016. “Riding Performance on a Conventional Bicycle and a Pedelec in Low Speed Exercises: Objective and Subjective Evaluation of Middle-Aged and Older Persons.” Transportation Research Part F: Traffic Psychology and Behaviour 42: 28–43. doi:10.1016/j.trf.2016.06.018.
- Landis, J. R., and G. G. Koch. 1977. “The Measurement of Observer Agreement for Categorical Data.” Biometrics 33 (1): 159–174. doi:10.2307/2529310.
- Langford, Brian Casey, Jiaoli Chen, and Christopher R. Cherry. 2015. “Risky Riding: Naturalistic Methods Comparing Safety Behavior from Conventional Bicycle Riders and Electric Bike Riders.” Accident Analysis & Prevention 82: 220–226. doi:10.1016/j.aap.2015.05.016.
- Lewis-Evans, Ben, and Samuel G. Charlton. 2006. “Explicit and Implicit Processes in Behavioural Adaptation to Road Width.” Accident Analysis & Prevention 38 (3): 610–617. doi:10.1016/j.aap.2005.12.005.
- Manuel, Aaron, Karim El-Basyouny, and Md. T. Islam. 2014. “Investigating the Safety Effects of Road Width on Urban Collector Roadways.” Safety Science 62: 305–311. doi:10.1016/j.ssci.2013.09.005.
- McKnight, A. Scott, A. James McKnight, and A. Scott Tippetts. 1998. “The Effect of Lane Width and Contrast upon Lane Keeping.” Accident Analysis & Prevention 30 (5): 617–624. doi:10.1016/S0001-4575(98)00015-3.
- Mecheri, Sami, Florence Rosey, and Régis Lobjois. 2017. “The Effects of Lane Width, Shoulder Width, and Road Cross-Sectional Reallocation on Drivers’ Behavioral Adaptations.” Accident Analysis & Prevention 104: 65–73. doi:10.1016/j.aap.2017.04.019.
- O’Hern, Steve, Jennie Oxley, and Mark Stevenson. 2017. “Validation of a Bicycle Simulator for Road Safety Research.” Accident Analysis & Prevention 100: 53–58. doi:10.1016/j.aap.2017.01.002.
- Ogden, K. W. 1997. “The Effects of Paved Shoulders on Accidents on Rural Highways.” Accident Analysis & Prevention 29 (3): 353–362. doi:10.1016/S0001-4575(97)00001-8.
- Oja, P., S. Titze, A. Bauman, B. de Geus, P. Krenn, B. Reger-Nash, and T. Kohlberger. 2011. “Health Benefits of Cycling: A Systematic Review.” Scandinavian Journal of Medicine & Science in Sports 21 (4): 496–509. doi:10.1111/j.1600-0838.2011.01299.x.
- Persaud, B. N., R. A. Retting, and C. A. Lyon. 2004. “Crash Reduction following Installation of Centerline Rumble Strips on Rural Two-Lane Roads.” Accident Analysis & Prevention 36 (6): 1073–1079. doi:10.1016/j.aap.2004.03.002.
- Poos, H., Tim L. Lefarth, Jorrit S. Harbers, Klaus W. Wendt, Mostafa El Moumni, and Inge H. F. Reininga. 2017. “E-Bikers Are More Often Seriously Injured after a Bicycle Crash.” Nederlands tijdschrift voor geneeskunde 161: D1520. https://www.ntvg.nl/artikelen/e-bikers-raken-vaker-ernstig-gewond-na-fietsongeval/volledig
- Reynolds, Conor C. O., M. Anne Harris, Kay Teschke, Peter A. Cripton, and Meghan Winters. 2009. “The Impact of Transportation Infrastructure on Bicycling Injuries and Crashes: A Review of the Literature.” Environmental Health 8 (1): 47. doi:10.1186/1476-069X-8-47.
- Rijkswaterstaat. 2016. “Traffic safety of the elderly: Interventions to limit traffic risks of the elderly in the year 2015.” [In Dutch.] Accessed 14 January 2019. https://www.rijksoverheid.nl/binaries/rijksoverheid/documenten/rapporten/2016/05/25/verkeersveiligheid-ouderen/notitie-verkeersveiligheid-ouderen-definitief.pdf
- Schepers, Paul, and Berry den Brinker. 2011. “What Do Cyclists Need to See to Avoid Single-Bicycle Crashes?” Ergonomics 54 (4): 315–327. doi:10.1080/00140139.2011.558633.
- Schepers, J. P., E. Fishman, P. den Hertog, K. Klein Wolt, and A. L. Schwab. 2014. “The Safety of Electrically Assisted Bicycles Compared to Classic Bicycles.” Accident Analysis & Prevention 73: 174–180. doi:10.1016/j.aap.2014.09.010.
- Schepers, Paul, Henk Stipdonk, Rob Methorst, and Jake Olivier. 2017. “Bicycle Fatalities: Trends in Crashes with and without Motor Vehicles in The Netherlands.” Transportation Research Part F: Traffic Psychology and Behaviour 46: 491–499. doi:10.1016/j.trf.2016.05.007.
- Schepers, P., D. Twisk, E. Fishman, A. Fyhri, and A. Jensen. 2017. “The Dutch Road to a High Level of Cycling Safety.” Safety Science 92: 264–273. doi:10.1016/j.ssci.2015.06.005.
- Schepers, Paul, and Karin Klein Wolt. 2012. “Single-Bicycle Crash Types and Characteristics.” Cycling Research International 2: 119–135. Accessed 14 January 2019. https://www.researchgate.net/profile/Paul_Schepers/publication/230867692_Single-Bicycle_Crash_Types_and_Characteristics/links/0fcfd5058be6e5d064000000/Single-Bicycle-Crash-Types-and-Characteristics.pdf
- Schepers, Paul. 2013. “A Safer Road Environment for Cyclists.” PhD diss., Delft University of Technology, Delft.
- Schleinitz, K., T. Petzoldt, L. Franke-Bartholdt, J. Krems, and T. Gehlert. 2017. “The German Naturalistic Cycling Study – Comparing Cycling Speed of Riders of Different e-Bikes and Conventional Bicycles.” Safety Science 92: 290–297. doi:10.1016/j.ssci.2015.07.027.
- Steyvers, Frank J. J. M., and Dick De Waard. 2000. “Road-Edge Delineation in Rural Areas: Effects on Driving Behaviour.” Ergonomics 43 (2): 223–238. doi:10.1080/001401300184576.
- Theurel, J., A. Theurel, and R. Lepers. 2012. “Physiological and Cognitive Responses When Riding an Electrically Assisted Bicycle versus a Classical Bicycle.” Ergonomics 55 (7): 773–781. doi:10.1080/00140139.2012.671964.
- Van Houten, Ron, and Cara Seiderman. 2005. “How Pavement markings influence bicycle and motor vehicle positioning: A case study in Cambridge, MA.” Accessed 26 September 2019. https://www.cambridgema.gov/∼/media/Files/CDD/Transportation/Bike/bike_hamp_study.pdf
- Vlakveld, Willem P., Divera Twisk, Michiel Christoph, Marjolein Boele, Rommert Sikkema, Roos Remy, and Arend L. Schwab. 2015. “Speed Choice and Mental Workload of Elderly Cyclists on e-Bikes in Simple and Complex Traffic Situations: A Field Experiment.” Accident Analysis & Prevention 74: 97–106. doi:10.1016/j.aap.2014.10.018.
- Wegman, Fred, Letty Aarts, and Charlotte Bax. 2008. “Advancing Sustainable Safety National Road Safety Outlook for The Netherlands for 2005–2020.” Safety Science 46 (2): 323–343. doi:10.1016/j.ssci.2007.06.013.
- Wegman, Fred, Fan Zhang, and Atze Dijkstra. 2012. “How to Make More Cycling Good for Road Safety?” Accident Analysis & Prevention 44 (1): 19–29. doi:10.1016/j.aap.2010.11.010.
- Westerhuis, Frank, L. H. Jelijs, A. B. M. Fuermaier, and Dick De Waard. 2017. “Using Optical Illusions in the Shoulder of a Cycle Path to Affect Lateral Position.” Transportation Research Part F: Traffic Psychology and Behaviour 48: 38–51. doi:10.1016/j.trf.2017.04.014.
- Westerhuis, Frank, and Dick De Waard. 2016. “Using Commercial GPS Action Cameras for Gathering Naturalistic Cycling Data.” Journal of the Society of Instrument and Control Engineers(SICE) of Japan 55 (5): 422–430. doi:10.11499/sicejl.55.422.
- Wu, Kun Feng, Eric T. Donnel, and Jonathan Aguero-Valverde. 2014. “Relating Crash Frequency and Severity: Evaluating the Effectiveness of Shoulder Rumble Strips on Reducing Fatal and Major Injury Crashes.” Accident Analysis & Prevention 67: 86–95. doi:10.1016/j.aap.2014.02.004.
- Zegeer, Charles V., Donald W. Reinfurt, Joseph Hummer, Lynne Herf, and William Hunter. 1988. “Safety Effects of Cross-Section Design for Two-Lane Roads.” Transportation Research Record 1195: 20–32. Accessed 14 January 2019. http://onlinepubs.trb.org/Onlinepubs/trr/1988/1195/1195-003.pdf
- Zegeer, Charles V., and Forrest M. Council. 1995. “Safety Relationships Associated with Cross-Sectional Roadway Elements.” Transportation Research Record, no. 1512: 29-36. Accessed 14 January 2019. http://onlinepubs.trb.org/Onlinepubs/trr/1995/1512/1512-005.pdf
Appendix A. The questions of the post-ride interviews for Experiment 1 and Experiment 2
Appendix B. Exclusion criteria and the amount of cyclists of whom (parts of the) measurements were discarded from the analyses