
Abstract
The current studies explored the roles of the visuospatial and phonological working memory subsystems on drivers’ gap acceptance and memory for approaching vehicles at junctions. Drivers’ behaviour was measured in a high-fidelity driving simulator when at a junction, with, and without a visuospatial or phonological load. When asked to judge when to advance across the junction, gap acceptance thresholds, memory for vehicles and eye movements were not different when there was a secondary task compared to control. However, drivers’ secondary task performance was more impaired in the visuospatial than phonological domain. These findings suggest that drivers were able to accept impairment in the secondary task while maintaining appropriate safety margins and situational awareness. These findings can inform the development of in-car technologies, improving the safety of road users at junctions.
Practitioner summary: Despite research indicating that concurrent performance on working memory tasks impairs driving, a matched visuospatial or phonological memory load did not change drivers’ gap acceptance or situational awareness at junctions. Drivers displayed appropriate compensatory behaviour by prioritising the driving task over the visuospatial secondary task.
Abbreviations: ROW: right of way; RIG: random time interval generation
1. Introduction
Crash data in the UK show that intersections are the highest risk road segments with 579 fatalities reported at junctions in 2016 (Department for Transport Citation2017). Many of these crashes are ‘right of way’ (ROW) crashes (Clarke et al. Citation2007; Robbins, Allen, and Chapman Citation2018a). Previous research has investigated drivers’ behaviour at junctions with the aim, ultimately, of reducing the amount of crashes occurring (e.g. Robbins and Chapman Citation2018) however, little is known about the cognitive processes involved in deciding whether it is safe to pull out into a junction.
The role of working memory in driving behaviour has been previously researched, however, the majority of these studies have focussed on driving on rural roads and general driving behaviour measures (e.g. Jamson and Merat Citation2005; Merat et al. Citation2012), rather than the junction situation. However, given that previous research has found that working memory is increasingly important in tasks that require the integration of information over different screens (Hardiess, Gillner, and Mallot Citation2008), it is particularly important to investigate the effect of working memory load on driving tasks that require the integration of information over multiple fields of view.
Working memory can be conceptualised as a central executive component and two sub-systems known as the visuospatial sketchpad and the phonological loop (e.g. Baddeley Citation2007). The visuospatial sketchpad is involved with the temporary storage of visual objects and the maintaining of object location and movement (Salway and Logie Citation1995). Previous research has investigated the role of the visuospatial sketchpad while driving by presenting drivers with secondary visual search tasks (Wu et al. Citation2017), as well as more ecologically valid tasks, such as in-vehicle information systems displaying routing information (Dewing, Johnson, and Stackhouse Citation1995; Tsimhoni and Green Citation2001). These studies found that drivers had reduced driving performance when interacting with the visual tasks.
In contrast, the phonological loop stores verbal information (Baddeley Citation2012). Although the phonological loop has often been neglected in the driving literature, some studies have found that concurrent performance on verbal working memory tasks can impair simulated driving performance (Oron-Gilad, Ronen, and Shinar Citation2008; Zhang, Savage, and Bowers Citation2018), in particular degrading drivers’ situational awareness (Hirano, Lee, and Itoh Citation2018). Other complementary evidence suggests that simulated driving itself impairs performance on working memory tasks (Radeborg, Briem, and Hedman Citation1999).
An issue with many of the previous studies is that the working memory tasks often involve the presentation of visual information during the task itself. Under these conditions changes in behaviour and visual search can be directly related to the need to acquire information from a visual display, as drivers often need to take their eyes off the road. Although this is important when assessing real in-vehicle displays, it creates theoretical problems in deciding whether interference is because of problems in acquiring information, or in holding and processing it.
One visual secondary task which did not require drivers to take their eyes off the road was used by Johannsdottir and Herdman (Citation2010). This study investigated the role of working memory on drivers’ situational awareness for vehicles in the front field of view and the rear view, with visuospatial or phonological load tasks implemented to selectively interfere with the two working memory subsystems. The visuospatial task comprised of participants being presented with pairs of clock times over a speaker, and were asked to visualise the angle formed by the arms of the clock to judge whether the angle formed by each pair was the same or different. While this task was chosen to interfere with visuospatial processing, it was conducted at the same time as the driving task.
Johannsdottir and Herdman (Citation2010) concluded that different subsystems of working memory were involved in different parts of junction manoeuvres; the visuospatial subsystem’s main focus is on the environment in the front-view and the phonological loop can be used to maintain and update information in the rear view. This finding supported previous research which has found that more than 80% of a driver’s gaze time is allocated towards the forward field of view and therefore the visuospatial subsystem plays an important role in frequently updating situational awareness (Harbluk et al. Citation2007). The phonological loop has also been shown to be involved in the maintenance of information that is not continuously in view (Baddeley, Chincotta, and Adlam Citation2001).
This finding could be important for understanding drivers’ behaviour and situational awareness at intersections, particularly given that junction manoeuvres often require the driver to retain task relevant information in some form of working memory while making large head movements to scan the environment to both left and right. A previous validation study which compared drivers’ visual search in a driving simulator and on-road found that drivers have comparable patterns of head movements in both environments, and adapt this effortful visual search to effectively scan for potentially relevant hazards (Robbins, Allen, and Chapman Citation2019).
The current study is specifically designed to explore driver behaviour during retention of a visual or phonological load without requiring either acquisition or output of secondary information during the core driving task. This therefore represents the first study to investigate the contributions of the visuospatial and phonological subsystems of working memory using standard, theoretically motivated, secondary tasks, together, on a junction task while measuring driver’s performance in terms of gap acceptance, memory for vehicles and patterns of attention.
1.1. Gap acceptance and compensation
Whenever two tasks are performed together, it is possible that performance on one task can be ‘traded off’ against performance on the other task, especially if both tasks use the same underlying processes. It has been suggested that working memory capacity is related to gap acceptance behaviours at junctions (Cooper and Zheng Citation2002), which leads to the suggestion that interference with the visuospatial and phonological subsystems might elicit such compensatory behaviours (Guerrier, Manivannan, and Nair Citation1999; Liao et al. Citation2016). Previous studies have found that drivers reduce speed and increase headway when the level of interference from a secondary task increases (Brookhuis, de Vries, and De Waard Citation1991). More specifically, previous research has found that perception and decision making in gap acceptance paradigms can be impaired by the interference of a secondary task (Brown, Tickner, and Simmonds Citation1969).
It is likely that drivers adjust their behaviour in response to an increase in the level of risk on the road, termed risk compensation. This might be particularly critical when a secondary task shares resources with driving. Given that driving is predominantly a visual task (Owsley and McGwin Citation2010), we might suggest that performing a visuospatial secondary task would be more likely to exceed drivers’ capabilities, with a larger difference between capabilities and demand (Fuller Citation2005). This may lead to compensatory behaviours to restore control of the situation, for example leaving larger (safer) gaps when performing a simultaneous visuospatial memory load.
To be able to measure whether drivers vary the size of the gaps they accept, it is important to be able to measure performance at a range of gaps, as drivers have been seen to be inconsistent in their gap acceptance judgements (Amin and Maurya Citation2015). Previous studies that have presented approaching vehicles at a limited and predetermined set of distances (Mitsopoulos-Rubens and Lenné Citation2012; Scott et al. Citation2013) can be argued to be unsatisfactory. The current study used a variation of a paradigm that creates situations where drivers’ gap acceptance thresholds are calculated, using an adaptive staircase procedure (Robbins, Allen, and Chapman Citation2018b), estimating the exact distance approaching vehicles need to be from a junction for individual drivers to have a 50% chance of pulling out.
1.2. Measuring memory for vehicles and eye movements
Drivers’ behaviour at junctions is dependent on an accurate representation of their current environment, often described as ‘situational awareness’ (Endsley Citation1995). In the present study we measure memory for vehicles in the road and eye movements as proxies for situational awareness.
Recent research has suggested that working memory is vital for situational awareness (Johannsdottir and Herdman Citation2010). Thus, it can be predicted that any secondary working memory load might interfere with drivers’ maintenance of memory for approaching vehicles. Furthermore, following the logic above, a visuospatial task is likely to create the greatest impairment. Here we measure memory for the vehicles present when drivers choose to pull out into a gap.
Situational awareness requires selective attention, with drivers needing to attend to relevant objects in the environment. The majority of previous research which has investigated the effect of a secondary task on drivers’ visual attention while driving has found that a visuospatial task, e.g. mental rotation of letters, produced longer mean fixation durations and a decreased horizontal and vertical spread of search compared to a phonological task, e.g. repeating words which started with a given letter (Sodhi, Reimer, and Llamazares Citation2002; Hollingworth, Richard, and Luck Citation2008).
1.3. Individual differences
Individual differences in drivers’ on-road behaviour may predict the degree to which drivers’ gap acceptance and memory for vehicles are affected when working memory is loaded by a secondary task. The Driver Behaviour Questionnaire (Reason et al. Citation1990) is a self-report measure of driving behaviour which predicts road crashes (De Winter and Dodou Citation2010). The questionnaire divides self-report behaviour into three categories that include violations, errors and lapses. Lapses are ‘problems in memory and attention’ and errors are ‘failures in observation and misjudgements’ (Parker, Lajunen, and Stradling Citation1998). Given that situational awareness is reliant on the selective attention in the environment, and the maintaining of this attention over time, this links these two factors to drivers’ memory for vehicles (Wickens, Toplak, and Wiesenthal Citation2008). Pulling out in front of another vehicle can sometimes be seen to be an example of a violation (Elander, West, and French Citation1993). Given that our gap acceptance procedure calculates an individual driver’s critical gap which they deliberately choose to accept (Robbins, Allen, and Chapman Citation2018b), we would thus predict that drivers who report high numbers of violations in their everyday driving might systematically accept smaller (riskier) gaps at junctions (De Winter et al. Citation2010).
1.4. The present studies
The current investigation is made up of two studies. Firstly, an initial pilot study was conducted to decide upon, and match the memory load of the visuospatial and phonological tasks used in-vehicle. The aim of the second driving study was to understand the use of working memory during manoeuvres at junctions, investigating the different roles of the visuospatial and phonological subsystems.
1.5. Hypotheses
It was hypothesised that drivers’ gap acceptance thresholds will be larger (safer) on secondary task trials compared to control trials with this effect more pronounced for the visuospatial task compared to the phonological task. Similarly, it was hypothesised that a secondary task would interfere with the maintenance of drivers’ memories for vehicles at junctions compared to control trials, with this effect being larger with a visuospatial load compared to a phonological load.
In regards to drivers’ visual attention, we predicted that mean fixation durations would be longer and horizontal spread of search would be narrower when completing a secondary task compared to control trials, with this difference being larger with a visuospatial load than a phonological load. We predicted that DBQ self-reported violations would be the best predictor of drivers’ gap acceptance thresholds, and self-reported lapses and errors would be the best predictors of vehicle forgetting rates.
To pre-empt our results, a load of five items for the visuospatial and phonological tasks were used. Contrary to the hypotheses based on previous literature, we did not find large effects of secondary task on the key driving measures in the driving study, thus we followed with exploratory analysis on drivers’ secondary task performance in order to better understand whether drivers are displaying compensatory behaviours.
Study preregistration can be found at: Robbins, Allen, and Chapman (Citation2018c).
2. Pilot study: estimating secondary task load
2.1. Method
2.1.1. Participants
We performed an initial study to match the memory load of a phonological and visuospatial task which could be used in-vehicle. Twelve participants took part in the study, each completing both the visuospatial and phonological tasks. These participants were recruited as part of a convenience sample; therefore, they were all students from the University of Nottingham and between the ages of 18–25. A power analysis was conducted using the software package G*Power 3.1 (Faul et al. Citation2007), where a sample size of 12 provided reasonable power (>.70) to detect a large within-subject effect of Task Type (d = .8).
2.1.2. Stimuli and apparatus
The visuospatial task was a variant of the Corsi Block Task (Corsi Citation1972) and the phonological task was a Letter Number Sequencing Task (Crowe Citation2000). In order to match task difficulty, both secondary load tasks were tested while participants were performing a standard central load task that was unrelated to driving. Vandierendonck, De Vooght, and Van der Goten (Citation1998b) describe a task that interferes with the central executive component of working memory (Baddeley Citation2007), while keeping the load on the visuospatial and phonological sub-systems relatively low. This task, known as ‘random time interval generation’ (RIG), requires participants to produce, on average, two taps on a keyboard per second, but with the intervals between successive taps being kept unpredictable.
Our computerised variant of the Corsi Block Task was based on Toepper et al. (Citation2010) and requires simple two-alternative forced choice responses. This task was chosen as it was easy to conduct in-vehicle on a standard display. Nine blocks on a display screen are presented and five of them light up in an order, which the participant is required to remember.
The phonological task was based on Crowe (Citation2000), and contained a mixed letter-digit code created from nine possible letters/digits: B, H, J, F, X, 2, 4, 7, 9. These letters and digits were chosen as they were not phonologically confusable (see Vandierendonck, De Vooght, and Van der Goten Citation1998a). This code appeared sequentially, one character at a time. This presentation allowed the visuospatial and phonological task to be presented and responded to in a similar manner.
Both the visuospatial and the phonological tasks, as well as the primary task were presented on a laptop using PsychoPy (v1.85.2) (Peirce et al. Citation2019). See Supplementary File 1 for details regarding the presentation of the primary and secondary tasks.
2.1.3. Procedure
At the start of each trial, participants were presented with either a visuospatial or phonological load to remember. They were then instructed to complete the RIG for 20 s, requiring participants to produce, on average, two presses of the laptop space bar per second (40 in total). After this, participants were tested for each item in the visuospatial or phonological sequence. For each item, participants were presented with a forced choice recognition task, with two possible Corsi blocks, or two possible letter-digits to choose from. The participant had to indicate verbally to the experimenter whether the left or right response was correct. This would continue through the rest of the items in the sequence, See . After the memory test for each sequence, the participants were provided with feedback regarding their performance on the RIG task, indicating the number of taps they produced in the 20 s. Trials were allowed if the participant tapped between 30 and 50 times in the 20 s period, and the experimenter did not notice a particular rhythm in their taps. If these criteria were not met, the participant was warned and the trial repeated, mirroring the procedure conducted by Vandierendonck, De Vooght, and Van der Goten (Citation1998b) however, in the current study there were no repeats of trials required.
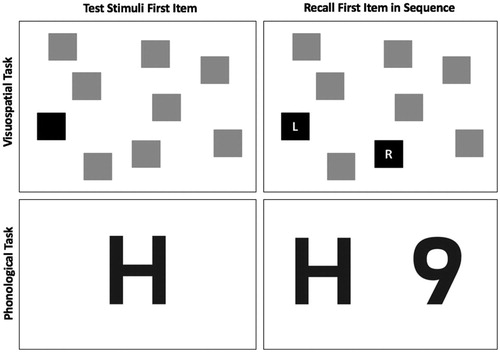
Figure 1. The left column shows an example of the first Corsi block item presented in a sequence and the first letter/number item presented in the Letter-Digit Sequence. The right column shows an example of the corresponding forced choice recall which was displayed to participants for the first item in the sequence. In both tasks, the participant chose whether the left or the right of the two response items matched the one shown at encoding. This process was then repeated for each item in the sequence. For the pilot study the sequence length was increased until span was achieved, while for the driving study a fixed sequence length of five items was used.
Participants received the visuospatial task and phonological task alternately until they had reached their memory span in one modality, and then additional trials in the remaining modality were run until memory span for that task was achieved. Half the participants started with the visuospatial task and half with the phonological task. The standard ascending span procedure used by Vandierendonck, De Vooght, and Van der Goten (Citation1998b) was used to determine the number of secondary task items presented to participants. See Supplementary File 2 for details. On average, the procedure took 15 min.
2.2. Data analysis and results
Participants were found to have a span of between five and six items in each domain (phonological task mean = 5.83, SD = 1.47, visuospatial task mean = 5.58, SD = 1.78). A within-subjects t-test to conducted to investigate any differences in memory span for the visuospatial and phonological tasks. The span in the two domains was not significantly different [t (11) = .34, p = .74, d = .140].
Based on these results we used a sequence length of five items for the in-vehicle experiments. This sequence length was chosen to represent the longest sequence that most participants would be able to accurately remember for 20 s under a central primary load, and therefore was sufficient to load the two working memory subsystems.
3. The driving study: Gap acceptance thresholds with a secondary task
3.1. Design
The driving study consisted of a 2 × 2 mixed design with a repeated measures factor of Task Presence (secondary task vs. control), and a between group factor of Task Type, (visuospatial task vs. phonological task). The dependent variables were gap acceptance thresholds, memory for vehicles, mean fixation duration and spread of search.
3.2. Participants
This research complied with the American Psychological Association Code of Ethics and was approved by the Institutional Review Board at The University of Nottingham. Informed consent was obtained from each participant.
Fifty-six English speaking participants were recruited through advertisement at the University of Nottingham, 40 participants received course credit for their participation and 16 received a £5 inconvenience allowance. A power analysis was conducted (Faul et al. Citation2007). An overall sample size of 56 provides adequate power (>.95) to detect a medium within-subjects effect of Task Presence (f = .25) or within-between interaction between Task Presence x Task Type, and provided enough power (>0.92) to detect a large (f = .4) between subjects effect.
Twenty- eight participants performed the visuospatial secondary task (Mean age = 21.07, SD = 2.24, Range = 18–27; Male = 5, Female = 23). These participants had held a driving licence for between 4 and 107 months (Mean= 34.18 months). They had a reported annual mileage between 0 and 30,000 miles (Mean= 2800 miles) and a total mileage between 0 and 100,000 miles (Mean = 18,026.43 miles).
Twenty-eight participants performed the phonological task (Mean age = 21.43, SD = 2.36, Range = 18–27; Male = 8, Female = 20). These participants had held a driving licence for between 3 and 102 months (Mean= 43.82 months). They had a reported annual mileage between 0 and 13,000 miles (Mean= 2908.39 miles) and a total mileage between 100 and 100,000 miles (Mean = 14,426.43 miles).
3.3. Stimuli and apparatus
The driving study took place in Nottingham Integrated Transport and Environment Simulation (NITES) facility’s, high fidelity driving simulator. This simulator comprises of a full BMW Mini, housed within a projection dome and mounted on a six-degree of freedom motion platform with a 360-degree projection screen. For the current study, the motion base was turned off because the abrupt terminations of each trial made the motion cues confusing. The scenarios were formed on the screens using six projectors. The simulator was equipped with two static linked FaceLAB 5.0 eye tracking systems, which allowed participants’ eye movements to be tracked continuously over a range of approximately 120 degrees in front of the driver. In addition, the car also contained an internal screen on the right-hand side of the steering wheel which was used to present the secondary tasks before and after each trial using a custom build PsychoPy script. See Supplementary File 3 for details regarding the presentation of the secondary task stimuli.
XPI (XPI Simulation, London, UK) driving simulation software was used to create the scenarios. As the experiment was conducted in the UK, all driving was conducted on the left-hand side of the roads, in a right-hand drive vehicle. All scenarios took place at the same urban intersection with a ‘Stop sign’ at the end. The junction chosen for the scenarios was a flat junction, which had equal visibility to the left and right when participants stopped at the junction.
In order to record participants’ responses for the memory trials, a KODAK PIXPRO 360-degree action video camera was mounted on top of the BMW Mini roof, directly above the driver’s head. This camera allowed for the full 180-degree front field of view to be visible, allowing the experimenter to see what vehicles were approaching the junction at all times and compare this with the participants’ responses.
3.4. Procedure
Participants completed a short ‘Driving Experience’ questionnaire containing questions about frequency and extent of driving. They then completed the extended 27 item ‘Driver Behaviour Questionnaire’ (DBQ) (Lajunen, Parker, and Summala Citation2004). Participants entered the driving simulator, and the simulator eye trackers were calibrated. Participants then completed at least two general traffic practice trials, until they indicated that they were familiar with the simulator and the secondary task. These practice trials consisted of the same driving task as the experimental scenarios, therefore were of the same length, however, they contained general traffic instead of two controlled vehicles. Following this, all participants were given the same instructions prior to starting the experiment, with the only changes in wording depending on the secondary task, See Supplementary File 4. It was stressed that both the driving task and additional task must be performed as well and as accurately as possible. Simulator sickness questionnaires were also administered throughout the experiment (Kennedy et al. Citation1993) however, no participant reported simulator sickness during the experiment.
The primary task required drivers to drive across an intersection in a high-fidelity driving simulator. All driving scenarios involved the same urban intersection, which was controlled with a ‘Stop’ sign, and had 20 mph speed limit signs. The traffic from the left and right had priority over the driver’s vehicle. Each scenario lasted around 20 s, with participants always starting 80 m from the junction and ending when they had pulled out the junction and continued straight on for 30 m.
Each scenario contained two vehicles, with no other traffic present at the junction. One vehicle approached from the right and one approached from the left. There were two vehicle combinations; two cars (car/car) or one car and one motorcycle (car/motorcycle). Both vehicles began at the same distance (40 m–100 m) from the junction at a constant speed of 20 mph. The vehicles were always visible when the participant arrived at the junction. The distance at which the approaching vehicles varied is described below.
On secondary task trials, the memory load stimuli were presented to the driver at the start of the scenario. This was either the visuospatial Corsi Block Task or the phonological Letter Number Sequencing task. The driver then completed the primary driving task, by approaching the intersection and pulling out when they felt it was safe to do so and continuing straight on. This driving task was expected to use some of the same working memory resources as the secondary tasks. Once the junction was cleared, the scenario terminated, and the driver was tested for all five items in the secondary task sequence one after the other. The driver indicted verbally to the experimenter which of two alternative items displayed on the screen they believed was the correct answer by saying either ‘left’ or ‘right’.
3.4.1. Gap acceptance distance estimation
The first twelve trials carried out by each participant were designed to estimate their gap acceptance threshold. The approaching vehicles in these trials were presented at a set of constant distances: 45 m, 55 m, 65 m, 75 m, 85 m and 95 m, completed in ascending order. Trials at each of these distances were presented with, and without a secondary task (two sets of three car/car trials and three car/motorcycle trials). Four orders of these 12 trials were created, in order to counterbalance vehicle type and task presence. The direction of the vehicles in the car/car and car/motorcycle pairings (left or right) was randomised.
Performance was measured in terms of whether drivers chose to pull out, or wait for crossing vehicles to pass. These data were fitted with a psychometric gumbel function, with the mean of the posterior distribution being updated on a trial by trial basis using a Palamedes MATLAB script (Kingdom and Prins Citation2010) and this was used to provide estimates of the driver’s gap acceptance threshold, in metres. The calculated thresholds represent an estimate of the distance of approaching vehicles at which the participant has a 50% probability of accepting the gap. Separate thresholds were estimated for trials with a secondary task, control trials and a combined threshold which was based on all trials irrespective of whether a secondary task was present.
3.4.2. Recall trials
After the threshold distance had been estimated, a series of recall trials were conducted at each driver’s combined threshold. We required eight recall trials in order to have one memory test instance of a secondary task and control trial with all vehicle combinations approaching from both directions (four secondary task trials: 2 car/car, 2 car/motorcycle trials and 4 control trials: 2 car/car, 2 car/motorcycle trials). Vehicle type, vehicle direction and task presence were counterbalanced.
Although drivers’ situational awareness is important for deciding whether or not to accept a gap in traffic, our goal was to test drivers’ memory only on trials where the driver had chosen to pull out in front of the approaching vehicles, as their memory for approaching vehicles in these particular instances is critical for performing a safe manoeuvre. Therefore, given that the gap acceptance threshold offered a distance with a 50% probability of the driver accepting the gap, it was necessary to present (on average) 16 trials, in order to have eight occasions when the driver chose to pull out ahead of approaching vehicles. Where the driver did not pull out until the approaching vehicles had passed, no memory test was given and trials continued until all eight memory tests had been completed.
On the recall trials, the trial was terminated at the moment when the driver passed the junction entry line, which is the point where the driver had entered the junction. The trial was manually terminated by the experimenter and resulted in the simulation screens going blank. Drivers were then asked to recall what vehicles they saw at the junction (i.e. car or motorcycle) and whether the vehicle was approaching from the right or left side. The experiment lasted approximately 1 hour irrespective of whether the participant was given the visuospatial or phonological task.
3.5. Data analysis
Except where specified, results were subject to a 2 × 2 mixed design ANOVA with the within group factor of Task Presence (secondary task vs. control), and the between group factor of Task Type (visuospatial task vs. phonological task).
In terms of eye movements, the current study included measures of general visual search at the junction which included mean fixation durations (ms) and horizontal spread of search (degrees). All fixations were calculated between a start line at the point where the driver could see traffic approaching the junction, and an endpoint where the driver had decided to pull out of the junction. See Supplementary File 5 for the calculations used for these two measures.
4. Results
4.1. Drivers’ gap acceptance thresholds
A main effect of Task Presence was not found [F (1, 54) = .001, MSe = 84.56, p = .978, n2p = .001, d = .002], indicating that drivers’ safety margins did not differ for control (Mean = 69.96m, SD = 17.26) and secondary task (Mean = 69.91m, SD = 17.79) trials. There was no main effect of Task Type [F (1, 54) = .590, MSe = 535.083, p = .446, n2p = .011, d = .190], indicating that drivers’ safety margins did not differ when they had a visuospatial (Mean = 68.26m, SD = 17.60) or phonological task (Mean = 71.61m, SD = 17.57). There was also no interaction found [F (1, 54) = .145, MSe = 84.567, p = .705, n2p = .003].
Bayes Factors were also conducted on this analysis using JASP Team (Citation2018). For the main effect of Task Presence, BF10 = 0.198 indicating moderate evidence for the null hypothesis, meaning that the data are 1/BF10 = 5.05 times more likely to have occurred under the null than under the alternative hypothesis. For the main effect of Task Type, BF10 = 0.51 indicating anecdotal evidence for the null hypothesis, meaning that the data are 1/BF10 = 1.98 times more likely to have occurred under the null than under the alternative hypothesis. Finally, for the interaction, BF10 = 0.030/0.102 = 0.29 indicating anecdotal evidence for the null hypothesis, meaning that the data are 1/BF10 = 3.45 times more likely to have occurred under the null than under the alternative hypothesis.
4.2. Drivers’ memory for vehicles
The descriptive memory data for all participants can be seen in , showing the absolute number of memory failures. It also shows the frequencies of both an incorrect answer, i.e. when the vehicle was recalled but its direction of travel was incorrectly recalled, and an unreported vehicle, i.e. when the vehicle was not recalled at all.
Table 1. The absolute number of memory failures, broken down into incorrect and unreported occasions, for the within subject factor of Task Presence (secondary vs. control) and the between subject factor of Task Type (visuospatial vs phonological).
As memory failures were relatively rare over the course of the whole experiment, drivers’ memory was quantified as whether a participant gave a correct recall response in every trial for the secondary task trials and for the control trials. This allowed drivers’ memory to be placed in two categories; all correct or not all correct. A McNemar test was then conducted to investigate whether drivers ever failed to recall a vehicle. The likelihood of forgetting vehicles did not significantly differ between secondary and control trials, p = .804 (2-sided), with 15 drivers failing to recall a vehicle on at least one secondary task trial and 13 drivers failing to recall at least one vehicle on control trial.
To test whether drivers ever failed to recall a vehicle as a function of Task Type, a Fisher’s Exact test was conducted. The Fisher Exact test showed that drivers’ forgetting rates for vehicles did not significantly differ when drivers were completing a visuospatial or a phonological secondary task, p = .171 (2-sided), with 14 drivers failing to recall a vehicle on at least one occasion for the visuospatial task (5 occasions on control trials, 9 occasions on visuospatial secondary task trials) and 8 drivers’ failing to recall a vehicle on at least one occasion on the phonological task (4 occasions on control trials, 4 occasions on phonological task trials).
4.3. Drivers’ eye movements
4.3.1. Eye movements on trials with variable vehicle distance
Drivers’ mean fixation durations and horizontal spread of search was calculated for the gap estimation trials. For mean fixation durations, there were 22 participants with full eye tracking data in the phonological study, and 25 participants in the visuospatial study. For horizontal spread of search, there were 20 participants in the phonological study and 24 participants in the visuospatial study.
For mean fixation durations, a main effect of Task Presence was not found [F (1, 45) = .388, MSe = .007, p = .536, n2p = .009, d = .044] and a main effect of Task Type was not found [F (1, 45) = .718, MSe = .112, p = .401, n2p = .016, d = .249]. There was also no interaction [F (1, 45) = .388, MSe = .007, p = .200, n2p = .016].
In regards to drivers’ horizontal spread of search, a main effect of Task Presence was not found [F (1, 42) = .582, MSe = 165,761.630, p = .450, n2p = .014, d = .101] and a main effect of Task Type was not found [F (1, 42) = .010, MSe = 762,558.291, p = .922, n2p = .001, d = .027]. There was also no interaction [F (1, 42) = .023, MSe = 165,761.630, p = .880, n2p = .001], see .
Table 2. The means and standard error of the mean for drivers’ mean fixation durations and horizontal spread of search for variable vehicle distance trials, and mean fixation durations and horizontal spread of search for drivers’ forgotten and remembered occasions as a function of secondary task type.
4.3.2. Eye movements on recall trials
Drivers’ eye movements were compared on the trials where a driver failed to recall a vehicle and a matched trial where they remembered the vehicle. The trial that was chosen as the ‘remembered trial’ was the trial which contained the same two approaching vehicles, and also matched on whether it was a control or secondary trial.
A 2 × 2 mixed ANOVA with factors of Memory (forgotten vs. remember) and Task Type (visuospatial vs. phonological) was conducted. For mean fixation durations, there was no main effect of Memory [F (1, 15) = .628, MSe = .011, p = .440, n2p = .040, d= .161], no main effect of Task Type [F (1, 15) = 3.080, MSe = .037, p = .100, n2p = .170, d= .772] and no interaction found [F (1, 15) = 1.628, MSe = .011, p = .221, n2p = .098].
For horizontal spread of search, there was also no main effect of Memory [F (1, 7) = .150, MSe = 218,012.100, p = .710, n2p = .021, d= .115], no main effect of Task Type [F (1, 7) = .053, MSe = 520,479.337, p = .824, n2p = .081, d = .134] and no interaction found [F (1, 7) = .614, MSe = 218,012.100, p = .459, n2p = .008], see .
4.4. Effect of individual differences on gap acceptance thresholds and recall
Firstly, participants who completed the visuospatial and phonological tasks were compared on their self-reported DBQ responses and it was found that there were no differences between the groups in reported Violations [t (54) = .219, p = .827, d = .058], Errors [t (54) = 1.147, p = .257, d = .307] and Lapses [t (54) = .384, p = .384, d = .235].
A multiple linear regression was conducted using the predictor variables of Driving Experience (annual mileage), Age, Gender and self-reported Errors, Lapses and Violations from the DBQ with the outcome variable of drivers’ gap acceptance threshold estimates. It was found that by adding the six key predictors of Driving Experience, Age, Gender, Errors, Lapses and Violations to a model, no significant regression equation was found [F (6, 55) = .419, p = .863, f2 = .051], with an R2 of .049.
A binomial logistical regression was also conducted with the same five predictor variables to determine the outcome variable of overall forgetting rates. Overall forgetting rates were whether the driver had forgotten any vehicle over the course of the experiment, irrelevant of Task Presence or Task Type. It was found that by adding the six key predictors to a model that contained only intercept, this significantly improved the fit between the model and the data, (χ2(6, N = 56) = 18.192, R2 = .376, p < .01, f2 = .603). The significant contributions to the model were made by Age (p = .01) and Errors (p = .01). It was found that the younger the driver, the more likely they are to fail to recall a vehicle, and the more self-reported errors, the more likely they are to fail to recall a vehicle. An analysis of the main variables was repeated with the removal of the five participants that had less than 1-year licensure, see Supplementary File 6. This analysis produced the same pattern of results as the original analysis.
4.5. Exploratory analysis
4.5.1. Secondary task performance
Participants’ performance on the secondary task was also analysed, investigating whether there was a difference in Task Type. Since the presentation of the memory task meant that participants did not give a response to the secondary task, this analysis could only be performed on the initial trials with variable vehicle approach distances (6 trials). An average score out of 5 was calculated for each participant.
An independent samples t-test found a significant difference in drivers’ secondary task performance (t (54) = 5.167, p < .001, d = 1.38), with performance being significantly better when there was a phonological task (Mean = 4.86, SD = .218) compared to the visuospatial task (Mean = 4.29, SD = .550). Moreover, given that the 95% confidence intervals associated with this t-test (.353 to .801) do not include the observed difference in the pilot study (.25), we interpret this as showing a clearly greater impairment in the visuospatial condition.
5. Discussion
The first immediate finding was that gap acceptance thresholds did not differ when drivers were required to drive with a secondary memory load compared to without such a load, and that thresholds did not differ as a function of secondary task type, despite both of the conceptualised subsystems of working memory being used (Baddeley Citation2007). The current studies had abundant power (>.95) to have detected any such effects. There was also no evidence of driving impairment when comparing the current gap acceptance thresholds, (with averages of gap acceptance thresholds when performing a secondary task and control ranging from 7.6 to 8 s), to those found in previous literature. A naturalistic study in the US found an average accepted gap of 7.6 s in front of approaching cars (Tupper Citation2011), and a comparable driving simulation task found gap acceptance thresholds at around 7–9 s (Beanland et al. Citation2013). Given that these studies did not involve a secondary task, these findings suggest that drivers were unlikely to be adjusting this behaviour to compensate for the increased demand when performing the secondary task.
However, there was evidence of risk compensation in terms of drivers’ performance on the secondary task, as it was found that drivers’ performance in the visuospatial task was significantly worse than drivers’ performance on the phonological task. This finding suggests that drivers did experience interference from a visuospatial memory load, but given that their driving performance did not change, they chose to prioritise the driving task over performance in the visuospatial task. This finding could be interpreted in terms of the Task Capability Interference Model (Fuller Citation2005), with demands of the visuospatial task exceeding the drivers’ visuospatial capability, and therefore resulting in the driver failing to perform the secondary task.
Similarly, drivers’ memory for vehicles also indicated that the presence of a secondary task did not affect this measure and did not differ as a function of task type. This is surprising given that the visuospatial subsystem has been shown to be particularly important while driving (Owsley and McGwin Citation2010) however, the lack of effect from visuospatial load is nonetheless consistent with some previous research (Garden, Cornoldi, and Logie Citation2002) suggesting that visuospatial load may not reduce drivers’ memory as the phonological loop could be recruited in such circumstances. Further research in aviation also supports this conclusion, showing that when task-demands are high, pilots recruit the phonological loop to assist the visuospatial subsystem to maintain situational awareness (Aretz Citation1988).
However, the fact the phonological load did not affect drivers’ memory for vehicles, does not conform to the pattern of previous findings (Baddeley, Chincotta, and Adlam Citation2001). This finding extends previous research due to the fact that recall for vehicles was generally accurate with or without a secondary memory load, implying that situational awareness in this safety critical task was sufficiently important that drivers found flexible ways to process and retain all this information even with a secondary load.
The lack of effects in drivers’ memory for vehicles due to a secondary task is consistent with the lack of effects on drivers’ eye movements at the junction, with visual attention towards relevant elements being key to the first component of situational awareness – the perception of elements (Endsley Citation1995). Contrary to the original hypotheses, drivers’ fixation durations and horizontal spread of search at the junction did not differ when drivers were presented with a secondary task as opposed to control trials, and did not differ as a function of task type. These findings contradict previous research which has found that situational awareness in terms of the perception of elements is affected by working memory load due to reduced scanning patterns (Harbluk et al. Citation2007). This lack of differences in drivers’ visual attention supports the previous interpretation – that compensation in visuospatial secondary task performance to maintain unaffected driving behaviour was also sufficient enough to maintain constant eye movement strategies.
In regards to drivers’ self-reported driving behaviour, it was found that DBQ reported errors and age were significant predictors of vehicle forgetting rates. This finding supports the original hypothesis and may have potential implications for explaining junction accidents. The most common ROW crash at junctions involves a motorist pulling out into the into the path of an approaching road user (Clarke et al. Citation2007). The current study highlights that memory for approaching road users is generally good, but not always perfect, even when the driver is willing to pull out in front of the approaching vehicles. Failures to recall approaching vehicles would not have to happen very often in the real world to explain ‘SMIDSY’ (Sorry Mate I Didn’t See You) crashes, even when apparently appropriate patterns of head and eye movements had been made at the junction. This may help to explain the genuine surprise frequently experienced by motorists after colliding with an approaching vehicle (Brown Citation2002). The fact that memory errors in the laboratory are associated with self-reported driving errors suggests that, even though rare, such errors may have important road-safety implications.
5.1. Implications
The ability of our participants to safely prioritise the driving task over a secondary one is encouraging for road safety, with important practical implications. There is an ongoing debate regarding the use of in-car devices while driving, with research clearly showing that mobile phone use, including hands-free devices, increases the risk of traffic crashes (Briem and Hedman Citation1995; Patten et al. Citation2004). Nonetheless, the current results suggest that drivers can sometimes adjust their attentional resources to appropriately prioritise the primary task of driving, with only the secondary task being compromised if the demands of the situation are high. Similar findings have been reported, with drivers’ quality of verbal communication (i.e. phone call conversations) being seen to decrease when affected by the attentional demands of driving (Radeborg, Briem, and Hedman Citation1999). These effects may be particularly relevant for low demand driving situations where increased cognitive load is potentially desirable, i.e. highway driving (Trumbo et al. Citation2017), however, our research suggests that even in relatively complex junction gap-acceptance scenarios people may sometimes be able to appropriately prioritise between primary and secondary tasks. Note, however, that a key feature of our research is that the secondary tasks did not require acquisition or output of secondary information at times when the primary driving task was critical – this may represent an important boundary condition for the safe use of in-car systems.
Similarly, there has been an ongoing debate over in-car technologies such as navigation displays, with the central argument suggesting they are associated with an increase in accident risk (Stutts and Hunter Citation2003). Many previous studies have suggested that verbal interfaces are superior to visual displays in presenting information, with findings showing larger determents in behaviour when presented with visual displays compared to phonological displays (Liu Citation2001; Jamson and Merat Citation2005). However, it has been found that drivers prefer navigation systems that are visual, with convenient graphical displays (Streeter, Vitello, and Wonsiewicz Citation1985; Baldwin and Reagan Citation2009). The current research suggests that drivers may be able to adjust their attentional resources to prioritise the driving task over other secondary visuospatial tasks, even when driving demands are relatively high at a junction.
The short and predicable nature of the current task could lead to recommendations for designers of in-car assistive systems to achieve the minimum distraction, but also align with drivers’ navigation preferences. The important message is not that drivers can never perform a secondary task when driving, but that secondary tasks need to remain secondary and be easily disrupted when the demands of driving increase or during unexpected emergencies.
5.2. Limitations
The secondary tasks in the current experiments were chosen theoretically to allow precise matching of task demands, and are not representative of all potential in-car devices, some of which have been legally prohibited. We specifically chose tasks that in no way encouraged participants to look away from the roadway at any point of the actual junction approach or crossing. This lack of realism may have contributed to the absence of driving impairment, however, these secondary tasks still require the sharing of time and working memory resources with actual driving (Chaparro, Wood, and Carberry Citation2005; Jamson and Merat Citation2005) and were theoretically motivated. The fact that these specific secondary tasks, presented with the precise timings we used did not impair driving skills at intersections, should in no way distract from the documented impairment from a wide variety of other in-vehicle tasks, such as in-car navigational displays encouraging drivers to allocate their visual attention off the road. In addition, it could be argued that the current driving task lacks realism due to the short and repetitive nature of the junction task, as well as there always being two vehicles present at the junction. This was a result of the time constrained nature of the task, and the need to have multiple trials and tests. Although future research could investigate the effect of more visual complexity at the junction, it is estimated that in the UK, the average flow of traffic on minor roads per minute is two vehicles (Department for Transport Citation2010).
It should also be acknowledged that the participants in the pilot study were different to those in the driving study, therefore it could be possible that the matching of memory span in the pilot study was not exact for the participants in the driving study. That said, previous literature has found that phonological working memory span is around 5 digits when also attempting to remember visually presented information (Baddeley Citation2007). Other studies investigating the influence of working memory load on driving behaviour, using the ascending span procedure (Ross et al. Citation2014) and requiring drivers to rehearse items while driving (Chaparro, Tokuda, and Morris Citation2010) used a memory load of around 5–6 items. It was found that these loads negatively affected driving performance and interfered with drivers’ visual attention. These finding suggest that this is a plausible memory span for a visual driving task.
In addition, the secondary tasks in the pilot study were conducted slightly differently to the driving study, with participants in the pilot study experiencing both the visuospatial and phonological task alternately, compared to participants only experiencing one of the two modalities in the driving study. However, this difference did not qualitatively affect the results, and we can be sure that both tasks were at least moderately demanding based on data from the pilot study. The results from the pilot study therefore add credibility to our general conclusions, as well as providing evidence to counter the argument that the lack in differences in behaviour might have been due to the secondary tasks not being difficult enough to load the working memory subsystems.
While exploratory analyses found that drivers showed a greater impairment in performance on the visuospatial task compared to the phonological task while driving than when performing these tasks with a central load task unrelated to driving, further research is necessary to determine whether drivers would have also performed worse on the visuospatial task compared to the phonological task when tested statically. Such investigation would strengthen these conclusions.
6. Conclusions
Our research supports the idea that visuospatial processing is likely to be the prominent working memory system used when performing junction manoeuvres, with drivers displaying compensatory behaviour by prioritising the driving task over the visuospatial secondary task. The phonological loop does not seem to be recruited as much for drivers’ memory for vehicles at junctions, perhaps because much of the information falls within the forward view of the driver. Drivers’ self-reported driving errors were found to predict drivers’ memory for vehicles at junctions, suggesting that memory failures may play an important role in some junction crashes. However, the broad lack of effects of a secondary task on a wide range of measures was contrary to our predictions. The knowledge gained improves our understanding about the flexibility of working memory use in junction settings, and has potential implications for road safety research in terms of mobile phone use and in-car navigation displays.
TERG-2020-0041-File002.doc
Download MS Word (37.5 KB)Acknowledgements
The Nottingham Integrated Transport and Environment Simulation (NITES) facility provided the simulator used to conduct this research.
Disclosure statement
No potential conflict of interest was reported by the author(s).
Additional information
Funding
References
- Amin, H. J., and A. K. Maurya. 2015. “A Review of Critical gap estimation approaches at Uncontrolled Intersection in Case of Heterogeneous Traffic Conditions.” Journal of Transport Literature 9 (3): 5–9. doi:10.1590/2238-1031.jtl.v9n3a1.
- Aretz, A. J. 1988. “A Model of Electronic Map Interpretation.” Proceedings of the Human Factors Society Annual Meeting 32 (2): 130–134.
- Baddeley, A. 2007. Working Memory, Thought, and Action. Oxford: Oxford University Press.
- Baddeley, A. 2012. “Working Memory: Theories, Models, and Controversies.” Annual Review of Psychology 63: 1–29. doi:10.1146/annurev-psych-120710-100422.
- Baddeley, A., D. Chincotta, and A. Adlam. 2001. “Working Memory and the Control of Action: Evidence from Task Switching.” Journal of Experimental Psychology: General 130 (4): 641–657. doi:10.1037/0096-3445.130.4.641.
- Baldwin, C. L., and I. Reagan. 2009. “Individual Differences in Route-Learning Strategy and Associated Working Memory Resources.” Human Factors 51 (3): 368–377. doi:10.1177/0018720809338187.
- Beanland, V., M. G. Lenné, N. Candappa, and B. Corben. 2013. “Gap Acceptance at Stop-Controlled T-Intersections in a Simulated Rural Environment.” Transportation Research Part F: Traffic Psychology and Behaviour 20: 80–89. doi:10.1016/j.trf.2013.05.006.
- Briem, V., and L. R. Hedman. 1995. “Behavioural Effects of Mobile Telephone Use during Simulated Driving.” Ergonomics 38 (12): 2536–2562. doi:10.1080/00140139508925285.
- Brookhuis, K. A., G. de Vries, and D. De Waard. 1991. “The Effects of Mobile Telephoning on Driving Performance.” Accident; Analysis and Prevention 23 (4): 309–316. doi:10.1016/0001-4575(91)90008-s.
- Brown, I. D. 2002. “A Review of the ‘Look but Failed to See’ Accident Causation Factor.” In Behavioural Research in Road Safety XI, 116–124. London, UK: Department for Transport, Local Government and the Regions.
- Brown, I. D., A. H. Tickner, and D. C. Simmonds. 1969. “Interference between Concurrent Tasks of Driving and Telephoning.” The Journal of Applied Psychology 53 (5): 419–424. doi:10.1037/h0028103.
- Chaparro, A., S. Tokuda, and N. Morris. 2010. “Effects of Visual-Spatial and Verbal Working Memory Load on Visual Attention and Driving Performance.” Journal of Vision 7 (9): 683–683. doi:10.1167/7.9.683.
- Chaparro, A., J. M. Wood, and T. Carberry. 2005. “Effects of Age and Auditory and Visual Dual Tasks on Closed-Road Driving Performance.” Optometry and Vision Science: Official Publication of the American Academy of Optometry 82 (8): 747–754. doi:10.1097/01.opx.0000174724.74957.45.
- Clarke, D. D., P. Ward, C. Bartle, and W. Truman. 2007. “The Role of Motorcyclist and Other Driver Behaviour in Two Types of Serious Accident in the UK.” Accident; Analysis and Prevention 39 (5): 974–981. doi:10.1016/j.aap.2007.01.002.
- Cooper, P. J., and Y. Zheng. 2002. “Turning Gap Acceptance Decision-Making: The Impact of Driver Distraction.” Journal of Safety Research 33 (3): 321–335. doi:10.1016/s0022-4375(02)00029-4.
- Corsi, P. 1972. “Memory and the Medial Temporal Region of the Brain.” Unpublished doctoral diss., McGill University, Montreal, QB.
- Crowe, S. F. 2000. “Does the Letter Number Sequencing Task Measure Anything More than Digit Span?” Assessment 7 (2): 113–117. doi:10.1177/107319110000700202.
- De Winter, J. C. F., and D. Dodou. 2010. “The Driver Behaviour Questionnaire as a Predictor of Accidents: A Meta-Analysis.” Journal of Safety Research 41 (6): 463–470. doi:10.1016/j.jsr.2010.10.007.
- De Winter, J. C. F., A. C. E. Spek, S. De Groot, and P. A. Wieringa. 2010. “Left Turn Gap Acceptance in a Simulator: Driving Skill or Driving Style?” Proceedings Driving Simulation Conference 2009, Monaco.
- Department for Transport. 2010. “GB road traffic counts: AADF data-minor roads.” Retrieved from: http://data.dft.gov.uk/gb-traffic-matrix/AADF-data-minor-roads.zip
- Department for Transport. 2017. “Reported road casualties in Great Britain: 2016 annual report.” Retrieved from: https://www.gov.uk/government/uploads/system/uploads/attachment_data/file/648081/rrcgb2016-01.pdf
- Dewing, W. L., S. M. Johnson, and S. P. Stackhouse. 1995. The Interaction of Non-driving Tasks with Driving. Minnesota: Department of Transportation.
- Elander, J., R. West, and D. French. 1993. “Behavioral Correlates of Individual Differences in Road-Traffic Crash Risk: An Examination of Methods and Findings.” Psychological Bulletin 113 (2): 279–294. doi:10.1037/0033-2909.113.2.279.
- Endsley, M. R. 1995. “Toward a Theory of Situation Awareness in Dynamic Systems.” Human Factors: The Journal of the Human Factors and Ergonomics Society 37 (1): 32–64.
- Faul, F., E. Erdfelder, A. G. Lang, and A. Buchner. 2007. “G*Power 3: a flexible statistical power analysis program for the social, behavioral, and biomedical sciences.” Behavior Research Methods 39 (2): 175–191. doi:10.3758/bf03193146.
- Fuller, R. 2005. “Towards a General Theory of Driver Behaviour.” Accident; Analysis and Prevention 37 (3): 461–472. doi:10.1016/j.aap.2004.11.003.
- Garden, S., C. Cornoldi, and R. H. Logie. 2002. “Visuo‐Spatial Working Memory in Navigation.” Applied Cognitive Psychology 16 (1): 35–50. doi:10.1002/acp.746.
- Guerrier, J. H., P. Manivannan, and S. N. Nair. 1999. “The Role of Working Memory, Field Dependence, Visual Search, and Reaction Time in the Left Turn Performance of Older Female Drivers.” Applied Ergonomics 30 (2): 109–119.
- Harbluk, J. L., Y. I. Noy, P. L. Trbovich, and M. Eizenman. 2007. “An On-road Assessment of Cognitive Distraction: Impacts on Drivers' Visual Behavior and Braking Performance.” Accident; Analysis and Prevention 39 (2): 372–379. doi:10.1016/j.aap.2006.08.013.
- Hardiess, G., S. Gillner, and H. A. Mallot. 2008. “Head and Eye Movements and the Role of Memory Limitations in a Visual Search Paradigm.” Journal of Vision 8 (1): 7–7. doi:10.1167/8.1.7.
- Hirano, T., J. Lee, and M. Itoh. 2018. “Effects of Auditory Stimuli and Verbal Communications on Drivers' Situation Awareness in Partially Automated Driving.” 2018 57th Annual Conference of the Society of Instrument and Control Engineers of Japan (SICE), 690–696. IEEE. doi:10.23919/SICE.2018.8492552.
- Hollingworth, A., A. M. Richard, and S. J. Luck. 2008. “Understanding the Function of Visual Short-Term Memory: Transsaccadic Memory, Object Correspondence, and Gaze Correction.” Journal of Experimental Psychology: General 137 (1): 163–181. doi:10.1037/0096-3445.137.1.163.
- Jamson, A. H., and N. Merat. 2005. “Surrogate in-Vehicle Information Systems and Driver Behaviour: Effects of Visual and Cognitive Load in Simulated Rural Driving.” Transportation Research Part F: Traffic Psychology and Behaviour 8 (2): 79–96.
- JASP Team. 2018. JASP (Version 0.9) [Computer software]. 2017.
- Johannsdottir, K. R., and C. M. Herdman. 2010. “The Role of Working Memory in Supporting Drivers' Situation Awareness for Surrounding Traffic.” Human Factors 52 (6): 663–673. doi:10.1177/0018720810385427.
- Kennedy, R. S., N. E. Lane, K. S. Berbaum, and M. G. Lilienthal. 1993. “Simulator Sickness Questionnaire: An Enhanced Method for Quantifying Simulator Sickness.” The International Journal of Aviation Psychology 3 (3): 203–220. doi:10.1207/s15327108ijap0303_3.
- Kingdom, F. A. A., and N. Prins. 2010. Psychophysics: A Practical Introduction. San Diego, CA: Elsevier Academic Press.
- Lajunen, T., D. Parker, and H. Summala. 2004. “The Manchester Driver Behavior Questionnaire: A Cross-Cultural Study.” Accident Analysis & Prevention 36 (2): 231–238. doi:10.1016/S0001-4575(02)00152-5.
- Liao, Y., S. E. Li, W. Wang, Y. Wang, G. Li, and B. Cheng. 2016. “Detection of Driver Cognitive Distraction: A Comparison Study of Stop-Controlled Intersection and Speed-Limited Highway.” IEEE Transactions on Intelligent Transportation Systems 17 (6): 1628–1637. doi:10.1109/TITS.2015.2506602.
- Liu, Y. C. 2001. “Comparative Study of the Effects of Auditory, Visual and Multimodality Displays on Drivers' Performance in Advanced Traveller Information Systems.” Ergonomics 44 (4): 425–442. doi:10.1080/00140130010011369.
- Merat, N., A. H. Jamson, F. C. Lai, and O. Carsten. 2012. “Highly Automated Driving, Secondary Task Performance, and Driver State.” Human Factors 54 (5): 762–771. doi:10.1177/0018720812442087.
- Mitsopoulos-Rubens, E., and M. G. Lenné. 2012. “Issues in Motorcycle Sensory and Cognitive Conspicuity: The Impact of Motorcycle Low-Beam Headlights and Riding Experience on Drivers' Decisions to Turn Across the Path of a Motorcycle .” Accident; Analysis and Prevention 49: 86–95. doi:10.1016/j.aap.2012.05.028.
- Oron-Gilad, T., A. Ronen, and D. Shinar. 2008. “Alertness Maintaining Tasks (AMTs) While Driving.” Accident; Analysis and Prevention 40 (3): 851–860. doi:10.1016/j.aap.2007.09.026.
- Owsley, Cynthia, and Gerald McGwin. 2010. “Vision and Driving.” Vision Research 50 (23): 2348–2361. doi:10.1016/j.visres.2010.05.021.
- Parker, D., T. Lajunen, and S. Stradling. 1998. “Attitudinal Predictors of Interpersonally Aggressive Violations on the Road.” Transportation Research Part F: Traffic Psychology and Behaviour 1 (1): 11–24. doi:10.1016/S1369-8478(98)00002-3.
- Patten, C. J., A. Kircher, J. Östlund, and L. Nilsson. 2004. “Using Mobile Telephones: Cognitive Workload and Attention Resource Allocation.” Accident; Analysis and Prevention 36 (3): 341–350. doi:10.1016/S0001-4575(03)00014-9.
- Peirce, J., J. R. Gray, S. Simpson, M. MacAskill, R. Höchenberger, H. Sogo, … J. K. Lindeløv. 2019. “PsychoPy2: Experiments in Behavior Made Easy.” Behavior Research Methods 51: 1–9.
- Radeborg, K., V. Briem, and L. R. Hedman. 1999. “The Effect of Concurrent Task Difficulty on Working Memory during Simulated Driving.” Ergonomics 42 (5): 767–777. doi:10.1080/001401399185441.
- Reason, J., A. Manstead, S. Stradling, J. Baxter, and K. Campbell. 1990. “Errors and Violations on the Roads: A Real Distinction?” Ergonomics 33 (10–11): 1315–1332. doi:10.1080/00140139008925335.
- Robbins, C. J., H. A. Allen, and P. Chapman. 2018a. “Comparing Car Drivers' and Motorcyclists' Opinions about Junction Crashes.” Accident; Analysis and Prevention 117: 304–317. doi:10.1016/j.aap.2018.05.001.
- Robbins, C. J., H. A. Allen, and P. Chapman. 2018b. “Comparing Drivers’ Gap Acceptance for Cars and Motorcycles at Junctions Using an Adaptive Staircase Methodology.” Transportation Research Part F: Traffic Psychology and Behaviour 58: 944–954.
- Robbins, C. J., H. A. Allen, and P. Chapman. 2018c. “The Effect of a Memory Load Task on Drivers’ Memory of Motorcycles at Junctions.” Retrieved from osf.io/63pg5
- Robbins, C. J., H. A. Allen, and P. Chapman. 2019. “Comparing Drivers' Visual Attention at Junctions in Real and Simulated Environments.” Applied Ergonomics 80: 89–101. doi:10.1016/j.apergo.2019.05.005.
- Robbins, C. J., and P. Chapman. 2018. “ Drivers' Visual Search Behavior Toward Vulnerable Road Users at Junctions as a Function of Cycling Experience.” Human Factors 60 (7): 889–901. doi:10.1177/0018720818778960.
- Ross, V., E. M. Jongen, W. Wang, T. Brijs, K. Brijs, R. A. Ruiter, and G. Wets. 2014. “Investigating the Influence of Working Memory Capacity When Driving Behavior Is Combined with Cognitive Load: An LCT Study of Young Novice Drivers.” Accident; Analysis and Prevention 62: 377–387. doi:10.1016/j.aap.2013.06.032.
- Salway, A. F., and R. H. Logie. 1995. “Visuospatial Working Memory, Movement Control and Executive Demands.” British Journal of Psychology 86 (2): 253–269. doi:10.1111/j.2044-8295.1995.tb02560.x.
- Scott, H., L. Hall, D. Litchfield, and D. Westwood. 2013. “Visual Information Search in Simulated Junction Negotiation: Gaze Transitions of Young Novice, Young Experienced and Older Experienced Drivers.” Journal of Safety Research 45: 111–116. doi:10.1016/j.jsr.2013.01.004.
- Sodhi, M., B. Reimer, and I. Llamazares. 2002. “Glance Analysis of Driver Eye Movements to Evaluate Distraction.” Behavior Research Methods, Instruments, & Computers: A Journal of the Psychonomic Society, Inc 34 (4): 529–538. doi:10.3758/bf03195482.
- Streeter, L. A., D. Vitello, and S. A. Wonsiewicz. 1985. “How to Tell People Where to Go: Comparing Navigational Aids.” International Journal of Man-Machine Studies 22 (5): 549–562. doi:10.1016/S0020-7373(85)80017-1.
- Stutts, J. C., and W. W. Hunter. 2003. “Driver Inattention, Driver Distraction and Traffic Crashes.” Institute of Transportation Engineers. ITE Journal 73 (7): 34.
- Toepper, Max, Hans J. Markowitsch, Helge Gebhardt, Thomas Beblo, Christine Thomas, Bernd Gallhofer, Martin Driessen, and Gebhard Sammer. 2010. “Hippocampal Involvement in Working Memory Encoding of Changing Locations: An fMRI Study.” Brain Research 1354: 91–99. doi:10.1016/j.brainres.2010.07.065.
- Trumbo, M. C., A. P. Jones, C. S. Robinson, K. Cole, and J. D. Morrow. 2017. “Name That Tune: Mitigation of Driver Fatigue via a Song Naming Game.” Accident Analysis & Prevention 108: 275–284.
- Tsimhoni, O., and P. Green. 2001. “Visual Demand of Driving and the Execution of Display-Intensive in-Vehicle Tasks.” Proceedings of the Human Factors and Ergonomics Society Annual Meeting 45 (23): 1586–1590.
- Tupper, S. M. 2011. “Safety and Operational Assessment of Gap Acceptance through Large-Scale Field Evaluation.” Ph.D. Thesis, University of Massachusetts, USA.
- Vandierendonck, A., G. De Vooght, and K. Van der Goten. 1998a. “Interfering with the Central Executive by Means of a Random Interval Repetition Task.” The Quarterly Journal of Experimental Psychology. A, Human Experimental Psychology 51 (1): 197–218. doi:10.1080/713755748.
- Vandierendonck, A., G. De Vooght, and K. Van der Goten. 1998b. “Does Random Time Interval Generation Interfere with Working Memory Executive Functions?” European Journal of Cognitive Psychology 10 (4): 413–442.
- Wickens, C. M., M. E. Toplak, and D. L. Wiesenthal. 2008. “Cognitive Failures as Predictors of Driving Errors, Lapses, and Violations.” Accident; Analysis and Prevention 40 (3): 1223–1233. doi:10.1016/j.aap.2008.01.006.
- Wu, L., Y. Hu, T. Zhu, and H. Liu. 2017. “Investigating the Effects of Visuospatial Memory Secondary Tasks on LCT Driving Performance.” International Journal of Pattern Recognition and Artificial Intelligence 31 (10): 1759020. doi:10.1142/S0218001417590200.
- Zhang, T., S. Savage, and A. Bowers. 2018. “Effects of Simulated Vision Impairment and Auditory Distraction on the Detection of Hazards While Driving.” Journal of Vision 18 (10): 485–485. doi:10.1167/18.10.485.