
 ?Mathematical formulae have been encoded as MathML and are displayed in this HTML version using MathJax in order to improve their display. Uncheck the box to turn MathJax off. This feature requires Javascript. Click on a formula to zoom.
Abstract
We examined what pedestrians look at when walking through a parking garage. Thirty-six participants walked a short route in a parking garage while their eye movements and head rotations were recorded with a Tobii Pro Glasses 2 eye-tracker. The participants’ fixations were then classified into 14 areas of interest. The results showed that pedestrians often looked at the back (20.0%), side (7.5%), and front (4.2%) of parked cars, and at approaching cars (8.8%). Much attention was also paid to the ground (20.1%). The wheels of cars (6.8%) and the driver in approaching cars (3.2%) received attention as well. In conclusion, this study showed that eye movements are largely functional in the sense that they appear to assist in safe navigation through the parking garage. Pedestrians look at a variety of sides and features of the car, suggesting that displays on future automated cars should be omnidirectionally visible.
Practitioner summary: This study measured where pedestrians look when walking through a parking garage. It was found that the back, side, and wheels of cars attract considerable attention. This knowledge may be important for the development of automated cars that feature so-called external human-machine interfaces (eHMIs).
Keywords:
Introduction
The media often speak of fully automated cars that can take occupants from place A to place B with the mere push of a button. In practice, however, the development of automated cars may be better described as an evolutionary process, with more and more tasks being taken over by the automation (Fraedrich, Beiker, and Lenz Citation2015). The latest automated driving systems available to the public can drive largely automatically, and have advanced automation features such as traffic light detection, automated emergency braking, and automatic lane changing. However, they still require an alert human driver behind the steering wheel to intervene occasionally.
When the level of automated driving is further increased, the driver will no longer have to keep his or her attention on the road permanently. This creates new human factors challenges, including the much-studied topic of ‘take-overs’ (Zhang et al. Citation2019). Less researched are the consequences for road users outside the automated car, especially pedestrians and cyclists. Automated cars may react differently than human-driven cars. For example, automated cars are likely to have a conservative driving style, which may be confusing to pedestrians, and which pedestrians could misuse by taking priority with impunity (Millard-Ball Citation2018). Furthermore, pedestrians may have difficulty understanding whether an approaching vehicle is driving automatically (with a driver who is legitimately not paying attention to the road) or manually (with a dangerously distracted driver).
Car manufacturers have proposed the use of so-called external human-machine interfaces (eHMIs) to inform pedestrians about the intentions of the automated car (for a survey, see Bazilinskyy, Dodou, and De Winter Citation2019). Various types of eHMIs have been presented, including text messages, walking symbols, and a light bar around the car, showing either the automation status or its intention to yield or to continue (e.g., Faas, Mathis, and Baumann Citation2020; interACT Citation2017). The effectiveness of eHMIs has already been investigated in a series of studies, by means of virtual reality glasses (e.g., Deb, Strawderman, and Carruth Citation2018; De Clercq et al. Citation2019) and other types of virtual simulations (e.g., Kaleefathullah et al. Citation2021) as well as WizardofOz methods (Faas and Baumann Citation2019; Hensch et al. Citation2020) and online experiments (Bazilinskyy, Dodou, and De Winter Citation2019; Bazilinskyy, Dodou, and De Winter Citation2020; Dey et al. Citation2020). The research so far shows that eHMIs are effective. That is, participants tend to follow the eHMI’s instructions, provided the message is unambiguous (De Clercq et al. Citation2019; Fridman et al. Citation2019). A recent experiment performed in a virtual parking garage concurs that eHMIs that communicate the car’s upcoming deceleration contribute to a decrease in crossing time of pedestrians (Singer et al. Citation2020).
However, still little is known about the effectiveness of eHMIs in real traffic. Two Wizard-of-Oz on-road studies by Cefkin et al. (Citation2019) reported only limited success of their 360-degree led-strip eHMI called the Intention Indicator. In the first study in a test environment, it was found that ‘there was no clear evidence that they were noticed or understood to be signals about the vehicle actions’ (p. 56). The second study was conducted in a busy public environment, and participants were informed about the Intention Indicator before the experiment. Although post-experiment interviews showed that participants generally liked the idea of the Intention Indicator, only 1 of 21 participants reported that it influenced her decision making. The problem again was that the eHMI was not well noticeable, and there was only minimal time to learn the meaning of it. Furthermore, it is conceivable that pedestrians, especially on busy roads and in unstructured traffic situations, perceive approaching cars using peripheral vision, that is, without actually focussing on the car or the eHMI.
Recently, Lappi, Rinkkala, and Pekkanen (Citation2017) investigated in detail what a car driver looks at while driving. The fixations were annotated and related to seven ‘qualitative laws of gaze behavior in the wild’ (p. 2). In short, it turned out that the driver’s fixations were almost always on task-relevant objects and locations, while there were only few fixations on irrelevant objects. That is, there appeared to be no visual search, but fixations were targeted and what is termed ‘just-in-time’ (see also Ballard, Hayhoe, and Pelz Citation1995; Land Citation2006). In line with Lappi et al., one may expect that pedestrian viewing behaviour is tightly connected to their task of safely walking around, that is, that pedestrians mainly look at relevant cues in the environment. What these relevant cues are, however, has not been extensively explored yet. Previous research indicates that pedestrians mostly look at the ground, street edges, and other persons and vehicles (Fotios et al. Citation2015; Simpson et al. Citation2019), but these studies do not report results regarding interactions with moving cars. In an experiment using a manually-driven vehicle that approached while slowing down, Dey et al. (Citation2019) found that pedestrians were inclined to look at the windshield when the car was close by, perhaps to read the driver’s face or seek eye contact. Whether these findings can be generalised to more complex traffic conditions remains to be investigated.
We aimed to explore the interactions between pedestrians and their environments in a dynamic and unstructured traffic environment. The underlying motivation of this paper is that it is essential to investigate what pedestrians look at. In particular, if pedestrians hardly look at cars or their drivers, this could mean that pedestrians can navigate safely without eHMIs and that eHMIs may be effective to a limited extent only.
In this study, we had pedestrians walk around a parking garage while wearing an eye tracker that recorded their eye movements. We chose a parking garage for three reasons. The first reason was practical: A parking garage is shielded from direct sunlight, which is beneficial for the quality of the measurements from the infrared-illuminator-based eye-tracker. The second reason was that many nonformalised interactions between pedestrians and vehicles could be expected in a parking garage, such as interactions with cars moving in or out a parking space (as also pointed out by Singer et al. Citation2020). A third reason is the fact that parking garages are a candidate environment for the introduction of automated vehicles (e.g., Banzhaf et al. Citation2017).
Methods
The experiment included 43 participants (21 females, 22 males) with a mean age of 46.9 years (SD = 16.9). All participants provided written informed consent. The study was approved by the Human Research Ethics Committee of the Delft University of Technology. During the experiment, participants wore the Tobii Pro Glasses 2 eye tracker. The acquired eye movement data were analysed with Tobii Pro Lab software (version 1.152) and MATLAB R2020a.
The experiment was conducted during the afternoon (between 13:00 and 17:30) between 14 November and 5 December 2018, in the covered parking garage of a supermarket (W.H. van Leeuwenlaan 1, 2613 ZE Delft, The Netherlands). For four participants, the experiment was conducted after sunset.
The participants were asked if they wanted to participate when they were leaving or entering the supermarket. First, the participant signed an informed consent form and completed a short questionnaire that included questions about age and gender, after which the Tobii Pro Glasses 2 was calibrated. Next, the experiment started, and the participant walked the designated path () as they normally would. An experimenter walked behind the participant with a laptop to guide the participant, monitor whether data were recorded, and observe the intended use of the eye-tracker. Three experimenters fulfilled this role over the course of the experiment. The laptop showed a real-time wireless feed of the participant’s view. The interaction between the participant and experimenter was minimal, although some of the participants tended to be talkative. Analysis of the eye-tracking footage showed that participants looked at experimenters only for about 1% of the time, which was mostly near the end of the trial while walking up to the rest of the experimenters who were standing at the endpoint.
Figure 1. The layout of the floor of the parking garage and the the path walked by the participants. There were 57 parking places, as indicated by the numbers.
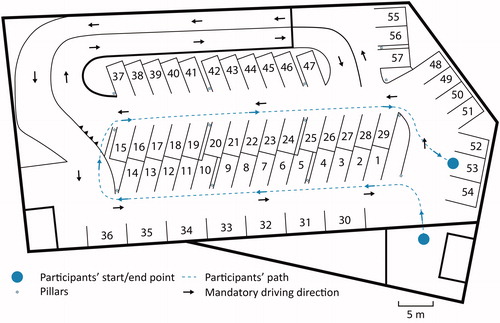
The first ten participants were asked to walk one lap in the parking garage, and the rest of the participants were asked to walk two laps. This change was made to increase the total amount of data collected. For the same reason, interactions were added from the 11th participant onwards. More specifically, an experimenter drove an Alfa Romeo 155 around the garage or started from a parked position after which he drove around. While parked, the experimenter had the tail lights of the car on and the engine running, waited for the participant to approach, and then drove out of the parking space a few metres in front of the participant. The driver did not make eye contact with the participant. The experimenter’s unparking car sometimes caused the participant to pause walking because their path was blocked. Because the eye movements during these experimenter events (car driving around and unparking) turned out to not be distinct compared to other events (e.g., many other approaching cars and unparking cars), it was decided to not analyse these events separately.
Areas of interest
Tobii’s I-VT (Attention) filter was used. This filter has been designed for dynamic conditions and therefore employs a relatively high velocity threshold of 100 deg/s (Tobii Citation2018). Each fixation was manually annotated in areas of interest (AOIs). The AOIs were defined using an inductive category formation method. More specifically, within the research team, the looking behaviour of participants in the recorded videos was observed, and distinct viewing patterns were noted down and discussed. For example, it was observed that participants often looked at the backs of cars, and hence ‘back of parked car’ was defined as an AOI category. The other AOI categories were derived in a similar manner, where it was kept in mind that AOI categories should be a noticeable and distinct attractor of visual attention (i.e., not easily confused with other AOI categories), semantically distinct (e.g., approaching cars were a separate category from parking/unparking cars, because these objects were assumed to have a different meaning to participants), and frequently occurring (glances towards idiosyncratic objects such as shopping carts were not coded as a separate category). The annotation of fixations was conducted by the last author of this paper. The results of the annotations were discussed (e.g., via chat, by sharing screenshots) with the first two authors, leading to refinements in the definitions of the AOIs, and double-checks and adjustments in the annotations. No assessment of interrater reliability was performed.
Accordingly, the following 14 AOIs were defined (see for examples):
Table 1. Examples of fixations per area of interest.
Approaching car.
Driver in approaching car.
Parking/Unparking car.
Driver in parking/unparking car.
Other moving car (car driving away from the participant, elsewhere in the parking garage).
Driver in other moving car.
Wheels of moving or parked car.
Back of parked car.
Side of parked car.
Front of parked car.
Human outside car.
Experimenter (including fixation on the equipment, such as the laptop).
Ground (asphalt/lines).
Environment (objects in the environment, such as pillars, garage windows, and shopping carts).
The radius of the fixation circle was a tenth of the height of the image. If a fixation circle overlaid more than one object, the fixation was annotated as the object covered by the largest portion of the circle. For example, if the circle overlaid 70% of the back of a parked car and 30% of a wheel, the fixation was classified as ‘back of parked car’. Fixations on the driver were defined as fixations on the (location of the) face of the driver. However, if the car was far away so that the fixation circle was greater than half the width of the windshield, any fixation on the car was counted as a fixation on the car, not on the driver in that car.
Additionally, the total number of approaching cars, parked cars per parking space, parking/unparking cars, and humans outside cars encountered by each participant (either with or without fixations) were manually counted.
Data processing
An issue in real-world studies such as the present one is that not all participants yield the same amount of data, for example, due to differences in trial length or trackability of the pupils. We decided to cope with this issue via a normalisation procedure that ensured that results from different participants can be compared in a meaningful way. More specifically, the numbers of fixations per AOI were normalised per participant so that the total equalled 100% for each participant (EquationEq. 1(1)
(1) , where NF is the number of fixations, NNF is the normalised number of fixations, p is the participant number, and i is the AOI number). In this way, the normalised number of fixations represents, for each participant, how participants distributed their attention between the 14 AOIs. The normalised number of fixations was visualised in a boxplot.
(1)
(1)
In addition, we computed the total number of transitions (NT) between fixations on AOIs for all participants combined, yielding a 14 × 14 matrix (EquationEq. 2(2)
(2) ). This matrix provides the reader with an overview of the most frequently occurring transitions. A similar matrix was computed for the normalised number of transitions (NNT), where the normalisation was performed according to the expected number of transitions if participants had fixated entirely randomly according to the AOI base rates (EquationEq. 3
(3)
(3) , where C is a constant used to scale the values to a percentage of the total number of transitions). The NNT matrix allows for assessing which types of transitions stand out relative to random sampling.
(2)
(2)
(3)
(3)
As a follow-up analysis, we attempted to understand individual differences in the number of fixations. Accordingly, we calculated a head movement index, representing the mean absolute head yaw velocity, as calculated from the IMU in the eye-tracker. Loosely speaking, the head movement index represents how actively the participant was looking to the left and right. We computed Spearman’s rank-order correlation coefficients between the head movement index and the participants’ normalised fixation count.
The percentage of time that the participant was walking was extracted by filtering the signal of a vertically-oriented accelerometer that was embedded in the eye-tracker using a median filter with an order of 600 ms (a typical step interval). Walking was defined as this signal being above its median value over the entire trial.
Results
Data availability
The data recording lasted on average 144.0 s per participant (SD = 41.9 s, n = 43). For the first ten participants, who walked one lap, this was on average 78.9 s (SD = 9.7 s), and for the remaining 33 participants, who walked two laps, this was on average 163.7 s (SD = 23.5 s). The average percentage of available gaze samples, calculated by dividing the number of eye-tracking samples that were correctly identified by the theoretical maximum of 50 samples per second in 50 Hz data, was 62.3% (SD = 15.5%, n = 43). From the vertically-oriented accelerometer in the eye-tracker, we estimated that participants were walking (i.e., stepping) on average 96.3% of the time (SD = 4.0%).
From the 43 participants, a total of 12,996 fixations were recorded. Thus, an average of 302 fixations were annotated per participant. The number of fixations varied considerably between participants (SD = 160, min = 24, max = 691, n = 43). This large variation can partly be explained by individual differences in available gaze sample data and individual differences in the duration of the trial. On average, participants fixated on something for 31.2% of the time (SD = 19.2%, n = 43).
As a data quality criterion, we excluded participants for whom less than 10% of the total recording time consisted of fixations. A low percentage was caused by jittery or unavailable/interrupted eye-gaze data, as a result of which the algorithm could not capture the fixations of the participants. Accordingly, 36 of the 43 participants were retained. These participants yielded a total of 12,599 fixations, and a corresponding average of 350 fixations per participant (SD = 127, min = 150, max = 691). The 36 participants encountered an average of 8.0 approaching cars (SD = 3.7), 2.3 parking/unparking cars (SD = 1.8), and 7.7 humans outside cars (SD = 3.1). Furthermore, an average of 37.6 of the 57 parking places were occupied (SD = 7.4). For parking spaces 1–29, along which the participant walked (see ), 17.9 of the parking places were occupied (SD = 4.5, n = 36).
Fixation analysis
shows the distribution of the normalised number of fixations for different AOIs and participants. It can be seen that participants, on average, often looked at the ground (20.1%), the backs of parked cars (19.9%), the environment (14.5%), approaching cars (8.8%), as well as the side of parked cars (7.5%). The wheels of cars also received considerable attention (6.8%). Of note, most of the 853 fixations towards wheels concerned wheels of parked cars (71.6%) and wheels of approaching cars (19.7%), see Table S1 in the supplementary materials for a detailed analysis of which wheels participants fixated at.
Figure 2. Boxplot of the normalised number of fixations (NNF). Each circular marker represents one participant (n = 36). The green cross represents the participant mean. One marker for Ground (75.1%) is not shown as it falls outside the range of the y-axis.
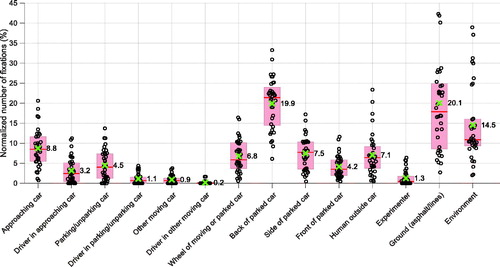
A portion of fixations were directed to drivers in cars (3.2% for drivers of approaching cars, 1.1% for drivers in parking/unparking cars, and 0.2% for drivers in other moving cars). In other words, based on the average of participants, 26.6% (3.2/(8.8 + 3.2)), 20.1% (1/1/(4.5 + 1.1)), and 16.3% (0.2/(0.9 + 0.2)) of the fixations towards, respectively, approaching cars, parking/unparking car, and other moving cars were on the driver.
showed the normalised number of fixations (NNF), which is a measure of how participants distributed their fixations across the 14 AOIs. For completeness, we also provide the total number of fixations (Figure S1) and the total fixation duration (Figure S2) in the supplementary materials. The results in Figures S1 and S2 are in agreement with , with most attention being paid to the ground, the backs of parked cars, and the environment (r = 0.99 between the 14 medians reported in and the medians reported in Figure S1), and r = 1.00 between the medians reported in and the 14 medians reported in Figure S2). In other words, the relative results are the same regardless of which metric we employ. The mean fixation duration, averaged across participants, was fairly constant across the different AOIs, between 121 ms and 144 ms. Exceptions were the drivers in approaching cars (195 ms) and drivers in parking/unparking cars (169 ms) AOIs, which yielded somewhat longer fixations (Figure S3).
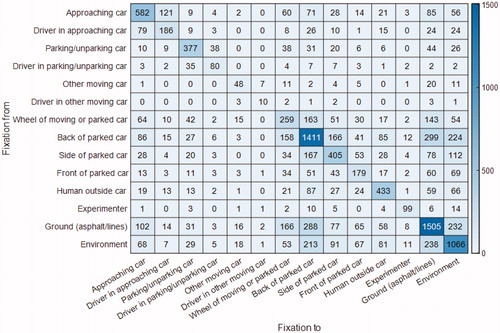
shows the total number of transitions (NT) between the different AOIs. It can be seen that the number of transitions for pairs of AOIs was highly symmetric. The strong symmetry indicates that participants were equally likely to sample from AOIi to AOIj as compared to from AOIj to AOIi, without clearly identifiable scan paths. For example, participants switched their attention from parking/unparking cars to the drivers of these cars (38 transitions) almost as often as from the drivers to the parking/unparking cars (35 transitions). Similarly, the number of transitions from the ground to the back of car and the number of transitions from the back of car to the ground were equivalent (288 and 299 transitions, respectively). also shows that participants were likely to re-fixate on the same type of AOI, as can be seen by the high numbers on the diagonal as compared to the off-diagonal numbers.
Figure 3. The number of transitions (NT) between AOIs (participants switching attention from ‘Fixation from’ to ‘Fixation to’). The total number of transitions is 12,563, which equals the total number of fixations (12,599) minus the number of participants (36). The numbers on the diagonal represent re-fixations on the same AOI.
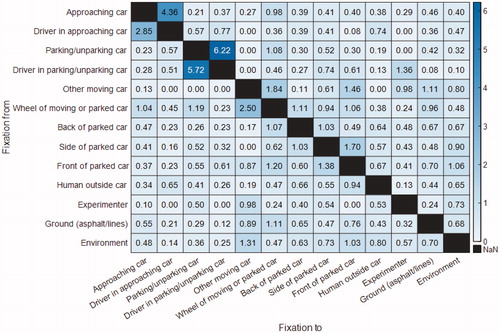
The results in offer insight into the absolute number of transitions, but do not elucidate which transitions dominate in relative terms. We therefore performed a normalisation of the numbers of fixations (NNT) according to the expected number of transitions if participants fixated entirely randomly based on the total number of fixations per AOI. The results in show a high number of transitions from parking/unparking cars to the drivers in parking/unparking cars and from drivers in the parking/unparking cars to parking/unparking cars. Similarly, a relatively large number of transitions were performed from approaching cars to drivers of approaching cars as well as in the opposite direction.
Figure 4. The normalised number of transitions (NNT) between AOIs. The normalisation was performed according to the expected number of transitions if totally random sampling were used (with diagonal removed). The data for the category ‘driver in other moving car’ was omitted because of the small number of fixations. The depicted numbers were multiplied with a constant C, so that they add up to 100%.
Head movement analysis
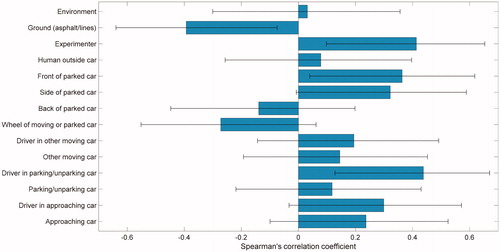
illustrates the head yaw rate of two participants: one participant with a low head movement index (11.3 deg/s) and one participant with a high head movement index (27.4 deg/s). In comparison, the mean head movement index of the 36 participants was 20.8 deg/s (SD = 5.35 deg/s). It can be seen that head movement takes the form of rapid head turns towards either the left or the right. The correlation coefficients in show that people with a higher head movement index were more likely to look at other humans and cars, and less likely to look at the ground.
Figure 5. Left: Head yaw rate of a participant with a low head movement index (11.3 deg/s). Right: Head yaw rate of a participant with a high head movement index (27.4 deg/s). A positive value indicates a rotational velocity towards the left.
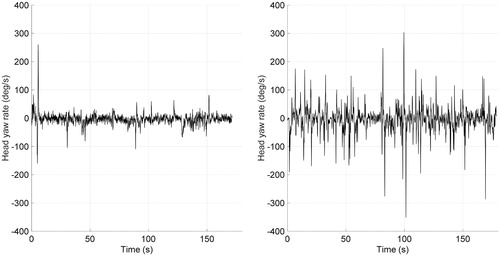
Figure 6. Correlation between head movement index and normalised number of fixations (n = 36). The error bars represent 95% confidence intervals.
Discussion
The purpose of this study was to examine what pedestrians look at when walking a number of laps through a parking garage. Our study was simple but relatively unique in the literature. To our knowledge, only a small number of outdoor studies with pedestrians or cyclists have been published so far, mostly focussing on locomotion and interactions with other pedestrians rather than interactions with vehicles in an unstructured environment (e.g., Arai et al. Citation2017; Fotios et al. Citation2015; Liu et al. Citation2020; Mantuano, Bernardi, and Rupi Citation2017; Rupi and Krizek Citation2019; Simpson et al. Citation2019; Trefzger et al. Citation2018).
We list some interesting observations from our study. It was striking that participants often looked at the backs of cars. There are several possible explanations for this phenomenon. First, the backs of cars are what was visible to the participants, whereas the fronts or sides, in a full parking garage, are often occluded by other parked cars. Second, the backs of the cars pose the most immediate threat and therefore requires the most attention. Third, the back of a parked car provides an important cue because it allows for detecting vehicle movement relative to the background as well as brake lights and reversing lights. If a car starts to reverse, the pedestrian should respond immediately by, for example, stopping for the car or walking around it. It should be noted here that it is useful to look at the back of a car even when this car shows no movement or activity. What is important for the pedestrian is to detect possible changes (e.g., initiation of movement, reversing lights or brake lights that turn on or off) that require action. The same principle of functional attention could apply to the cars approaching the participants in our study: These cars are not necessarily the nearest cars, but may be the most important cars for pedestrians to assess whether they should adjust their walking path.
Similarly, a substantial amount of attention was paid to the wheels of cars, in particular the rear wheels of parked cars. It can be argued that the wheels are suitable for detecting the intention of the driver as changes in speed can be picked up directly from their rotation. The fact that pedestrians are inclined to look at the wheels of cars appears to be a novel finding in the literature. Exceptions are Aupetit, Espié, and Bouaziz (Citation2015), who noted that motorcyclists look at the front wheels of cars to infer their intended lateral movement, and Vlakveld (Citation2014; see also De Winter et al. Citation2019), who used turned front wheels as a hazard precursor in a hazard perception study.
Most of the fixations were aimed at the ground. This could be explained by the fact that locomotion through the parking garage is a rather demanding task, with obstacles such as concrete bumpers in the parking places, and lines defining the walking area. These findings can be related to earlier work of Fotios et al. (Citation2015), who recorded eye movements of pedestrians walking through a university campus. They found that the pedestrians tended to look at their near path as well as small objects that could cause the pedestrian to slip. Similarly, Simpson et al. (Citation2019) reported that the fixations of pedestrians were primarily on the street edges and the ground, which would again indicate the importance of these elements for safe navigation.
The pedestrians also looked at the drivers in cars: In about 25% of the cases when the pedestrian looked towards an approaching car, the fixation was aimed at the driver. This finding is consistent with Dey et al. (Citation2019), who showed that pedestrians tend to look at the windshield, especially when the approaching car is close by, and offers a rebuttal to some recent voices suggesting that reading cues from the car driver is not important because pedestrians are perfectly capable of crossing the road in front of a driverless car (Moore et al. Citation2019). We argue that, although looking at the driver may not be essential for pedestrians to move around safely, pedestrians do try to use this information to make predictions about how a situation will unfold. The participants’ mean fixation durations were elevated for drivers in approaching cars, which may be because participants tried to track the driver (i.e., smooth pursuit) or process this information in depth, for example in an attempt to read the driver’s face or posture (and see Underwood, Crundall, and Chapman Citation2011, for an interpretation of fixation duration in traffic). The fact that other people’s faces attract attention may have an innate component. A study among infants previously showed that faces attract more attention than other visual objects (Gliga et al. Citation2009).
The normalised number of transitions showed that transitions between drivers and their cars was higher than what could be expected based on random sampling. In other words, it appears that pedestrians relatively often shifted focus from the car to its driver and back. The high number of transitions between driver and car may be due to the close proximity of these two AOIs, causing overlap, especially for noisy eye-tracker data. However, the high number of transitions may also suggest that pedestrians rely on vehicle motion in combination with cues from the driver when trying to judge an approaching vehicle’s intentions, as pointed out above. In other words, the driver and its vehicle appear to be interpreted jointly.
Of note, there were individual differences in whether participants looked at other humans. Some participants were more likely to look down towards the ground and less likely to make visual contact with other humans. It can be hypothesised that individual differences in looking behaviour to other humans are associated with an introverted or extroverted personality, as argued by Wu et al. (Citation2014). Further research could test this hypothesis using a large number of participants, and in controlled conditions with an equal number of other humans in the environment for all participants.
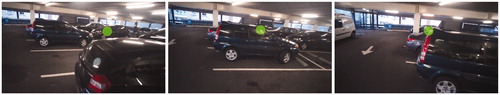
A limitation of our study is that there was a substantial amount of missing data. The Tobii Glasses are known among researchers as reliable, but the percentage of available data was somewhat disappointing. Future research should examine how data availability can be improved, either via technological advancements or improved experimental procedures. Another limitation, inherent to eye movement research, is that a participant’s fixations do not necessarily relate to the participant’s cognitive activity at that time. This is illustrated in . This figure shows that the pedestrian tracked an approaching car that emerged from behind parked cars. These fixations were conservatively classified as ‘side of parked car’ or ‘back of parked car’, but in essence they were devoted to a latent hazard behind these parked cars.
Figure 7. Example of a participant tracking a car behind parked cars.
Conclusions and implications
From our research, we can conclude that pedestrian viewing behaviour is highly targeted. Pedestrians seem to be extracting cues that can functionally contribute to the task of safely walking around the parking garage. At first sight, this conclusion may seem trivial, but, upon closer reflection, it is intriguing that pedestrians know how to focus on the right cues without visually searching for those cues. In a previous study in car driving, it was also found that very few fixations were made on irrelevant objects and scenery, leading the authors to conclude that ‘peripheral visual information is used in a very efficient way to guide the gaze at the relevant locations with high accuracy and reliability’ (Lappi, Rinkkala, and Pekkanen Citation2017).
What do the present findings mean for the development of eHMIs for automated cars? We found that pedestrians pay considerable attention to vehicle-centric cues such as wheels, approaching cars, and the backs of cars. Our observations are consistent with Cefkin et al. (Citation2019), who concluded that ‘vehicle motion was the primary basis of communicating vehicle actions and intent’ (p. 56). What our study shows is that people look at different sides and features of the car (front, side, rear, wheels), as well as humans in cars. This, in turn, would require that eHMIs are omnidirectionally visible, for example by means of a display on the roof (Vlakveld, Van der Kint, and Hagenzieker Citation2020) or LED strips on the car (Cefkin et al. Citation2019; Nissan Citation2015; Volvo Cars Citation2018). Our findings also suggest that an eHMI on only the front of the car, which appears to be the norm in the literature so far (Dey et al. Citation2020), is of limited use in parking garages, as the fronts of cars receive less than 50% of the attention than the backs of cars.
Finally, we note that the fact that vehicle motion cues seem dominant does not imply that eHMIs are superfluous. As shown in the present study, pedestrians often look at the driver as well, suggesting that humans may benefit from an eHMI when driverless cars hit the roads. eHMIs may remove confusion for pedestrians, or be used to communicate information that cannot be deduced at all from vehicle movement. An example of this is the current state of automation; that is, whether the automation is currently active or not. Another idea could be to have an eHMI display that the automated car is about to drive away, a few seconds before the car actually does so (Eisma et al. Citation2019; Singer et al. Citation2020). We see this type of anticipatory eHMIs as an interesting subject for follow-up research.
| Abbreviations | ||
| AOI | = | area of interest |
| eHMI | = | external human-machine interface |
| NF | = | number of fixations |
| NNF | = | normalised number of fixations |
| NT | = | number of transitions |
| NNT | = | normalised number of transitions |
Supplemental Material
Download MS Word (252.3 KB)Disclosure statement
No potential conflict of interest was reported by the authors.
Data availability statement
Raw data and MATLAB code used for the analysis is available at https://doi.org/10.4121/13488384
Additional information
Funding
References
- Arai, Y., S. Yokota, K. Yamada, A. Matsumoto, D. Chugo, and H. Hashimoto. 2017. “Analysis of Gaze Information on Actual Pedestrian Behavior in Open Space—Which Body Part of an Oncoming Pedestrian do People Gaze At?” Paper presented at IEEE/SICE International Symposium on System Integration (SII), 704–709. doi:10.1109/SII.2017.8279304.
- Aupetit, S., S. Espié, and S. Bouaziz. 2015. “Naturalistic Study of Riders’ Behaviour in Lane-Splitting Situations.” Cognition, Technology & Work 17 (2): 301–313. doi:10.1007/s10111-014-0293-z.
- Ballard, D. H., M. M. Hayhoe, and J. B. Pelz. 1995. “Memory Representations in Natural Tasks.” Journal of Cognitive Neuroscience 7 (1): 66–80. doi:10.1162/jocn.1995.7.1.66.
- Banzhaf, H., D. Nienhüser, S. Knoop, and J. M. Zöllner. 2017. “The Future of Parking: A Survey on Automated Valet Parking with an Outlook on High Density Parking.” Paper presented at IEEE Intelligent Vehicles Symposium (IV), 1827–1834. doi:10.1109/IVS.2017.7995971.
- Bazilinskyy, P., D. Dodou, and J. C. F. De Winter. 2019. “Survey on eHMI Concepts: The Effect of Text, Color, and Perspective.” Transportation Research Part F: Traffic Psychology and Behaviour 67: 175–194. doi:10.1016/j.trf.2019.10.013.
- Bazilinskyy, P., D. Dodou, and J. C. F. De Winter. 2020. “External Human-Machine Interfaces: Which of 729 colors is best for signaling ‘Please (do not) cross’?” IEEE International Conference on Systems, Man and Cybernetics (SMC). doi:10.1109/SMC42975.2020.9282998.
- Cefkin, M., J. Zhang, E. Stayton, and E. Vinkhuyzen. 2019. “Multi-Methods Research to Examine External HMI for Highly Automated Vehicles.” In HCI in Mobility, Transport, and Automotive Systems. HCII 2019. Lecture Notes in Computer Science, edited by H. Krömker, vol. 11596, 46–64. Cham: Springer. doi:10.1007/978-3-030-22666-4_4.
- De Clercq, K., A. Dietrich, J. P. Núñez Velasco, J. De Winter, and R. Happee. 2019. “External Human-Machine Interfaces on Automated Vehicles: Effects on Pedestrian Crossing Decisions.” Human Factors 61 (8): 1353–1370. doi:10.1177/0018720819836343.
- De Winter, J. C. F., Y. B. Eisma, C. D. D. Cabrall, P. A. Hancock, and N. A. Stanton. 2019. “Situation Awareness Based on Eye Movements in Relation to the Task Environment.” Cognition, Technology & Work 21 (1): 99–111. doi:10.1007/s10111-018-0527-6.
- Deb, S., L. J. Strawderman, and D. W. Carruth. 2018. “Investigating Pedestrian Suggestions for External Features on Fully Autonomous Vehicles: A Virtual Reality Experiment.” Transportation Research Part F: Traffic Psychology and Behaviour 59: 135–149. doi:10.1016/j.trf.2018.08.016.
- Dey, D., A. Habibovic, A. Löcken, P. Wintersberger, B. Pfleging, A. Riener, M. Martens, and J. Terken. 2020. “Taming the eHMI Jungle: A Classification Taxonomy to Guide, Compare, and Assess the Design Principles of Automated Vehicles' External Human-Machine Interfaces.” Transportation Research Interdisciplinary Perspectives 7: 100174. doi:10.1016/j.trip.2020.100174.
- Dey, D. D., A. Habibovic, B. Pfleging, M. H. Martens, and J. Terken. 2020. “Color and Animation Preferences for a Light Band eHMI in Interactions between Automated Vehicles and Pedestrians.” Paper presented at Proceedings of the CHI 2020 Conference on Human Factors in Computing Systems. doi:10.1145/3313831.3376325.
- Dey, D.,. F. Walker, M. Martens, and J. Terken. 2019. “Gaze Patterns in Pedestrian Interaction with Vehicles: Towards Effective Design of External Human-Machine Interfaces for Automated Vehicles.” Paper presented at Proceedings of the 11th International Conference on Automotive User Interfaces and Interactive Vehicular Applications, 369–378. 10.1145/3342197.3344523
- Eisma, Y. B., S. Van Bergen, S. M. Ter Brake, M. T. T. Hensen, W. J. Tempelaar, and J. C. F. De Winter. 2019. “External Human-Machine Interfaces: The Effect of Display Location on Crossing Intentions and Eye Movements.” Information 11 (1): 13. doi:10.3390/info11010013.
- Faas, S. M., and M. Baumann. 2019. “Light-Based External Human Machine Interface: Color Evaluation for Self-Driving Vehicle and Pedestrian Interaction.” Proceedings of the Human Factors and Ergonomics Society Annual Meeting 63 (1): 1232–1236. doi:10.1177/1071181319631049.
- Faas, S. M., L.-A. Mathis, and M. Baumann. 2020. “External HMI for Self-Driving Vehicles: Which Information Shall Be Displayed?” Transportation Research Part F: Traffic Psychology and Behaviour 68: 171–186. doi:10.1016/j.trf.2019.12.009.
- Fotios, S., J. Uttley, C. Cheal, and N. Hara. 2015. “Using Eye-Tracking to Identify Pedestrians’ Critical Visual Tasks, Part 1.” Lighting Research & Technology 47 (2): 133–148. doi:10.1177/1477153514522472.
- Fraedrich, E., S. Beiker, and B. Lenz. 2015. “Transition Pathways to Fully Automated Driving and Its Implications for the Sociotechnical System of Automobility.” European Journal of Futures Research 3 (1): 11. doi:10.1007/s40309-015-0067-8.
- Fridman, L., B. Mehler, L. Xia, Y. Yang, L. Y. Facusse, and B. Reimer. 2019. “To Walk or not to Walk: Crowdsourced Assessment of External Vehicle-to-Pedestrian Displays.” Paper presented at Proceedings of Transportation Research Board Annual Meeting, Washington, DC.
- Gliga, T., M. Elsabbagh, A. Andravizou, and M. Johnson. 2009. “Faces Attract Infants' Attention in Complex Displays.” Infancy: The Official Journal of the International Society on Infant Studies 14 (5): 550–562. doi:10.1080/15250000903144199.
- Hensch, A. C., I. Neumann, M. Beggiato, J. Halama, and J. F. Krems. 2020. “How Should Automated Vehicles Communicate?–Effects of a Light-Based Communication Approach in a Wizard-of-Oz Study.” In Advances in Human Factors of Transportation. AHFE 2019. Advances in Intelligent Systems and Computing, edited by N. Stanton, vol. 964, 79–91. Cham: Springer. doi:10.1007/978-3-030-20503-4_8.
- interACT. 2017. “Designing cooperative interaction of automated vehicles with other road users in mixed traffic environments.” https://www.interact-roadautomation.eu
- Kaleefathullah, A. A., N. Merat, Y. M. Lee, Y. B. Eisma, R. Madigan, J. Garcia, and J. C. F. De Winter. 2021. “External Human-Machine Interfaces can be misleading: An examination of trust development and misuse in a CAVE-based pedestrian simulation environment.” Human Factors. doi:10.1177/0018720820970751.
- Land, M. F. 2006. “Eye Movements and the Control of Actions in Everyday Life.” Progress in Retinal and Eye Research 25 (3): 296–324. doi:10.1016/j.preteyeres.2006.01.002.
- Lappi, O., P. Rinkkala, and J. Pekkanen. 2017. “Systematic Observation of an Expert Driver's Gaze Strategy-An On-Road Case Study.” Frontiers in Psychology 8: 620. doi:10.3389/fpsyg.2017.00620.
- Liu, B., W. Dong, Z. Zhan, S. Wang, and L. Meng. 2020. “Differences in the Gaze Behaviours of Pedestrians Navigating between Regular and Irregular Road Patterns.” ISPRS International Journal of Geo-Information 9 (1): 45. doi:10.3390/ijgi9010045.
- Mantuano, A., S. Bernardi, and F. Rupi. 2017. “Cyclist Gaze Behavior in Urban Space: An Eye-Tracking Experiment on the Bicycle Network of Bologna.” Case Studies on Transport Policy 5 (2): 408–416. doi:10.1016/j.cstp.2016.06.001.
- Millard-Ball, A. 2018. “Pedestrians, Autonomous Vehicles, and Cities.” Journal of Planning Education and Research 38 (1): 6–12. doi:10.1177/0739456X16675674.
- Moore, D., R. Currano, G. E. Strack, and D. Sirkin. 2019. “The Case for Implicit External Human-Machine Interfaces for Autonomous Vehicles.” Paper presented at Proceedings of the 11th International Conference on Automotive User Interfaces and Interactive Vehicular Applications, 295–307. doi:10.1145/3342197.3345320.
- Nissan. 2015. “IDS Concept.” https://www.nissan.co.uk/experience-nissan/concept-cars/ids-concept.html
- Rupi, F., and K. J. Krizek. 2019. “Visual Eye Gaze While Cycling: analysing Eye Tracking at Signalised Intersections in Urban Conditions.” Sustainability 11: 6089. doi:10.3390/su11216089.
- Simpson, J., M. Freeth, K. J. Simpson, and K. Thwaites. 2019. “Visual Engagement with Urban Street Edges: insights Using Mobile Eye-Tracking.” Journal of Urbanism: International Research on Placemaking and Urban Sustainability 12 (3): 259–278. doi:10.1080/17549175.2018.1552884.
- Singer, T., J. Kobbert, B. Zandi, and T. Q. Khanh. 2020. “Displaying the Driving State of Automated Vehicles to Other Road Users: An International, Virtual Reality-Based Study as a First Step for the Harmonized Regulations of Novel Signaling Devices.” IEEE Transactions on Intelligent Transportation Systems. 10.1109/TITS.2020.3032777.
- Tobii. 2018. “When do I use the I-VT Attention filter?” https://connect.tobiipro.com/s/article/When-do-I-use-the-I-VT-Attention-filter?language=en_US
- Trefzger, M., T. Blascheck, M. Raschke, S. Hausmann, and T. Schlegel. 2018. “A Visual Comparison of Gaze Behavior from Pedestrians and Cyclists.” Paper presented at Proceedings of the 2018 ACM Symposium on Eye Tracking Research & Applications. doi:10.1145/3204493.3204553.
- Underwood, G., D. Crundall, and P. Chapman. 2011. “Driving Simulator Validation with Hazard Perception.” Transportation Research Part F: Traffic Psychology and Behaviour 14 (6): 435–446. doi:10.1016/j.trf.2011.04.008.
- Vlakveld, W. P. 2014. “A Comparative Study of Two Desktop Hazard Perception Tasks Suitable for Mass Testing in Which Scores Are Not Based on Response Latencies.” Transportation Research Part F: Traffic Psychology and Behaviour 22: 218–231. doi:10.1016/j.trf.2013.12.013.
- Vlakveld, W., S. Van der Kint, and M. P. Hagenzieker. 2020. “Cyclists’ Intentions to Yield for Automated Cars at Intersections When They Have Right of Way: Results of an Experiment Using High-Quality Video Animations.” Transportation Research Part F: Traffic Psychology and Behaviour 71: 288–307. doi:10.1016/j.trf.2020.04.012.
- Volvo Cars. 2018. “360c.” https://www.volvocars.com/intl/cars/concepts/360c
- Wu, D. W. L., W. F. Bischof, N. C. Anderson, T. Jakobsen, and A. Kingstone. 2014. “The Influence of Personality on Social Attention.” Personality and Individual Differences 60: 25–29. doi:10.1016/j.paid.2013.11.017.
- Zhang, B., J. De Winter, S. Varotto, R. Happee, and M. Martens. 2019. “Determinants of Take-over Time from Automated Driving: A Meta-Analysis of 129 Studies.” Transportation Research Part F: Traffic Psychology and Behaviour 64: 285–307. doi:10.1016/j.trf.2019.04.020.