
 ?Mathematical formulae have been encoded as MathML and are displayed in this HTML version using MathJax in order to improve their display. Uncheck the box to turn MathJax off. This feature requires Javascript. Click on a formula to zoom.
Abstract
Automated vehicles could increase the risk of motion sickness because occupants are not involved in driving and do not watch the road. This paper aimed to investigate the influence of motion predictability on motion sickness in automated vehicles, as better motion anticipation is believed to mitigate motion sickness. In a simulator-based study, twenty participants experienced two driving conditions differing only in turn directions. The repetitive condition featured a repeating turn direction pattern. The non-repetitive condition contained pseudo-randomly ordered turn directions. To mimic an ‘eyes-off-the-road’ setting and prevent visual motion anticipation, road visuals were omitted. No significant differences in sickness or head motion, a metric for motion anticipation, were found between the conditions. No participant recognised the repeating turn pattern. This suggests no increased motion anticipation in the repetitive condition, possibly due to a reduced ability to recognise a repeating motion pattern in one degree of freedom within more complex motion.
PRACTITIONER SUMMARY
Motion anticipation is believed to mitigate motion sickness. However, in this simulator-based study on automated vehicles, no significant differences in motion anticipation or sickness were observed between repetitive and non-repetitive turn directions. Recognition of a repeating motion pattern in one degree of freedom might be diminished when it is part of more complex motion.
Introduction
Automated vehicles are envisioned to bring ample benefits to society, ranging from lower emission levels, increased traffic efficiency and safer roads, to improved mobility for those unable or unwilling to drive, and increased productivity by being able to engage in non-driving activities (Diels and Bos Citation2016). However, the combination of (1) transitioning from being an active driver to being a passenger, (2) engaging in activities such as reading a book or working on a laptop, and (3) new vehicle (cabin) designs, can be expected to increase the incidence and severity of motion sickness in automated vehicles (Diels and Bos Citation2016; Jones et al. Citation2019; Wada Citation2016). Since this could jeopardise the widespread adoption and thereby the environmental and societal benefits of these vehicles, understanding how motion sickness can be mitigated is of paramount importance for their design.
The sensory conflict theory states that motion sickness occurs when the motion perceived by our sensory systems is at variance with the motion as expected based on previous experience (Reason and Brand Citation1975). This could explain why, whereas drivers rarely suffer from it, motion sickness is a widespread problem amongst passengers. Passengers’ lack of control over the vehicle’s motion reduces their ability to anticipate upcoming motion, leading to a larger discrepancy between the sensed and expected motion (Dong, Yoshida, and Stoffregen Citation2011; Rolnick and Lubow Citation1991). Moreover, whereas drivers tend to incline their trunk and head into the direction of the curve when negotiating a turn, passengers’ trunk and head exhibit a passive tilt in the opposite direction (Fukuda Citation1976; Zikovitz and Harris Citation1999). Actively tilting the head in the curve’s direction, i.e. aligning the head with the gravito-inertial force, has been demonstrated to alleviate motion sickness (Wada et al. Citation2012; Wada and Yoshida Citation2016). Analogously, in an experimental study with oscillatory fore-aft motion, participants experienced less motion sickness when they actively aligned their head with the tilting gravito-inertial force, compared to when they self-initiated head tilts that were misaligned (180° out of phase) with the gravito-inertial force (Golding et al. Citation2003). However, when the (mis)alignment was achieved through active suspension – inducing passive head tilts – rather than active head tilts, the opposite effect was observed. Specifically, passive alignment of the head with the tilting gravito-inertial force resulted in more severe motion sickness compared to passively tilting the head out of phase with the gravito-inertial force (Golding et al. Citation2003).
In addition to not being in control of the motion, occupants will likely not maintain a view on the road ahead anymore in automated vehicles. This results from, for example, engaging in non-driving tasks, smaller front windows that inhibit the outside view, or different seating arrangements that face away from the car’s front window (Diels and Bos Citation2016; Wada Citation2016). The absence of visual information of the upcoming road not only prevents occupants from being able to anticipate the vehicle’s motion, but engaging in leisure or work activities, or just seeing the vehicle’s interior, also leads to an incongruence between what is seen, i.e. visual information, and what is felt by other senses, such as the vestibular system. This, in turn, increases motion sickness (Reason and Brand Citation1975). Previous real-world driving studies have indeed found reduced motion sickness in outside-view conditions compared to inside-view conditions (Griffin and Newman Citation2004b; Irmak, Pool, and Happee Citation2021; Probst et al. Citation1982; Turner and Griffin Citation1999a).
One approach to mitigate the expected decrease in motion anticipation in automated vehicles may be to use anticipatory cues that inform the vehicle occupants of the upcoming motion. Although some inconclusive outcomes have been observed (Reuten et al. Citation2023), most recent studies have demonstrated that (ambient) lighting (Bohrmann, Bruder, and Bengler Citation2022; Hainich et al. Citation2021; Karjanto et al. Citation2018), sound (Kuiper et al. Citation2020a; Maculewicz, Larsson, and Fagerlönn Citation2021) and vibrotactile cues (Li and Chen Citation2022) may be effective for this purpose. Nonetheless, a potential disadvantage of anticipatory cues is that they may interfere with non-driving activities, and may therefore not be preferred in all situations.
Another approach to partly negate the expected decrease in motion anticipation could potentially be to make the vehicle’s motion more predictable. This approach has, as yet, received less attention. For simple fore-aft movement, it has previously been demonstrated that unpredictable motion, either in direction or in timing, is more provocative than a fully predictable, and hence easier-to-anticipate, motion pattern (Kuiper et al. Citation2020b). Still, to what extent this finding carries over to more complex vehicle motion is to be explored in a multi-stage investigation, considering that vehicle motion consists of several degrees of freedom, which could all have their own level of predictability.
This study undertakes a first step in evaluating the influence of vehicle motion predictability on motion sickness development. It does so by assessing the extent to which varying the level of repetition in a single degree of freedom affects perceived motion predictability and motion sickness throughout a drive with vehicle braking, turning and accelerating. A simulator study was carried out in which participants experienced two ‘fully automated driving’ conditions, only varying in the level of repetition in the turn directions.
Experiment methods
Apparatus
The experiment was performed in the SIMONA Research Simulator (SRS) at Delft University of Technology (). The SRS is equipped with a six-degrees-of-freedom hydraulic hexapod motion system, which can provide maximum surge and sway translations of about +1.26 m/–0.98 m and ±1.03 m, respectively. Its maximum roll, pitch, and yaw rotations are about ±26°, ±24°, and ±41°, respectively (Stroosma, Van Paassen, and Mulder Citation2003). Simulator motion data were logged at a rate of 100 Hz.
Figure 1. Experiment setup.
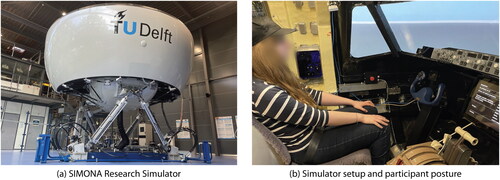
Dynamic visuals of the road and its surroundings were not included as to mimic the expected ‘eyes-off-the-road’ setting in automated vehicles (Diels and Bos Citation2016; Wada Citation2016), and to prevent motion anticipation using peripheral visual information. Dynamic visuals were also omitted as those were likely to induce (severe) simulator sickness in some participants. Such sickness could result from the mismatch between the scaled and attenuated vehicle motion provided by the motion system and what would be the ‘full’ view on the road ahead and its surroundings provided by the visual system. Especially a mismatch in the yaw rotation could have provoked considerable simulator sickness (Kim et al. Citation2023). Instead, to suppress participants’ perception of the tilt coordination used as part of the motion cueing (see Motion cueing), a static artificial horizon was projected on the 180° (horizontal) × 40° (vertical) collimated ‘out-the-window’ visual system (). This artificial horizon formed the entire ‘outside view’ and consisted of a light blue upper rectangle, representing the sky, and a gray lower rectangle, representing the ground. A white horizontal line was placed at the height at which these two representations meet. This should prevent that the sky and ground would be perceived as merging into one another when looking at the horizon for extended periods of time.
Due to COVID-19 restrictions, participants were not allowed to wear headphones. Instead, a static engine sound was played over speakers to increase immersion and to mask the sound of the simulator actuators, which could otherwise have aided participants in anticipating upcoming motion. A static instead of dynamic engine sound was employed as to also avoid that participants could use the pitch and intensity of the engine sound for motion anticipation.
Participants’ head motion was measured using TrackIRFootnote1 developed by NaturalPoint Inc., an optical motion tracking system designed to track head motion in six degrees of freedom. Head position and orientation were measured using the TrackIR infrared camera, which was mounted on the control panel in front of the participant’s seat. This camera observes invisible infrared light directed back by three retro-reflective markers glued to a rigid clip. This rigid clip was attached to a black cap worn by the participants (). Head motion data were logged at a rate of 32 Hz.
Participants
Twenty participants (seventeen male, three female) with a mean age of 21.8 years (SD = 2.6 years) completed the experiment. All were students at TU Delft not familiar with the research. They reported a median Motion Sickness Susceptibility Questionnaire (MSSQ)-short score of 8.6 (M = 9.9, SD = 9.9), which falls around the 40th percentile for motion sickness susceptibility (Golding Citation2006). All reported to have normal or corrected-to-normal vision and no vestibular disorders. Participants were asked to refrain from consuming alcohol or other substances with similar effects at least 24 h prior to the experiment sessions. The experiment design and protocol were approved by the Human Research Ethics Committee of TU Delft (application number 1768). All participants provided written informed consent prior to their participation.
Procedures
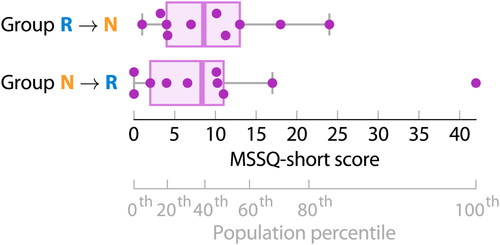
All participants experienced two ‘fully automated driving’ conditions in the simulator on two separate days, with an interval between 1 and 7 days (M = 3.7 days, SD = 2.3 days). This was done to prevent that motion sickness developed in one condition would carry over into the other condition. From a motion habituation point of view, it might have been preferable if all participants would have performed the two experiment sessions with an interval of seven days or longer. Earlier studies have suggested that such an interval minimises the influence of habituation or adaptation on the outcome of the second session (Kennedy, Stanney, and Dunlap Citation2000). However, in practice, this would have posed a greater difficulty for participants to fairly and accurately compare the two experiment sessions, as was requested from them at the end of the second session. Moreover, participants’ availability had to be accommodated for. The order of the two conditions was counterbalanced between participants to minimise the impact of the order effect on the dependent measures. Participants were assigned to one of the two condition order groups based on their raw MSSQ-short score. The aim was to achieve a similar variability in participants’ motion sickness susceptibility in the two groups (see ). A second, grey axis has been added in to visualise the relationship between the raw MSSQ-short score and motion sickness susceptibility observed in the general population. A Mann-Whitney U test confirmed that there was no statistically significant difference between the MSSQ-short scores of the two groups (U = 42.5, p = 0.570, r = 0.13).
Figure 2. Participants’ Motion Sickness Susceptibility Questionnaire (MSSQ)-short scores for the two condition order groups (N = 2 x 10).
At the start of the first session, participants were briefed on the experiment setup and procedures, and instructed on the use of the Motion Illness Symptoms Classification (MISC; previously known as MIsery SCale) used to assess their motion sickness (Bos, MacKinnon, and Patterson Citation2005; Reuten et al. Citation2021). In both sessions, participants were seated in the left-hand simulator seat and instructed to maintain a relaxed, upright posture and minimise active head movements. They were requested to look straight ahead, through the windshield, at the artificial horizon ().
The sessions consisted of a 30-minute motion exposure and a subsequent 15-minute recovery period, during which participants remained seated in the non-moving simulator. Throughout the full 45 minutes, participants verbally reported their MISC score as a single integer in 30-second intervals in response to an automated sound cue heard over speakers. The researcher wrote down their responses to avoid that participants had to move their head when providing their MISC score. A visual depiction of the MISC scale was presented on a separate screen, in front of the participant’s seat with a slight offset to the right (right border of ). As an exception to the head movement instructions mentioned earlier, participants were allowed to rotate their head to have a look at the scale whenever necessary.
The 30-minute motion exposure was aborted prematurely if the participant reported a MISC score of 6 (slight nausea) twice in a row (i.e. with a 30-second interval), or a score of 7 (fairly nauseous) or higher for the first time. However, participants were not informed of this predefined cut-off score in advance. This was decided as in a previous experiment, in which participants had been notified in advance, discrepancies had been observed between their MISC scores recorded throughout the motion exposure and their motion sickness symptoms reported after the motion exposure (Wijlens et al. Citation2022). The MISC scores of several participants had been lower than what would have been expected based on their reported motion sickness symptoms. It was believed that these discrepancies could have been related to participants being hesitant to report a score of 6 or higher, as they were aware that this would lead to the premature cessation of the motion. In their judgement, they may have felt ‘well enough’ to continue, despite experiencing (slight) nausea. Apart from aborting the motion at a predefined cut-off MISC score, a motion exposure was also always terminated prematurely whenever requested by the participant.
Driving condition design
The two fully automated driving conditions featured a 22-km road including 60 curves. This road was driven in 30 minutes under the assumption that there were no other road users. The conditions were designed to resemble urban driving, which is characterised by regular accelerating, braking and turning. These manoeuvres are dominated by low-frequency motion below 0.3 Hz (Griffin and Newman Citation2004a; Turner and Griffin Citation1999b), which is known to induce motion sickness (Donohew and Griffin Citation2004; McCauley et al. Citation1976).
Condition Repetitive incorporated turn directions in a repeating pattern of three right turns, followed by three left turns. This pattern was chosen as it was expected to be recognisable. At the same time, it was somewhat more realistic than, for example, a repeating pattern of one right turn, followed by one left turn. Condition Non-repetitive, the driving condition with pseudo-randomly ordered turn directions, contained four occurrences of three consecutive left turns, four occurrences of two consecutive left turns, and ten instances of single left turns, totalling 30 left turns. The same occurrences were included for right turns (see ). To maintain a random appearance in turn directions, the order of these occurrences was, of course, also pseudo-randomised. shows the road layouts of the two driving conditions.
Figure 3. Road layouts of the two driving conditions.
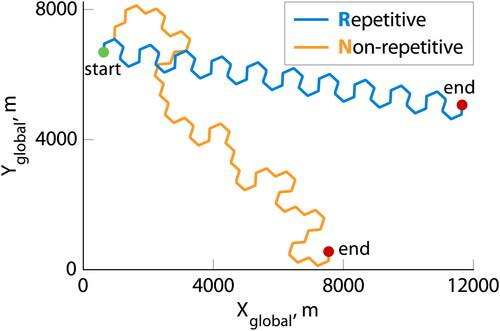
Table 1. Turn sequences of the two driving conditions.
Apart from their variation in the turn directions, both conditions consisted of a repetition of the following driving manoeuvres. A straight road section was driven with a constant speed of 50 km/h to resemble urban driving speeds. Near the end of the straight road section, before entering a curve, the ‘vehicle’ decelerated to a speed of 30 km/h with which it could safely take the turn (Bosetti, Lio, and Saroldi Citation2014). After having taken the turn with this lower, constant speed, at the start of the next straight road section, the ‘vehicle’ accelerated again to a constant speed of 50 km/h. Although the strictly separate longitudinal and lateral vehicle accelerations are not fully representative of real-world driving (Flynn et al. Citation2021; Wolfermann, Alhajyaseen, and Nakamura Citation2011), this was a deliberate choice to increase the likelihood that the turn directions would be clearly perceived.
All constant-speed straight road sections were equal in length to avoid unpredictability in the timing of the vehicle manoeuvres. Furthermore, all longitudinal deceleration profiles before a curve were the same. This also held for all longitudinal acceleration profiles after a curve. Similarly, all lateral acceleration profiles were identical, except in sign. Curves of 66° were driven, as higher-degree turns would have been more difficult to replicate within the limited motion space of the simulator (see Motion cueing). The advantage of all acceleration manoeuvres of a single type being identical was that it enabled the full utilisation of the simulator motion space during each braking-turning-accelerating manoeuvre sequence. However, more importantly, the choice for identical manoeuvre sequences in combination with all straight road sections being equal in length ensured that Condition R was fully consistent in both direction and timing, and hence, fully repetitive.
The longitudinal acceleration and deceleration profiles were based on the kinematic polynomial acceleration model of Akçelik and Biggs (Citation1987) as given by EquationEquations (1)(1)
(1) and Equation(2)
(2)
(2) . This model satisfies a realistic condition of zero acceleration at the start and end of the acceleration phase as well as smooth acceleration changes.
(1)
(1)
(2)
(2)
In EquationEquation (1)(1)
(1) , a(t) is the acceleration at time t in m/s2, am is the maximum acceleration in m/s2, θ is the ratio of time since start of acceleration to total acceleration time, i.e.
, m and n are parameters to be determined, and r is a parameter as defined in EquationEquation (2)
(2)
(2) . As recommended by Akçelik and Biggs (Citation1987), the free parameter n was set equal to 1.0. The free parameter m was chosen such that the maximum acceleration value was reached 1 s into the acceleration phase, and the largest absolute deceleration value 1.5 s before the end of the deceleration phase (Wang et al. Citation2004, Citation2005).
Finally, the longitudinal acceleration and deceleration profiles were passed through a second-order low-pass filter as given by EquationEquation (3)(3)
(3) with a time constant of τs = 0.1 s. This was done to smoothen the sharp increases at the start and end of these profiles, and thereby reduce unrealistically large jerk values to values that are closer to those occurring in real-world driving (Feng et al. Citation2017; Wolfermann, Alhajyaseen, and Nakamura Citation2011). Clothoids were implemented to transition between straight road sections and constant-radius-curves. As a result, the lateral acceleration profiles had a trapezoidal shape. This restricted lateral jerk values to those occurring in real-world driving (Ren et al. Citation2023), and prevented unrealistic instantaneous increases in lateral acceleration from zero to its maximum value. Although clothoids are generally used in the construction of roads designed for higher speeds than urban roads (American Association of State Highway and Transportation Officials Citation2018), this simplified approach to limit lateral jerk values was considered reasonable, as the main goal was to obtain driving conditions that resembled real-world driving to a degree appropriate for investigating the influence of vehicle motion predictability on motion sickness. In real-world driving, individuals also do not drive the entire curve with a constant radius. When negotiating a curve, drivers follow their own unique trajectory (Barendswaard et al. Citation2019). Previous research has, however, suggested that smoother transition curves may be effective in reducing motion sickness (Siddiqi et al. Citation2022).
(3)
(3)
To resemble real-world driving, the maximum longitudinal and lateral acceleration values were chosen such that they matched a ‘typical’ driving style, neither being ‘defensive’, nor ‘aggressive’, driving behaviour (Karjanto et al. Citation2016). The acceleration and jerk time histories of a single decelerating-turning-accelerating manoeuvre sequence are shown in . The final acceleration profile and road layout parameters are listed in .
Figure 4. Vehicle acceleration and jerk profiles.
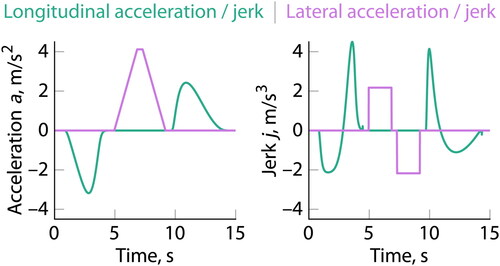
Table 2. Acceleration profile and road layout parameter values.
Vehicle motion was simulated in the horizontal plane, i.e. no vehicle suspension or road grade and/or irregularities (rumble) were included. The designed driving conditions did therefore not include any heave, pitch, or roll motion. Motion in these degrees of freedom is usually modest on a smooth and level road, and would thus have a minor influence on motion sickness. Furthermore, no vehicle model was implemented. As a result, the ‘actual’ vehicle accelerations were identical to the designed vehicle accelerations. This was also considered appropriate, as the aim was not to obtain vehicle motion that was as realistic as possible.
Motion cueing
Due to the limited motion space of the SRS, the vehicle’s surge, sway and yaw motion could not be fully presented. Therefore, a classical washout algorithm was applied to transform the vehicle’s translational accelerations and rotational rates into corresponding simulator motion (Reid and Nahon Citation1985). The vehicle’s motion was scaled by a gain K and attenuated through a first-order high-pass filter, as given by EquationEquation (4)(4)
(4) . To better cue (apparent) sustained linear accelerations, as experienced during car braking, accelerating and turning, a second-order low-pass filter was applied for tilt coordination, as given by EquationEquation (5)
(5)
(5) . Here, the angular rate was limited to 3°/s (Groen and Bles Citation2004). Motion filtering was performed such that the motion cues experienced in the left-hand simulator seat, where the participant sat, simulated the motion felt in the left-hand back seat of a real vehicle, i.e. 1 m behind and 0.5 m to the left of the vehicle’s centre of gravity.
(4)
(4)
(5)
(5)
In EquationEquations (4)(4)
(4) and Equation(5)
(5)
(5) ,
and
represent the high-pass and low-pass filter break frequencies, respectively, in rad/s, and
represents the low-pass filter damping ratio. Identical motion filter settings were applied for surge, sway and yaw motion with
= 0.37 and
= 1.0 rad/s (= 0.16 Hz). Both pitch and roll tilt were applied with
= 5.0 rad/s (= 0.80 Hz) and
= 1.0.
To remain within the SRS’s motion space while applying first-order high-pass filters, off-line prepositioning was implemented ‘on the straight road sections’ to virtually enlarge the motion envelope. Prepositioning accelerations remained below the human’s perceptual threshold of 0.04 m/s2 to avoid rendering of false motion cues (Heerspink et al. Citation2005).
Dependent measures
To quantify differences in motion anticipation and motion sickness between the two driving conditions, six dependent measures, of which five are subjective, and one is objective, were recorded or computed for each individual:
Motion predictability:
At the end of the second experiment session:
(1) The perceived predictability of the simulator motion as well as its influence on participants’ postural behaviour and subjective motion comfort were inquired into through means of five-point Likert scale statements. These were supplemented with open questions to request elaborations on the statement responses.
Head motion:
In both experiment sessions:
(2) Time delay between simulator motion and head motion: Head position and orientation were tracked throughout the 30-minute motion exposure, as head motion has been related to motion anticipation (Fukuda Citation1976; Zikovitz and Harris Citation1999) and motion sickness alleviation (Wada et al. Citation2012; Wada and Yoshida Citation2016). Head motion could also be indicative of postural (in)stability, where instability may be related to the development of motion sickness over time (Riccio and Stoffregen Citation1991).
Motion sickness:
Before the experiment:
(3) Motion sickness susceptibility: Participants’ individual motion sickness susceptibility in comparison to the general population was determined using the short version of the MSSQ (Golding Citation2006).
In both experiment sessions:
(4) Motion sickness scores: The time-course development of motion sickness was tracked on a 30-second interval using participants’ MISC scores throughout the 30-minute motion exposure and 15-minute recovery period.
At the end of both experiment sessions:
(5) Motion sickness symptoms: Symptoms experienced during the motion exposure or recovery period were checked using a dedicated motion sickness symptom checklist, including 24 commonly experienced symptoms. Symptom severity was rated on a 4-point ordinal scale from ‘none’ to ‘severe’.
Motion comfort:
At the end of both experiment sessions:
(6) Participants’ subjective motion comfort was inquired into through means of five-point Likert scale statements. The questionnaire explicitly instructed to solely judge the simulator motion, i.e. not considering, amongst others, visuals and sound.
Data analysis
From all motion anticipation and sickness measures, the analyses of the head motion measurements and the motion sickness scores require further explanation:
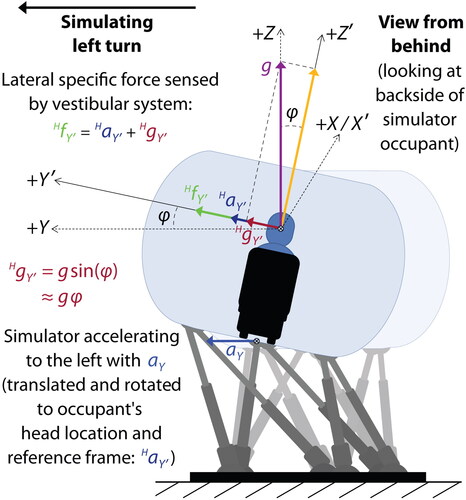
Head motion: To quantify potential differences between the two driving conditions in participants’ ability to anticipate the turn direction, the time delay between simulator lateral specific force at the location of the participant’s head and the participant’s lateral head displacement was estimated. Here, specific force is the resultant of translational acceleration and gravitational acceleration. Specific force was more relevant in this case than translational acceleration due to the applied tilt coordination. In tilt coordination, the gravity vector is traded for a perception of acceleration. The simulator lateral specific force acts in the horizontal plane of the simulator occupant’s head when the head is in upright position relative to the simulator cabin (see ).Footnote2
Figure 5. Sensed lateral specific force during a simulated vehicle left turn manoeuvre.
To be able to estimate the time delay between simulator specific force and head displacement, first, the head motion data were interpolated. Using Akima splines (Akima Citation1970), the sample rate was increased from 32 Hz to 100 Hz to match the sample rate of the simulator motion data. Then, for each of the 60 turn manoeuvres in the two conditions, simulator lateral specific force and participants’ head lateral displacement were extracted. For each individual participant and turn manoeuvre, the cross-correlation between the first-order differences of the simulator lateral specific force and the head lateral displacement was computed. First-order differences were taken to mitigate auto-correlations in the to-be-correlated time-series signals, as cross-correlations can indicate spurious relationships because of auto-correlation (Dean and Dunsmuir Citation2016). The time delay was estimated as the time shift with the largest absolute cross-correlation value. As a result of the sample rate, time delays were estimated with a resolution of 10 ms.
Motion sickness scores: To quantify the participant group’s motion sickness severity over time, a mean MISC score was calculated at each measurement time point by averaging the MISC scores of all participants at the respective time point. In case a motion exposure had been aborted prematurely, then for the remainder of the 30-minute exposure, a MISC score equal to the last score reported by the respective participant before termination of the motion was used in the calculation of the mean MISC scores. This ‘padding technique’ has been used in several previous motion sickness studies (e.g. Griffin and Newman Citation2004b; Irmak, Pool, and Happee Citation2021; Kuiper, Bos, and Diels Citation2018, Kuiper et al. Citation2020b) and results in a conservative calculation of the mean MISC score. It would have been more likely that with continuation of the motion exposure, the participant’s MISC scores would have further increased as opposed to decreased or remained constant.
Hypotheses
Three hypotheses were formulated for the current experiment:
H1: The repeating turn direction pattern in Condition R will be consciously recognised. Based on pre-experimental tests in the simulator, it was expected that a repeating turn direction pattern of three right turns, followed by three left turns would be sufficiently simple for participants to recognise. As a result, Condition R was expected to be perceived as predictable.
H2: Repeating turn directions lead to a reduced lag between lateral simulator motion and lateral head movement compared to pseudo-randomly ordered turn directions in simulated car driving. During curve driving, drivers tend to tilt their head into the curve with the movement onset at the same time as or just before the onset of the vehicle’s lateral acceleration (Fujisawa et al. Citation2009). On the contrary, passengers generally exhibit head tilt in the opposite direction with some delay compared to the vehicle’s lateral acceleration (Wada, Fujisawa, and Doi Citation2018, Wada et al. Citation2012). At the same time, drivers have an enhanced ability to anticipate upcoming motion compared to passengers (Rolnick and Lubow Citation1991). As more predictable fore-aft motion has already been suggested to increase motion anticipation (Kuiper et al. Citation2020b), and as, following Hypothesis H1, Condition R was expected to be perceived as predictable, it was hypothesised that the repeating turn directions in Condition R would lead to a reduced lag between simulator motion and head movement as a result of increased motion anticipation.
H3: Repeating turn directions lead to lower levels of motion sickness compared to pseudo-randomly ordered turn directions in simulated car driving. Directionally predictable fore-aft motion has previously been shown to provoke less motion sickness compared to directionally unpredictable fore-aft motion (Kuiper et al. Citation2020b). It was expected that this finding could be extrapolated to multi-degree-of-freedom simulated vehicle motion, in which motion in one degree of freedom, i.e. the turn or yaw direction, is varied in its level of repetition, while the motion in the other degrees of freedom is kept consistent. Here, consistent means that the fixed-degree turns are always preceded by the same braking manoeuvre and always followed by the same acceleration manoeuvre. Also, the time interval between consecutive manoeuvre sequences is kept constant. Lower levels of motion sickness were expected to become visible through lower MISC scores, less reporting of motion sickness symptoms and higher subjective motion comfort ratings.
Results
Perceived motion predictability
The perceived motion predictability was inquired into through means of a questionnaire at the end of the second experiment session. The predictability was assessed in a three-step process:
1. Ability to distinguish the direction of simulator motion
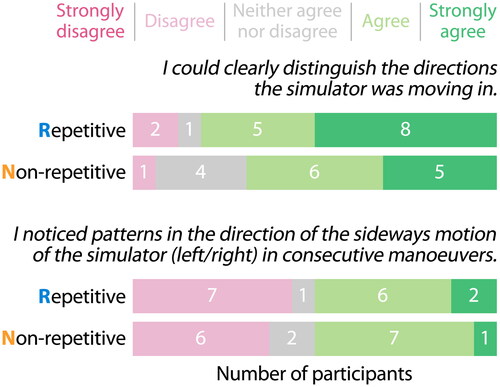
As a prerequisite for being able to recognise the repeating turn direction pattern in Condition R, participants should, first of all, have been able to clearly distinguish the simulator motion directions. The questionnaire therefore requested participants to indicate to what extent they were able to do so in the two separate sessions by replying to two identical five-point Likert scale statements. Participants’ responses are shown at the top of . Only the responses of sixteen out of the twenty participants are presented. These are the same as those included for the statement shown at the bottom of (see Step 2), which had been added to the questionnaire after the first four participants had already finished the experiment. Of these sixteen participants, seven belonged to Group R→N, and the other nine to Group N→R. The majority of the participants indicated that they could clearly distinguish the directions of simulator movement.
Figure 6. Participants’ responses on perceived simulator motion.
2. Recognition of a pattern in the direction of the sideways motion of the simulator
The next step was to assess whether participants had consciously noticed that Condition R contained a repeating turn direction pattern, whereas Condition N did not. For that reason, the questionnaire explicitly inquired – again through means of two identical Likert scale statements – whether participants had noticed any patterns in the direction of the sideways motion of the simulator in consecutive manoeuvres in the two sessions. Participants’ responses are shown at the bottom of . No clear difference exists between the responses concerning Conditions R and N. In both conditions, the number of ‘agrees’ was similar to the number of ‘disagrees’. In six out of the eight instances in which participants had either disagreed with or responded neutrally to the statement inquiring whether they could clearly distinguish the directions of simulator movement (Step 1 and top of ), the participants had also indicated that they had not noticed any patterns in the direction of the sideways motion of the simulator (bottom of ). In the other two instances, in which Participants 10 and 15 had responded neutrally to the statement inquiring whether they could clearly distinguish the simulator motion directions in Condition N (top of ), they had still agreed with the statement that they had noticed patterns in the direction of the sideways motion of the simulator in this condition (bottom of ).
3. Description of the recognised pattern in the direction of the sideways motion of the simulator
Finally, when participants (strongly) agreed with the sideways motion pattern statement (bottom of ), they were subsequently asked in an open question to write down the pattern(s) they had noticed in the simulator’s sideways motion directions as specifically as possible. In the above two instances (Participants 10 and 15) of Condition N (see Step 2), Participant 10 described a ‘pattern’ that did not describe the sideways motion of consecutive manoeuvres, and Participant 15 mentioned that the simulator had moved left multiple times in a row, or right multiple times in a row. It is worth mentioning that Participant 15 had first performed Condition N, and then Condition R. In Condition N, they had observed a pattern, while, in reality, it did not contain a consistent pattern. In Condition R, they had not noticed a pattern, despite this condition containing the repeating turn direction sequence. Furthermore, none of the participants who had indicated to have been able to distinguish the directions of simulator motion and to have noticed patterns in the direction of the sideways motion of the simulator, were able to describe the repeating pattern in the sideways motion of Condition R. There was, however, one participant (Participant 3) who mentioned that it was more difficult to predict the sideways motion of the simulator in Condition N, because it changed more often than in Condition R. All in all, the similar responses for Conditions R and N implied that the difference in level of repetition in the direction of sideways motion of the simulator remained largely unnoticed by participants.
Head motion
From the twenty participants, the head motion data of five participants were excluded from analysis due to recording issues in one of the two conditions. As a result, the head motion analysis was performed with the data of fifteen participants. Eight belonged to Group R→N and the other seven to Group N→R.
shows the estimated time delay between the simulator lateral specific force and the participants’ head lateral displacement for all individual turn manoeuvres of the two conditions. The data are shown separately for the two condition order groups and have been clustered in bins of ten consecutive turn manoeuvres. However, throughout the motion exposures the head tracking system occasionally lost track of the participant’s head. This occurred, for example, due to interference or due to the participant actively rotating their head outside the field-of-view of the infrared camera, despite the instructions to minimise active head movements. As a result, some data are missing. Overall, in Group R→N 86% of the data points were accounted for in Condition R and 81% in Condition N. In Group N→R, these values equalled 86% and 92% for Conditions R and N, respectively.
Figure 7. Time delay between simulator lateral specific force and head lateral displacement in turn manoeuvres.
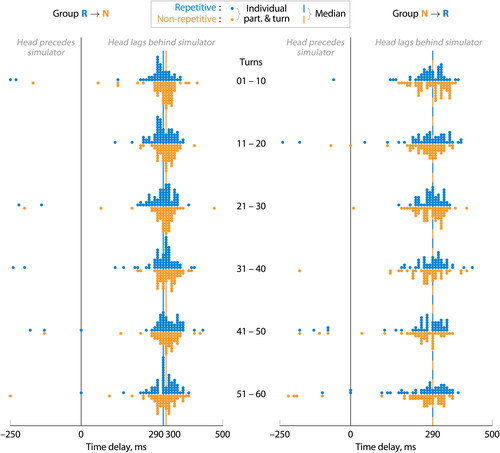
shows the estimated time delays that lie within a range of −250 ms, where the head movement precedes the simulator motion, and 500 ms, where the head displacement lags behind the simulator motion. This range allows for a detailed visualisation of the most dense segment of the time delay distribution. Overall, 11.8% of the data points lie outside this range. In Group R→N, these numbers are 8.0% and 5.4% for Conditions R and N, respectively. Somewhat larger numbers are obtained for Group N→R, 15.5% and 18.7% for Conditions R and N, respectively.
Estimated time delays were comparable between Conditions R and N for both condition order groups. In general, the head displacement seems to have lagged behind the simulator motion. Blue and orange vertical lines in indicate the medians of the estimated time delays of Conditions R and N, respectively. These equalled 290 ms and 300 ms for Group R→N and 290 ms in both conditions for Group N→R. The difference of 10 ms between Condition N of Group R→N and the other three, identical, values is equal to the time delay resolution. The mean is not used as a measure here, because it would be heavily influenced by outliers.
No substantial differences in time delay appear to have been present, neither between the two conditions, nor between condition order groups. The time delay also seems to have remained relatively constant throughout the two conditions (see ). Despite the fact that a difference in time delay was found at a p < 0.05 level between Conditions R and N for Group R→N, suggesting a somewhat smaller time delay in Condition R compared to Condition N, the effect size was small at an absolute value of 0.12. Similarly, a difference in time delay was found at a p < 0.05 level between the two condition order groups in Condition N, suggesting a smaller time delay for Group N→R compared to Group R→N. However, the effect size was again small at an absolute value of 0.12.
Table 3. Statistical results of between-condition, between-group and within-condition comparisons of the time delay between simulator lateral specific force and head lateral displacement in turn manoeuvres.
The correlation with the largest magnitude was a negative correlation in 93.4% and 92.1% of the turn manoeuvres in Conditions R and N, respectively. This indicates that in most instances participants’ head moved in the opposite lateral direction and with a time delay compared to the simulator. This, in turn, is consistent with passengers’ head movement observed in earlier car studies. Passengers’ head generally tilted towards the outside of the curve with a time delay compared to the vehicle’s lateral acceleration (Wada, Fujisawa, and Doi Citation2018, Wada et al. Citation2012; Zikovitz and Harris Citation1999). However, occasionally, head tilt in the opposite direction was observed (Wada, Fujisawa, and Doi Citation2018; Zikovitz and Harris Citation1999). These findings suggest that the experiment participants, analogous to vehicle passengers, exhibited passive head movement due to the head’s inertia.
MISC scores
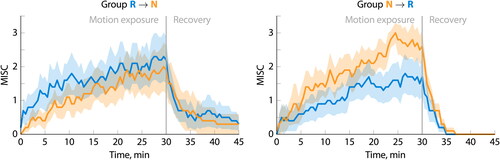
shows the development of the mean MISC score and the corresponding Standard Error of the Mean (SEM) throughout the motion exposure and recovery period for both driving conditions. Apart from a slightly higher development rate at the start of the motion exposure for Condition R, the mean MISC scores developed similarly in both conditions throughout the first 20 minutes. Only in the final 10 minutes of the motion exposure, the mean MISC score of Condition R increased more gradually, and thus less, compared to that of Condition N. This resulted in a somewhat lower final score for Condition R. After 30 minutes, the mean MISC score was 1.95 (SEM = 0.44) for Condition R, compared to 2.25 (SEM = 0.42) for Condition N. A Wilcoxon signed-rank test confirmed, however, that there was no statistically significant difference between the MISC scores of the two conditions at the end of the motion exposure (Z = −0.963, p = 0.336, r = 0.22).
Figure 8. Time-course development of MISC scores averaged over all participants.
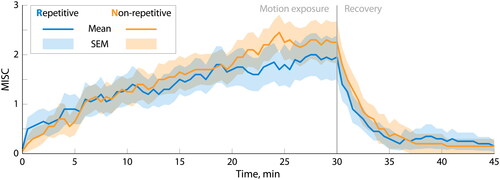
For a single participant, the motion exposure was aborted prematurely in Condition R after 28 minutes due to their reported MISC score exceeding the predefined cut-off level. No motion exposures had been terminated prematurely for Condition N. Immediately after the motion had ended, MISC scores decreased almost exponentially for both conditions. Within five minutes, the mean MISC scores had dropped to a level that had already been reached within the first two minutes of the motion exposure. This indicates that the recovery rate was much higher than the motion sickness growth rate over the greater part of the motion exposure.
shows the MISC score development of the two condition order groups that performed the conditions in opposite order. A clear order effect can be observed, with higher mean MISC scores in the condition that was performed first. However, the order effect seemed more pronounced for Group N→R, that first performed Condition N and then Condition R, than for Group R→N. At the end of the motion exposure, Group R→N obtained mean MISC scores of 2.20 (SEM = 0.70) and 1.90 (SEM = 0.72) for Conditions R and N, respectively. On the other hand, the mean MISC scores for Group N→R were 1.70 (SEM = 0.58) and 2.60 (SEM = 0.45) for Conditions R and N, respectively. Wilcoxon-signed rank tests confirmed, however, that there were no statistically significant differences between the MISC scores of the two conditions at the end of the motion exposure for Group R→N (Z = −0.172, p = 0.863, r = 0.05) or for Group N→R (Z = −1.549, p = 0.121, r = 0.49).
Figure 9. Time-course development of MISC scores averaged over the separate condition order groups.
Motion sickness symptoms
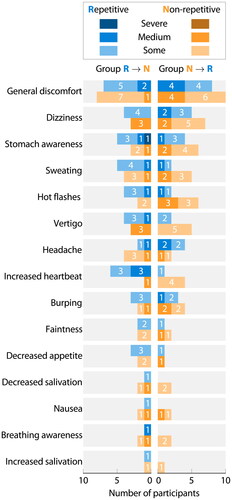
shows the occurrence of motion sickness symptoms for both driving conditions, separately for the two condition order groups. For each symptom, the number of participants having experienced that symptom to some, a medium or a severe extent are shown. In line with the MISC scores, a moderate order effect can be observed. For symptoms experienced by at least five out of the twenty participants in both conditions, in Group R→N slightly more participants seemed to have exhibited these symptoms in Condition R compared to Condition N, whereas in Group N→R more participants reported to have experienced these symptoms in Condition N than in Condition R. The only exceptions to this are general discomfort and headache. Again, in accordance with the MISC scores, the differences between the two conditions were larger in Group N→R compared to Group R→N. However, overall, Condition N appeared only slightly more provocative in terms of the occurrence of motion sickness symptoms compared to Condition R. Thirteen out of fifteen symptoms in were experienced by the same or a slightly larger number of participants, with a maximum difference of three, in Condition N compared to Condition R.
Figure 10. Occurrence of motion sickness symptoms throughout or right after motion exposure.
Subjective motion comfort
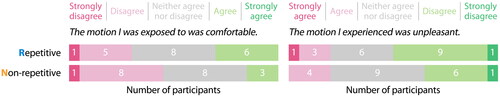
shows the participants’ responses to two comfort statements. As these statements are contradictory by design, their Likert scales are presented in opposite order and colours. For both statements, the responses on the left side in pink correspond to less comfort, whereas the responses on the right side in green correspond to more comfort. The Spearman-Brown coefficients for the two comfort items are 0.813 and 0.730 for Conditions R and N, respectively, indicating acceptable consistency.Footnote3 In line with the slightly favourable results for Condition R in terms of both MISC scores and motion sickness symptoms, more participants agreed and less participants disagreed with the statement that the motion they were exposed to was comfortable for Condition R compared to Condition N. Equivalently, more participants disagreed with the statement that the motion they had experienced was unpleasant for Condition R compared to Condition N. Despite the fact that, overall, the majority of the participants were either neutral about the motion comfort/unpleasantness or tended more towards the motion being uncomfortable/unpleasant, both statements still indicate that Condition R was somewhat more favoured than Condition N. Wilcoxon signed-rank tests confirmed, however, that there were no statistically significant differences between the two conditions in motion comfort (Z = −1.732, p = 0.083, r = 0.39) or motion unpleasantness (Z = −0.632, p = 0.527, r = 0.14).
Figure 11. Participants’ responses on subjective motion comfort.
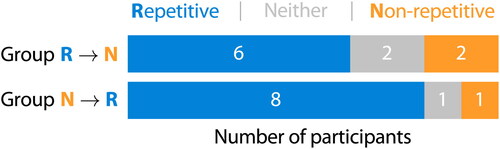
As opposed to the above indirect comparison between the two conditions on motion comfort, at the end of the second experiment session, participants were requested to explicitly indicate during which sessionFootnote4 the motion had been more comfortable. Their responses are shown in . Fourteen out of the twenty participants subjectively favoured Condition R in terms of motion comfort. However, the number was slightly smaller in Group R→N, having performed Condition R in the first session, compared to Group N→R, having experienced Condition R in the second session.
Figure 12. Participants’ self-reported preference for driving condition.
Discussion
Previous research has demonstrated that fore-aft motion predictable in both direction and timing triggers less motion sickness compared to fore-aft motion unpredictable in either direction or timing (Kuiper et al. Citation2020b). The current study aimed to take a first step in investigating to what extent this finding can be leveraged to mitigate the increased risk of motion sickness in automated vehicles. Specifically, this research investigated how only varying the level of repetition in the turn directions affects perceived motion predictability and motion sickness development throughout a drive with vehicle braking, turning and accelerating at consistent intervals. In a simulator experiment with twenty participants, a repetitive (R) turn direction condition was compared with a pseudo-randomly ordered or non-repetitive (N) turn direction condition.
It was hypothesised that the repeating turn direction pattern in Condition R of three right turns, followed by three left turns, was sufficiently simple for participants to recognise. However, in fact, when requested at the end of the second experiment session to describe any pattern(s) noticed in the direction of sideways motion of the simulator in consecutive manoeuvres, none of the participants were able to write down the repeating pattern contained in Condition R. Therefore, Hypothesis H1 was rejected.
Additionally, it was hypothesised that the repeating turn direction pattern would reduce the time delay between lateral simulator motion and head movement compared to the pseudo-randomly ordered turn directions. This expectation was based on two notions. First, drivers typically tilt their head in the direction of a curve at the moment of or slightly before starting to negotiate the curve, whereas passengers usually exhibit passive head tilt in the opposite direction with some time delay (Dong, Yoshida, and Stoffregen Citation2011; Fujisawa et al. Citation2009; Rolnick and Lubow Citation1991; Wada, Fujisawa, and Doi Citation2018; Zikovitz and Harris Citation1999). At the same time, drivers have an increased ability to anticipate upcoming motion compared to passengers (Rolnick and Lubow Citation1991). Second, more predictable motion has been suggested to increase motion anticipation (Kuiper et al. Citation2020b), and, following Hypothesis H1, Condition R was expected to be perceived as predictable due to its repeating turn direction pattern. Nonetheless, this study found no appreciable differences in time delay between the two conditions. Moreover, in both conditions, participants’ head (passively) moved towards the outside of the simulated turn in most instances, similar to the head movement of vehicle passengers. Therefore, Hypothesis H2 could not be confirmed.
Contrary to expectations, this study found no statistically significant differences in motion sickness between Conditions R and N. In fact, the condition performed in the first experiment session often led to higher motion sickness scores and more or worse motion sickness symptoms compared to the condition of the second session, independent of which condition was performed first. Still, the reduction in motion sickness scores from the first to the second session was somewhat smaller when first performing Condition R and then Condition N, than when experiencing the conditions in the opposite order. The same held for the reduction in the number and intensity of reported motion sickness symptoms. Also, participants seemed to somewhat favour Condition R over Condition N in terms of motion comfort, though differences were not statistically significant. Hence, only small differences in motion sickness and comfort were observed in favour of Condition R, but no conclusive evidence was found. As a result, Hypothesis H3, predicting lower levels of motion sickness in Condition R, could also not be confirmed.
One important factor that may have contributed to the similar levels of motion sickness in the two conditions could be the lack of an enhanced ability to anticipate the turn directions in Condition R compared to Condition N. This lack was illustrated by the fact that none of the participants reported having recognised the repeating turn direction pattern, as well as by the above-mentioned comparable head movement in the two conditions. As a result, the belief that better motion anticipation reduces motion sickness might not have been leveraged.
Apart from serving as supporting evidence for the lack of improved motion anticipation, the comparable head movement could also be considered as the second factor worthy of separate mention that potentially contributed to the similar results in Conditions R and N. Previous research has shown that when passengers actively mimicked the head motion strategy of drivers, motion sickness was alleviated (Wada et al. Citation2012; Wada and Yoshida Citation2016). This might suggest that the direction of head movement directly influences motion sickness development.
A third factor that may have contributed to the conditions’ comparable levels of motion sickness is the simulator occupants’ seat belt. The SRS is equipped with a pilot seat with a five-point harness, which restricts both longitudinal and lateral body and head movement more than the typical three-point safety belt in cars. Whereas previous research has found no significant differences in motion sickness between conditions with and without active seat belt retractions in a simulator-based driving study (Kremer et al. Citation2022), the notion that seat belts might aid in mitigating motion sickness cannot be rejected yet. In fact, the previous study concluded that the seat belt retractions did not limit head movement, but rather increased its overall magnitude. In fact, an earlier study has demonstrated that a specially designed headrest that effectively reduced occupants’ low-frequency head motion also reduced motion sickness compared to a normal headrest (Kato, Suzuki, and Honda Citation2021). Moreover, Mills and Griffin (Citation2000) experimentally investigated the influence of upper body restraint during both longitudinal and lateral oscillatory motion. It was observed that less motion sickness was experienced with a high backrest with a four-point harness compared to a low backrest with a loose lap belt. The latter allowed more upper body and head movement, especially during longitudinal motion. In the current experiment, it was, however, not possible to use only some of the seat belt straps with the objective to better simulate the body and head movement restrictions of a conventional car seat belt, as the safety features of the simulator’s motion system do not allow this.
A final important factor that should be mentioned when discussing the similar levels of motion sickness in the two conditions, is the combination of the used motion conditions and the participant group. The observed MISC scores, which averaged around 2 at the end of the motion exposures, indicated a relatively low level of motion sickness. This could suggest that the above combination may not have allowed for detection of the motion sickness mitigation potential of a repeating, and hence potentially predictable, motion condition. Here, three aspects are worthy of mention.
First, the motion conditions might not have been sufficiently provocative for the current participant group. To reduce the risk of this happening, driving conditions with more intense accelerations could, of course, have been designed. However, these driving conditions would then likely have been less representative of the motion that can be expected from automated driving. Also, even when more intense driving conditions would have been designed, the actual experiment conditions might still not have been more provocative than the current conditions, as the translation of vehicle motion to simulator motion is limited by the fixed simulator motion space. Moreover, longer-lasting motion conditions to allow for more motion sickness might also not have been desirable, as this would have increased the chances of boredom and fatigue in participants. This could, in turn, have had an undesirable effect on motion sickness and comfort levels.
Second, the number of participants may have been too small to detect an effect with the current motion conditions. A power analysis (Faul et al. Citation2007) revealed that to detect medium effects (an effect size dz of 0.5 for a two-tailed Wilcoxon signed-rank test according to Cohen’s (Citation1988) criteria) with an alpha of 0.05 and a recommended power of 0.80 (Cohen Citation1988), a minimum number of 35 participants is required. In the current research, a larger number of participants would have been challenging due to COVID-19 restrictions on the use of the simulator.
Third, in motion sickness research, the individual participants might be just as important as the number of participants due to the great variability in motion sickness susceptibility among individuals (e.g. Mittelstaedt Citation2020). The participants’ MSSQ-short scores in the current experiment suggested that, overall, the susceptibility of the participants was somewhat below the average of the general population. To increase the chances of observing motion sickness, and, in turn, also larger differences between conditions, if such differences exist, one might like to have participants with higher motion sickness susceptibility. These are, of course, also the individuals for whom this research is of most importance. However, it is the authors’ experience that highly susceptible individuals are reluctant to participate in motion sickness experiments. Also, more susceptible individuals that do participate, are not always able to perform all conditions due to severe motion sickness. As a result, their partial data set can often not be included in the analysis.
As mentioned earlier, a noteworthy order effect was observed in participants’ motion sickness scores and reported symptoms, with higher motion sickness levels in the condition that was performed first. This result is in line with previous research and may indicate habituation. For example, in a simulator experiment in which participants were repeatedly exposed to the same vertical sinusoidal motion on consecutive days, the number of individuals vomiting decreased by approximately 25% on the second day compared to the first (McCauley et al. Citation1976). However, not only prior exposure to the motion leads to less motion sickness at a subsequent occasion. Already being familiar with the entire testing procedure might also contribute to a reduction (McCauley et al. Citation1976).
One might also argue that the reduction in motion sickness throughout repeated exposures could, in part, actually be due to an improved ability to anticipate upcoming motion. Despite no signs of increased anticipation in terms of the direction of sideways motion of the simulator in Condition R, motion anticipation could have been promoted by the consistent manoeuvre combinations applied in the two conditions. Both conditions consisted of repeated braking-turning-accelerating manoeuvre combinations with consistent timing and intensity. This could potentially have enhanced participants’ motion anticipation throughout ‘repeated exposures’ to this combination, and thereby, have alleviated motion sickness more in the second session. Even though the earlier-mentioned fore-aft motion study found comparable levels of motion sickness for the directionally unpredictable condition and the temporally unpredictable condition (Kuiper et al. Citation2020b), this does not rule out the possibility that motion predictable in one ‘dimension’, either direction or timing, but unpredictable in the other, may still have a mitigating effect compared to motion unpredictable in both direction and timing. A condition unpredictable in both direction and timing had not been evaluated in this earlier study.
Still, the fixed time interval between subsequent manoeuvre sequences was also directly one of the current study’s limitations. Only the influence of directional predictability on motion sickness development was explored, but not that of temporal predictability. However, the earlier fore-aft motion study has clearly showed that eliminating temporal consistency can result in more motion sickness (Kuiper et al. Citation2020b). Nonetheless, it might still be that the increased familiarity with the testing procedures and simulator environment had a larger contribution to the current study’s motion sickness reduction in the second session than the above-described motion and timing consistency.
Another aspect to consider as a study limitation was the omission of dynamic visuals of the road and its surroundings in the participants’ (peripheral) field of view. This was a well-considered choice to prevent visual motion anticipation and to reduce the likelihood of (severe) simulator sickness (see Apparatus). However, although occupants in automated vehicles will probably not maintain a view on the road ahead anymore, they might still receive optic flow from the outside world in their visual periphery. Previous research has shown that peripheral vision through a car’s side windows, without a forward outside view, still reduces motion sickness compared to having no outside view at all (Griffin and Newman Citation2004b). Additionally, displays positioned at eye height, allowing front-seat passengers a better peripheral outside view, have been shown to reduce motion sickness compared to displays placed at lower heights (Diels et al. Citation2016; Kuiper, Bos, and Diels Citation2018). Here, it must be noted, however, that when comparing displays at different heights, in addition to the difference in peripheral visuals, a potential difference in participants’ head orientation may also affect the level of motion sickness.
The differential motion sickness findings between the fore-aft motion study of Kuiper et al. (Citation2020b) and the current study could potentially in part be explained by the difference in ecological validity of the used motion profiles in the context of road vehicle motion. Here, ecological validity refers to the extent to which the profiles approximate real-world vehicle motion. Even though Kuiper et al. (Citation2020b) purposefully investigated the influence of motion anticipation in simple fore-aft motion, it could be argued that the mitigating effect of objectively predictable motion on motion sickness diminishes as the ecological validity of the motion increases. First, the braking-turning-accelerating manoeuvre combinations used in the current experiment might have obscured differences in predictability that exist only in the direction of the turns. Second, the duration of the repeating motion pattern in the current study, that makes the motion objectively predictable, might have been too long for effective learning and memorisation of the pattern. This could, in turn, have inhibited motion anticipation, thereby nullifying the mitigating effect of motion predictability on motion sickness. The repeating pattern in Condition R, consisting of three right turns, followed by three left turns, lasted a total of 180 seconds. It was thus only repeated ten times in a single 30-minute driving condition. In contrast, the repeating pattern in the fully predictable condition of the fore-aft motion study consisted of a single fore-aft manoeuvre and lasted including time interval till the next manoeuvre a total of 16 seconds. Hence, it was repeated approximately 56 times in the 15-minute motion condition. Here, it must, however, also be mentioned that the current study’s driving conditions were motion filtered to remain within the simulator’s motion space. As a result, the simulator motion conditions consisted of considerably smaller translational displacements than those applied in the study of Kuiper et al. (Citation2020b), and also incorporated tilt coordination. Despite efforts made to minimise false motion cues as a result of tilt coordination, it may still be that both the smaller displacements and the tilt coordination have also contributed to the two studies’ differential findings.
Still, in light of the above-described gap in ecological validity of the motion as well as the differential motion sickness findings of the two experiments, future research should focus on the cognitive processing of motion predictability, and its consequent effect on motion sickness, for different degrees of ecological validity in the context of road vehicle motion. It will be essential to not only investigate the interaction effects of motion (un)predictability in increasingly more degrees of freedom, but also how that interacts with the duration of predictable motion patterns. Doing so will lead to an increased understanding of the relation between objective motion predictability and humans’ abilities and characteristics of motion anticipation. This could, in turn, aid in identifying strategies to mitigate motion sickness in automated vehicles.
Conclusion
Automated vehicles could put occupants at a higher risk of motion sickness as occupants lack control over the vehicle’s motion and do not maintain a view on the road ahead anymore. This study aimed to investigate the influence of motion predictability on motion sickness development in automated vehicles. In a simulator-based study, twenty participants experienced two ‘fully automated driving’ conditions, only varying in the level of repetition in the turn directions. The repetitive condition featured a repeating turn direction pattern of three right turns, followed by three left turns. The non-repetitive condition contained turn directions in pseudo-random order. No significant differences were found between the conditions, neither in sickness ratings, nor in perceived motion predictability or lag between simulator motion and head motion. The latter had been assessed as a metric for motion anticipation in response to the level of repetition in the turn directions.
These findings suggest no increased motion anticipation in the repetitive condition. The general belief that better motion anticipation reduces motion sickness might thus not have been leveraged. It could perhaps be that the ability to recognise a repeating pattern in a single degree of freedom, such as vehicle turn direction, is diminished when it is part of more complex motion, such as a combination of vehicle braking, turning and accelerating. This ability might be hindered further with increasing duration of the repeating motion pattern. Future research should focus on the interaction effects of motion (un)predictability in increasingly more degrees of freedom, and how that interacts with the duration of predictable motion patterns. This could aid in identifying strategies to mitigate motion sickness in automated vehicles.
Disclosure statement
The authors have no potential conflicts of interest to declare. This article is based on the experiment described in Englebert’s master thesis (Citation2022), but contains new analyses of the data and additional discussions.
Additional information
Funding
Notes
1. https://www.trackir.com/ (accessed July 3, 2024).
2. Specific force can also be defined as f = a – g. In that case, the gravity vector g is drawn downwards, as that is the direction in which gravity pulls. However, the gravitational pull induces an upward reactionary force on the body part that is in contact with the surface underneath. This force is the same as that occurring during acceleration in the positive Z-direction, as defined in . Therefore, it was decided to draw the gravity vector upwards instead.
3. Internal consistencies were computed using Spearman-Brown coefficients because of the two-item nature of the comfort measure (Eisinga, Te Grotenhuis, and Pelzer Citation2013).
4. All questionnaires referred to the two conditions as the first and the second experiment session of the respective participant, and not as the repetitive and non-repetitive condition.
References
- Akçelik, R., and D. C. Biggs. 1987. “Acceleration Profile Models for Vehicles in Road Traffic.” Transportation Science 21 (1): 36–54. doi:10.1287/trsc.21.1.36.
- Akima, H. 1970. “A New Method of Interpolation and Smooth Curve Fitting Based on Local Procedures.” Journal of the ACM 17 (4): 589–602. doi:10.1145/321607.321609.
- American Association of State Highway and Transportation Officials. 2018. A Policy on Geometric Design of Highways and Streets. 7th ed. Washington, DC: AASHTO.
- Barendswaard, S., D. M. Pool, E. R. Boer, and D. A. Abbink. 2019. “A Classification Method for Driver Trajectories during Curve-Negotiation.” Proceedings of the 2019 IEEE International Conference on Systems, Man, and Cybernetics (SMC), Bari, Italy, 3729–3734. doi:10.1109/SMC.2019.8914301.
- Bohrmann, D., A. Bruder, and K. Bengler. 2022. “Effects of Dynamic Visual Stimuli on the Development of Carsickness in Real Driving.” IEEE Transactions on Intelligent Transportation Systems 23 (5): 4833–4842. doi:10.1109/TITS.2021.3128834.
- Bos, J. E., S. N. MacKinnon, and A. Patterson. 2005. “Motion Sickness Symptoms in a Ship Motion Simulator: Effects of Inside, Outside, and No View.” Aviation, Space, and Environmental Medicine 76 (12): 1111–1118.
- Bosetti, P., M. D. Lio, and A. Saroldi. 2014. “On the Human Control of Vehicles: An Experimental Study of Acceleration.” European Transport Research Review 6 (2): 157–170. doi:10.1007/s12544-013-0120-2.
- Cohen, J. 1988. Statistical Power Analysis for the Behavioral Sciences. 2nd ed. Mahway, NJ: Lawrence Erlbaum Associates.
- Dean, R. T., and W. T. M. Dunsmuir. 2016. “Dangers and Uses of Cross-Correlation in Analyzing Time Series in Perception, Performance, Movement, and Neuroscience: The Importance of Constructing Transfer Function Autoregressive Models.” Behavior Research Methods 48 (2): 783–802. doi:10.3758/s13428-015-0611-2.
- Diels, C., and J. E. Bos. 2016. “Self-Driving Carsickness.” Applied Ergonomics 53 (Part B): 374–382. doi:10.1016/j.apergo.2015.09.009.
- Diels, C., J. E. Bos, K. Hottelart, and P. Reilhac. 2016. “The Impact of Display Position on Motion Sickness in Automated Vehicles: An On-Road Study.” Poster presented at the Automated Vehicles Symposium, San Francisco, CA. doi:10.13140/RG.2.1.3696.4081.
- Dong, X., K. Yoshida, and T. A. Stoffregen. 2011. “Control of a Virtual Vehicle Influences Postural Activity and Motion Sickness.” Journal of Experimental Psychology: Applied 17 (2): 128–138. doi:10.1037/a0024097.
- Donohew, B. E., and M. J. Griffin. 2004. “Motion Sickness: Effect of the Frequency of Lateral Oscillation.” Aviation, Space, and Environmental Medicine 75 (8): 649–656.
- Eisinga, R., M. te Grotenhuis, and B. Pelzer. 2013. “The Reliability of a Two-Item Scale: Pearson, Cronbach, or Spearman-Brown?” International Journal of Public Health 58 (4): 637–642. doi:10.1007/s00038-012-0416-3.
- Englebert, B. J. V. 2022. “Evaluating the Influence of Motion Predictability on Motion Sickness in Automated Vehicles.” Unpublished MSc Thesis. Delft, The Netherlands: Faculty of Aerospace Engineering, Delft University of Technology.
- Faul, F., E. Erdfelder, A.-G. Lang, and A. Buchner. 2007. “G*Power 3: A Flexible Statistical Power Analysis Program for the Social, Behavioral, and Biomedical Sciences.” Behavior Research Methods 39 (2): 175–191. doi:10.3758/bf03193146.
- Feng, F., S. Bao, J. R. Sayer, C. Flannagan, M. Manser, and R. Wunderlich. 2017. “Can Vehicle Longitudinal Jerk Be Used to Identify Aggressive Drivers? An Examination using Naturalistic Driving Data.” Accident Analysis & Prevention 104: 125–136. doi:10.1016/j.aap.2017.04.012.
- Flynn, T. I., A. J. McAllister, C. Wilkinson, and G. P. Siegmund. 2021. “Typical Acceleration Profiles for Left-Turn Maneuvers Based on SHRP2 Naturalistic Driving Data.” SAE Technical Paper 2021-01-0889. Proceedings of the SAE WCX Digital Summit. doi:10.4271/2021-01-0889.
- Fujisawa, S., T. Wada, N. Kamiji, and S. Doi. 2009. “Analysis of Head Tilt Strategy of Car Drivers.” Proceedings of the Annual Conference of the Society of Instrument and Control Engineers, Fukuoka, Japan, 4161–4165.
- Fukuda, T. 1976. “Postural Behaviour and Motion Sickness.” Acta Oto-Laryngologica 81 (3–6): 237–241. doi:10.3109/00016487609119955.
- Golding, J. F. 2006. “Predicting Individual Differences in Motion Sickness Susceptibility by Questionnaire.” Personality and Individual Differences 41 (2): 237–248. doi:10.1016/j.paid.2006.01.012.
- Golding, J. F., W. Bles, J. E. Bos, T. Haynes, and M. A. Gresty. 2003. “Motion Sickness and Tilts of the Inertial Force Environment: Active Suspension Systems vs. Active Passengers.” Aviation, Space, and Environmental Medicine 74 (3): 220–227.
- Griffin, M. J., and M. M. Newman. 2004a. “An Experimental Study of Low-Frequency Motion in Cars.” Proceedings of the Institution of Mechanical Engineers, Part D: Journal of Automobile Engineering 218 (11): 1231–1238. doi:10.1243/0954407042580093.
- Griffin, M. J., and M. M. Newman. 2004b. “Visual Field Effects on Motion Sickness in Cars.” Aviation, Space, and Environmental Medicine 75 (9): 739–748.
- Groen, E. L., and W. Bles. 2004. “How to Use Body Tilt for the Simulation of Linear Self Motion.” Journal of Vestibular Research 14 (5): 375–385. doi:10.3233/VES-2004-14503.
- Hainich, R., U. Drewitz, K. Ihme, J. Lauermann, M. Niedling, and M. Oehl. 2021. “Evaluation of a Human–Machine Interface for Motion Sickness Mitigation Utilizing Anticipatory Ambient Light Cues in a Realistic Automated Driving Setting.” Information 12 (4): 176. doi:10.3390/info12040176.
- Heerspink, H. M., W. R. Berkouwer, O. Stroosma, M. M. van Paassen, M. Mulder, and J. A. Mulder. 2005. “Evaluation of Vestibular Thresholds for Motion Detection in the SIMONA Research Simulator.” Paper No. AIAA-2005-6502. Proceedings of the AIAA Modeling and Simulation Technologies Conference, San Francisco, CA. doi:10.2514/6.2005-6502.
- Irmak, T., D. M. Pool, and R. Happee. 2021. “Objective and Subjective Responses to Motion Sickness: The Group and the Individual.” Experimental Brain Research 239 (2): 515–531. doi:10.1007/s00221-020-05986-6.
- Jones, M. L. H., V. C. Le, S. M. Ebert, K. H. Sienko, M. P. Reed, and J. R. Sayer. 2019. “Motion Sickness in Passenger Vehicles during Test Track Operations.” Ergonomics 62 (10): 1357–1371. doi:10.1080/00140139.2019.1632938.
- Karjanto, J., N. Md. Yusof, C. Wang, J. M. B. Terken, F. L. M. Delbressine, and G. W. M. Rauterberg. 2018. “The Effect of Peripheral Visual Feedforward System in Enhancing Situation Awareness and Mitigating Motion Sickness in Fully Automated Driving.” Transportation Research Part F: Traffic Psychology and Behaviour 58: 678–692. doi:10.1016/j.trf.2018.06.046.
- Karjanto, J., N. Md. Yusof, J. M. B. Terken, F. L. M. Delbressine, M. Z. Hassan, and G. W. M. Rauterberg. 2016. “Simulating Autonomous Driving Styles: Accelerations for Three Road Profiles.” Proceedings of the 2nd International Conference on Automotive Innovation and Green Vehicle (AiGEV 2016), Cyberjaya, Selangor, Malaysia. doi:10.1051/matecconf/20179001005.
- Kato, K., K. Suzuki, and C. Honda. 2021. “Reduction of Carsickness using a Headrest with Support to Suppress Head Motion.” Proceedings of the 3rd International Comfort Congress, Nottingham, United Kingdom, 123–128.
- Kennedy, R. S., K. M. Stanney, and W. P. Dunlap. 2000. “Duration and Exposure to Virtual Environments: Sickness Curves during and across Sessions.” Presence: Teleoperators and Virtual Environments 9 (5): 463–472. doi:10.1162/105474600566952.
- Kim, J., S.-M. Lee, H. Son, and T. Park. 2023. “Effects of Unlimited Angular Motion Cue and Cue Discrepancy on Simulator Sickness.” Expert Systems with Applications 213 (Part C): 119196. doi:10.1016/j.eswa.2022.119196.
- Kremer, C., M. Tomzig, N. Merkel, and A. Neukum. 2022. “Using Active Seat Belt Retractions to Mitigate Motion Sickness in Automated Driving.” Vehicles 4 (3): 825–842. doi:10.3390/vehicles4030046.
- Kuiper, O. X., J. E. Bos, and C. Diels. 2018. “Looking Forward: In-Vehicle Auxiliary Display Positioning Affects Carsickness.” Applied Ergonomics 68: 169–175. doi:10.1016/j.apergo.2017.11.002.
- Kuiper, O. X., J. E. Bos, C. Diels, and E. A. Schmidt. 2020a. “Knowing What’s Coming: Anticipatory Audio Cues Can Mitigate Motion Sickness.” Applied Ergonomics 85: 103068. doi:10.1016/j.apergo.2020.103068.
- Kuiper, O. X., J. E. Bos, E. A. Schmidt, C. Diels, and S. Wolter. 2020b. “Knowing What’s Coming: Unpredictable Motion Causes More Motion Sickness.” Human Factors 62 (8): 1339–1348. doi:10.1177/0018720819876139.
- Li, D., and L. Chen. 2022. “Mitigating Motion Sickness in Automated Vehicles with Vibration Cue System.” Ergonomics 65 (10): 1313–1325. doi:10.1080/00140139.2022.2028902.
- Maculewicz, J., P. Larsson, and J. Fagerlönn. 2021. “Intuitive and Subtle Motion-Anticipatory Auditory Cues Reduce Motion Sickness in Self-Driving Cars.” International Journal of Human Factors and Ergonomics 8 (4): 370–392. doi:10.1504/IJHFE.2021.119053.
- McCauley, M. E., J. W. Royal, C. D. Wylie, J. F. O’Hanlon, and R. R. Mackie. 1976. Motion Sickness Incidence: Exploratory Studies of Habituation, Pitch and Roll, and the Refinement of a Mathematical Model. Technical Report 1733-2. Goleta, CA: Human Factors Research, Inc.
- Mills, K. L., and M. J. Griffin. 2000. “Effect of Seating, Vision and Direction of Horizontal Oscillation on Motion Sickness.” Aviation, Space, and Environmental Medicine 71 (10): 996–1002.
- Mittelstaedt, J. M. 2020. “Individual Predictors of the Susceptibility for Motion-Related Sickness: A Systematic Review.” Journal of Vestibular Research 30 (3): 165–193. doi:10.3233/VES-200702.
- Probst, T., S. Krafczyk, W. Büchele, and T. Brandt. 1982. “Visuelle Prävention der Bewegungskrankheit im Auto [Visual Prevention of Motion Sickness in Cars].” Archiv für Psychiatrie und Nervenkrankheiten 231: 409–421. doi:10.1007/BF00342721.
- Reason, J. T., and J. J. Brand. 1975. Motion Sickness. Cambridge, MA: Academic Press.
- Reid, L. D., and M. A. Nahon. 1985. Flight Simulation Motion-Base Drive Algorithms: Part I – Developing and Testing the Equations. UTIAS Report No. 296. Toronto, ON, Canada: University of Toronto Institute for Aerospace Studies.
- Ren, X., H. Zhang, X. Wang, W. Zhang, and W. Yu. 2023. “Quantification and Pictorial Expression of Driving Status Domain Boundaries for Autonomous Vehicles in LTAP/OD Scenarios.” World Electric Vehicle Journal 14 (7): 187. doi:10.3390/wevj14070187.
- Reuten, A. J. C., S. A. E. Nooij, J. E. Bos, and J. B. J.Smeets. 2021. “How Feelings of Unpleasantness Develop during the Progression of Motion Sickness Symptoms.” Experimental Brain Research 239 (12): 3615–3624. doi:10.1007/s00221-021-06226-1.
- Reuten, A. J. C., J. B. J. Smeets, J. Rausch, M. H. Martens, E. A. Schmidt, and J. E. Bos. 2023. “The (In)effectiveness of Anticipatory Vibrotactile Cues in Mitigating Motion Sickness.” Experimental Brain Research 241 (5): 1251–1261. doi:10.1007/s00221-023-06596-8.
- Riccio, G. E., and T. A. Stoffregen. 1991. “An Ecological Theory of Motion Sickness and Postural Instability.” Ecological Psychology 3 (3): 195–240. doi:10.1207/s15326969eco0303_2.
- Rolnick, A., and R. E. Lubow. 1991. “Why Is the Driver Rarely Motion Sick? The Role of Controllability in Motion Sickness.” Ergonomics 34 (7): 867–879. doi:10.1080/00140139108964831.
- Siddiqi, M. R., A. Saharkhiz, S. Milani, C. Fu, R. N. Jazar, and H. Marzbani. 2022. “Analysis for Comfortable Handling and Motion Sickness Minimization in Autonomous Vehicles using Ergonomic Path Planning with Cost Function Evaluation.” SAE International Journal of Connected and Automated Vehicles 5 (2): 147–163. doi:10.4271/12-05-02-0013.
- Stroosma, O., M. M. van Paassen, and M. Mulder. 2003. “Using the SIMONA Research Simulator for Human-Machine Interaction Research.” Paper No. AIAA-2003-5525. Proceedings of the AIAA Modeling and Simulation Technologies Conference and Exhibit, Austin, TX. doi:10.2514/6.2003-5525.
- Turner, M., and M. J. Griffin. 1999a. “Motion Sickness in Public Road Transport: Passenger Behaviour and Susceptibility.” Ergonomics 42 (3): 444–461. doi:10.1080/001401399185586.
- Turner, M., and M. J. Griffin. 1999b. “Motion Sickness in Public Road Transport: The Effect of Driver, Route and Vehicle.” Ergonomics 42 (12): 1646–1664. doi:10.1080/001401399184730.
- Wada, T. 2016. “Motion Sickness in Automated Vehicles.” In Advanced Vehicle Control. Proceedings of the 13th International Symposium on Advanced Vehicle Control (AVEC’16), Munich Germany, edited by Edelmann, J., Plöchl, M., and Pfeffer, P. E. London, United Kingdom: CRC Press.
- Wada, T., S. Fujisawa, and S. Doi. 2018. “Analysis of Driver’s Head Tilt using a Mathematical Model of Motion Sickness.” International Journal of Industrial Ergonomics 63: 89–97. doi:10.1016/j.ergon.2016.11.003.
- Wada, T., H. Konno, S. Fujisawa, and S. Doi. 2012. “Can Passengers’ Active Head Tilt Decrease the Severity of Carsickness? Effect of Head Tilt on Severity of Motion Sickness in a Lateral Acceleration Environment.” Human Factors 54 (2): 226–234. doi:10.1177/0018720812436584.
- Wada, T., and K. Yoshida. 2016. “Effect of Passengers’ Active Head Tilt and Opening/Closure of Eyes on Motion Sickness in Lateral Acceleration Environment of Cars.” Ergonomics 59 (8): 1050–1059. doi:10.1080/00140139.2015.1109713.
- Wang, J., K. K. Dixon, H. Li, and J. Ogle. 2004. “Normal Acceleration Behavior of Passenger Vehicles Starting from Rest at All-Way Stop-Controlled Intersections.” Transportation Research Record 1883 (1): 158–166. doi:10.3141/1883-18.
- Wang, J., K. K. Dixon, H. Li, and J. Ogle. 2005. “Normal Deceleration Behavior of Passenger Vehicles at Stop Sign–Controlled Intersections Evaluated with In-Vehicle Global Positioning System Data.” Transportation Research Record 1937 (1): 120–127. doi:10.1177/0361198105193700117.
- Wijlens, R., M. M. van Paassen, M. Mulder, A. Takamatsu, M. Makita, and T. Wada. 2022. “Reducing Motion Sickness by Manipulating an Autonomous Vehicle’s Accelerations.” Proceedings of the 15th IFAC Symposium on Analysis, Design and Evaluation of Human-Machine Systems, San Jose, CA. doi:10.1016/j.ifacol.2022.10.244.
- Wolfermann, A., W. K. M. Alhajyaseen, and H. Nakamura. 2011. “Modeling Speed Profiles of Turning Vehicles at Signalized Intersections.” Proceedings of the 3rd International Conference on Road Safety and Simulation, Indianapolis, IN.
- Zikovitz, D. C., and L. R. Harris. 1999. “Head Tilt during Driving.” Ergonomics 42 (5): 740–746. doi:10.1080/001401399185414.