?Mathematical formulae have been encoded as MathML and are displayed in this HTML version using MathJax in order to improve their display. Uncheck the box to turn MathJax off. This feature requires Javascript. Click on a formula to zoom.
Abstract
Impulse excitation is a suitable tool to determine the temperature dependence of Young’s modulus and to monitor the ferroelectric phase transition of unpoled barium titanate ceramics (tetragonal-to-cubic and vice versa). By measurement from room temperature to 200–300 °C and back, it is found that there is an elastic anomaly with a sharp minimum (at 120 °C during heating and 110 °C during cooling, with a completely reproducible hysteresis), below and above which Young’s modulus exhibits values of 40–50 GPa and up to 90 GPa, respectively, and damping changes abruptly from values of order 0.01 to less than 0.001.
1. Introduction
It is well known that the ferroelectric tetragonal-cubic phase transition of barium titanate (BT) single crystals and their polycrystalline counterparts, BT ceramics, is accompanied by an elastic anomaly (“softening”) near the Curie temperature [Citation1–8] and by peaks or abrupt changes in damping (quantified by the so-called inverse quality factor) [Citation9–15], which represent mechanical losses caused by internal friction (in addition to the dielectric losses [Citation16–18]). For unpoled BT ceramics the effective elastic properties at room temperature have been investigated by Dent et al. in 2007 [Citation19] and Garbarz-Glos et al. in 2011 [Citation20], for both poled and unpoled BT ceramics with different porosity (obtained via sintering at different temperatures in the range 1300–1360 °C) by Ogawa and Ikegaya in 2015 [Citation21], while the temperature dependence of Young’s modulus and damping (internal friction) has been studied by Cheng et al. in 1994–1996 [Citation13–15]. It has to be noted that the elastic properties of unpoled BT ceramics are of interest because of the variable degree of polarization that can occur locally in porous piezoceramics [Citation22, Citation23] and in piezoelectric metamaterials prepared by additive manufacturing [Citation24]. They can be obtained by directional averaging from BT single crystal data [Citation1, Citation25], from poled BT ceramics data [Citation19, Citation26, Citation27] or by the direct measurement of unpoled BT ceramics [Citation5, Citation16, Citation20, Citation21]. The latter approach is chosen for Young’s modulus in the present paper.
Although the temperature dependence of elastic properties, damping and related quantities (resonant frequencies, wave velocities, Brillouin frequency shift, attenuation coefficient) has been studied experimentally for BT single crystals and BT ceramics from time to time [Citation1–15], and theories are available that explain the observed anomalies [Citation28, Citation29], monitoring this temperature dependence via the impulse excitation technique has, to the best of our knowledge, not been published so far. The present paper intends to fill this gap. It is shown that impulse excitation is indeed a very useful tool for monitoring ferroelectric phase transitions in barium titanate ceramics (and other piezoelectrics). Measurement results of six complete heating-cooling cycles are published here probably for the first time and reveal clear evidence for a hysteresis in the Curie temperature between heating and cooling. Moreover, it will be shown that the temperature dependence of Young’s modulus for quartz sandstone reveals intriguing similarities, but also characteristic differences, to that of BT ceramics.
2. Experimental
The barium titanate (BaTiO3)/BT ceramic sample was prepared from commercial BT powder (US Research Nanomaterials Barium Titanate Nanopowder, 99.9% BaTiO3, tetragonal, 200 nm) by uniaxial pressing at 50 MPa and conventional firing in an electric furnace in air at 1100 °C (heating rate 2 °C/min, dwell time 2 h). The bulk density and open porosity were determined via the Archimedes method using water as a pycnometric liquid. The total porosity was calculated from the bulk density and the theoretical density (6.0 g/cm3). The phase purity has been checked via X-ray diffraction/XRD (PANalytical XPERT-3, CuKα) in the range 5–80° (2θ). Moreover, for reasons of comparison that will become evident below, two samples of natural sandstone (originating from the Buntsandstein formation at Freudenstadt, Germany) have been tested.
Young’s modulus has been determined by the impulse excitation technique, using a resonant frequency and damping analyzer (RDFA 23, IMCE, Belgium) equipped with an electric high-temperature furnace (HT 1600, IMCE, Belgium) from the fundamental mode of the resonant frequency of flexural vibrations according to ASTM 1876-99 [Citation30]. The inverse quality factor, which quantifies damping, has been extracted from an exponential fit of the amplitude decrease of the flexural vibrations [Citation31–33]. Further details concerning these experimental measurements, the underlying theory and the relations used for data evaluation, can be found in our previous papers on impulse excitation measurements [Citation34–36].
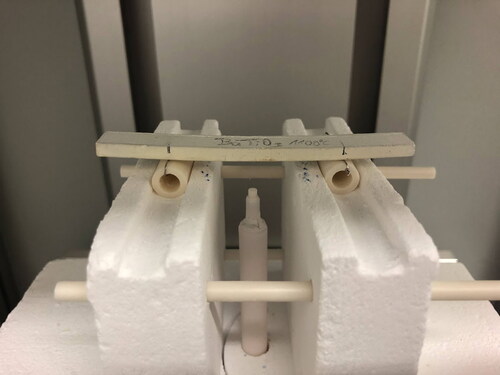
The temperature dependence of elastic and anelastic properties (Young’s modulus and damping), have been determined from room temperature to 200–300 °C (heating and cooling rate 5 °C/min, without dwell at the maximum temperature). The heating elements (superkanthal heating wires) were at a distance of approximately 10 cm from the center of the sample. The temperature was measured by a thermocouple in an alumina shielding tube at a distance of approximately 5 mm from the sample surface (at the center of the sample). The sample support consisted of two alumina tubes with platinum wires to enable correct positioning of the sample at the node lines, see .
Figure 1. Barium titanate ceramic sample and its support in the high-temperature impulse excitation equipment (RDFA 23 and HT 1600. IMCE, Belgium); the alumina tube in the center contains the alumina projectile that hits the sample in free flight and thus excites the flexural vibration.
3. Results and discussion
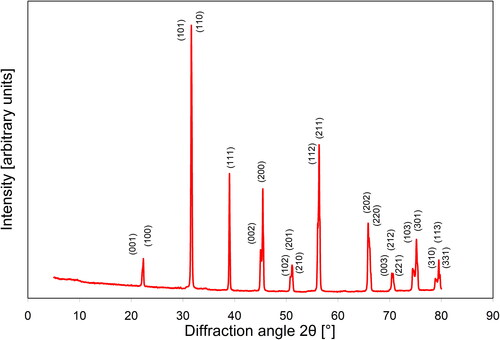
After firing the bar-shaped barium titanate sample had a length of 93.24 ± 0.04, a width of 11.23 ± 0.12 and a height of 4.04 ± 0.13 mm. The bulk density was 4.026 g/cm3, which corresponds to a relative density of 0.669 and a total porosity of 0.331 (taking the theoretical density of 6.017 g/cm3 [Citation16]). The apparent (open) porosity, as measured via the Archimedes method, was 0.313, i.e. the complementary amount of 0.018 had to be assigned to closed porosity. X-ray diffraction confirmed that the material after firing was single-phase barium titanate, because all XRD lines could be unambiguously assigned to barium titanate, leaving no unidentified peaks, see .
Figure 2. X-ray diffractogram of the barium titanate sample after firing.
According to the numerical computations by Dent et al. [Citation19] the directionally averaged Young modulus of (dense) unpoled BT ceramics is 115 ± 6 GPa, which is by about 15% lower than the experimentally value of 128 GPa measured by Marutake in 1956 [Citation37] but by about 15% higher than the values 98–106 GPa measured by Ogawa and Ikegaya in 2015 [Citation21]. Slightly lower Young’s modulus values (87–105 GPa) have been determined by Dong et al. in 2010 [Citation5], and even lower values (around 80 GPa) have been measured for BT ceramics by Garbarz-Glos et al. in 2011 [Citation20]. According to Dent et al. [Citation19], the directionally averaged Poisson ratio is 0.35 ± 0.05 [Citation19], which is in excellent agreement with the value of 0.35 measured by Marutake [Citation37] and Garbarz-Glos et al. [Citation20] and also in good agreement with the values 0.32–0.36 measured by Ogawa and Ikegaya [Citation21]. Therefore we consider the value of Dent et al. [Citation19] for Young’s modulus (115 GPa) as the most reliable value for dense barium titanate ceramics at room temperature and take it as a starting point for the discussions in this paper.
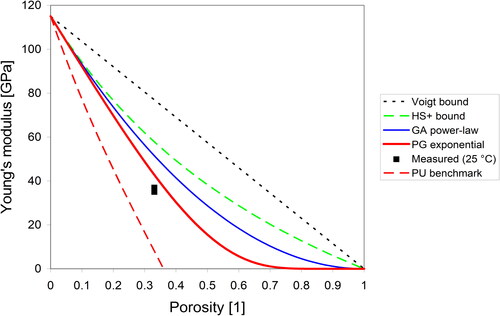
Due to the high porosity, the effective Young modulus of the porous material must be significantly lower. shows that for a sample of porosity 0.331 the upper Paul bound (Voigt bound) is 77.9 GPa, the upper Hashin-Shtrikman bound 57.8 GPa, the Gibson-Ashby power-law prediction 51.5 GPa and the Pabst-Gregorová exponential prediction 42.8 GPa. The value measured for the real material is 35–37 GPa at 25 °C, which is a very realistic value, given the fact that partially sintered ceramics (with a prevalence of concave pores) are generally expected to have modulus values lower than the Pabst-Gregorová exponential prediction [Citation38]. Actually, the experimentally measured value is significantly higher than the Pabst-Uhlířová benchmark prediction [Citation39] for partially sintered ceramics with concave pores without pore spheroidization (8.0 GPa), which indicates that pore spheroidization has occurred in this case.
Figure 3. Measured room temperature value of Young’s modulus of porous barium titanate ceramics (porosity 0.331), compared to the common theoretical predictions (from top to bottom: upper Paul bound/Voigt bound, upper Hashin-Shtrikman bound, Gibson-Ashby/GA power-law prediction, Pabst-Gregorová/PG exponential prediction and Pabst-Uhlířová/PU benchmark relation.
shows the temperature dependence of Young’s modulus for the porous BT ceramics prepared in this work. It is evident that with increasing temperature there is first a slight increase (from 40 GPa at 30 °C to 49 ± 1 GPa at 100 °C), followed by a steep increase above 120 °C. With a further increase in temperature the rate of this increase gradually decreases until it levels off with peak values at the highest measurement temperature (87 GPa at 200 °C). While the first slight increase during heating may be due to the closure (due to thermal expansion) of microcracks (which are the result of the thermal mismatch stresses caused by the random orientation of non-spherical grains with anisotropic thermal expansion), the elastic anomaly (mechanical softening) at around 120 °C during heating is caused by the first-order phase transition from the tetragonal to the cubic phase [Citation5, Citation40, Citation41]. During cooling Young’s modulus decreases, but the steep decrease during cooling is shifted by about 10 K to around 110 °C. Below the Curie temperature Young’s modulus increases again, until the original room temperature value is regained (the fact that repeated heating-cooling cycles describe closed loops indicates the absence of damage accumulation).
Figure 4. Temperature dependence of Young’s modulus of porous barium titanate ceramics (porosity 0.331), measured for two complete heating-cooling cycles; full symbols heating (up), empty symbols cooling (down).
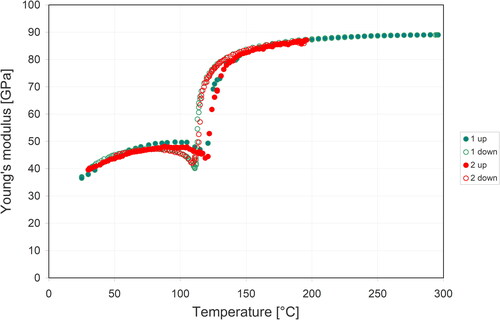
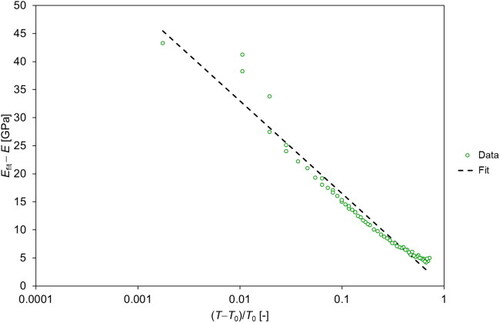
However, the fact that Young’s modulus does not change abruptly, when the Curie temperature of 120 °C is exceeded during heating, must be attributed to the fact that upon exceeding the Curie temperature ferroelectric behavior is not eliminated completely, which indicates that even in the high-temperature paraelectric phase certain remnants of ferroelectric domains survive. That means that the gradual increase of Young’s modulus during heating above the Curie temperature has nothing to do with microcrack closure. Similarly, during cooling Young’s modulus starts to decrease already at temperatures much higher than the Curie temperature, and also this decrease has nothing to do with microcrack opening. Indeed, the existence of long-lived tetragonal distortions called tetragonal nanodomains is in agreement with the so-called “precursor dynamics” that may exist for temperatures up to 75–80 K above the Curie temperature [Citation7, Citation42] and has been invoked as an argument to apply a relation based on Levanyuk’s theory [Citation29] for fitting the temperature dependence of elastic moduli (stiffnesses) above the Curie temperature results. Based on this theory, the temperature dependence of Young’s modulus can be fitted by the relation
(1)
(1)
where log is either the natural logarithm (i.e. ln) or the decadic logarithm [Citation3, Citation7, Citation42] (which affects only the value of
) lists the values of the fit parameters obtained, show the fit curves and in the Appendix show the corresponding semi-logarithmic plots. The
values are 121 °C and 112–113 °C for heating and cooling, respectively, which is in good agreement with the Curie temperatures estimated by visual inspection of the graphs. Also the
values (89–92 GPa), i.e. the estimated Young’s modulus values without anomalous behavior (mechanical softening), are very close to (albeit slightly higher than) the highest Young’s modulus measured (87 GPa). The values of these two fit parameters are independent of whether the natural or decadic logarithm is taken, whereas the fit parameter
is 5.2–7.6 GPa in the first case and 11.9–17.4 GPa in the latter, see . These values can be compared with the fit parameters obtained by Ko et al. [Citation7], who found (via Brillouin scattering) for the stiffness tensor component
a BT single crystal an
value of 207.4 GPa, an
value of 20.2 GPa and a
value of 119 °C. It should be noted that the difference in the
value is not only due to the fact that Ko et al. do not consider porous ceramics but single crystals (i.e. fully dense materials), but also due to the fact that Ko et al. do not consider a directionally averaged Young’s modulus but a stiffness tensor component. For these two reasons their fitted stiffness constant
is significantly larger than our
value. For the other two fit parameters (with
referring to the decadic logarithm) the agreement is surprisingly good. Moreover, similar to Ko et al. [Citation7], we were not able to fit the experimental results with the fit relation derived from Dvořák’s theory [Citation28] based on the mean-field approximation and the electrostrictive coupling between the polarization and the strain.
Figure 5. Fit (according to Levanyuk’s theory) of the temperature dependence of Young’s modulus of porous barium titanate ceramics (porosity 0.331) above the Curie temperature, measured during heating (first heating-cooling cycle).
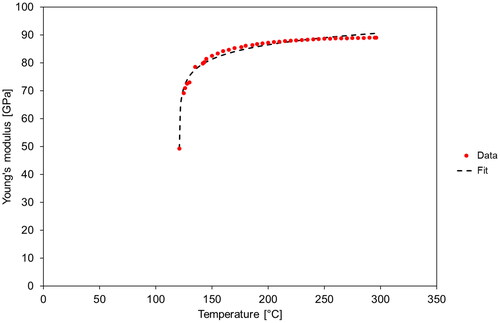
Figure 6. Fit (according to Levanyuk’s theory) of the temperature dependence of Young’s modulus of porous barium titanate ceramics (porosity 0.331) above the Curie temperature, measured during cooling (first heating-cooling cycle).
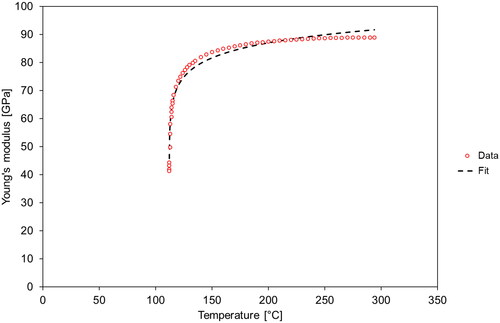
Figure 7. Fit (according to Levanyuk’s theory) of the temperature dependence of Young’s modulus of porous barium titanate ceramics (porosity 0.331) above the Curie temperature, measured during heating (second heating-cooling cycle).
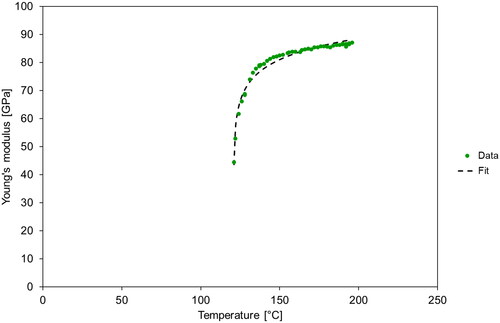
Figure 8. Fit (according to Levanyuk’s theory) of the temperature dependence of Young’s modulus of porous barium titanate ceramics (porosity 0.331) above the Curie temperature, measured during cooling (second heating-cooling cycle).
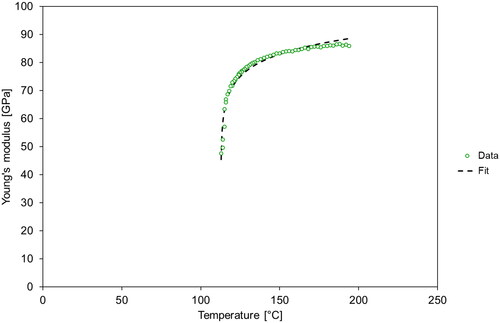
Table 1. Fit parameters obtained by fitting the temperature dependence of Young’s modulus in the paraelectric (high-temperature) phase of BT ceramics according to Levanyuk’s theory.
The basic findings of this paper can be compared with those of Cheng et al. [Citation14], who found sharp elastic anomalies at 126 °C and 132 °C (during heating only) for pure BT ceramics sintered at 1240 °C and 1300 °C (both with 2 h dwell time), respectively. These values are 6–12 °C higher than our values obtained during heating. Also the results of Lee et al. [Citation8], which were obtained during cooling, indicate a Curie temperature of 131 °C, which is significantly higher than the value determined in the present work (110 °C). Actually Ko et al. [Citation7] report a range of Curie temperatures of 100–132 °C even for BT single crystals, with the comment that “in fact, a reason for this big discrepancy in TC is not known”. Irrespective of the absolute TC values, it has to be emphasized that an important finding of this work, to the best of our knowledge not reported in other work, is the observed “hysteresis” in the Curie temperature between heating and cooling. Although at first sight it might seem that this hysteresis could be an experimental artifact caused by thermal inertia, i.e. the fact that the sample has actually a lower temperature during heating and a higher temperature during cooling (which would place the real Curie temperature somewhere in between), this is not the case, as shown by the following counterexample.
shows the temperature dependence of Young’s modulus for two sandstone samples. As most common sandstones, also these two samples consist mainly of quartz (94–96% according to a Rietveld-based X-ray diffraction phase analysis), but a small content of other phases, mainly microcline (potassium-rich alkali feldspar, 4–6%), and traces of muscovite/potassium mica, hematite and possibly other iron-bearing minerals are present in this case as well. The bar-shaped samples of length 79 mm, width 15 mm and height 6 mm have apparent porosities of 0.127–0.129 before measurement (from room temperature to 800 °C and back), but after the measurement the apparent porosity increases to 0.141–0.142, obviously due to the formation of cracks (damage accumulation). Impurities in the quartz may be responsible for the shift of the transition temperature between low-temperature quartz (trigonal, piezoelectric, 2.65 g/cm3) and high-temperature quartz (hexagonal, not piezoelectric, density 2.55 g/cm3) from the commonly assumed value of 573 °C [Citation43] to the much lower values observed here (535 °C during heating, 560 °C during cooling). We note in passing that – in contrast to BT ceramics – sandstone cannot be poled, although low-temperature quartz is piezoelectric. The reason is that quartz is not ferroelectric. We also note that the hexagonal high-temperature quartz is paraelectric, although piezoelectricity is not forbidden from the viewpoint of symmetry in this crystal class (point group 6/mmm). That means, high-temperature quartz is paraelectric just because the piezoelectric moduli are unmeasurably small.
Figure 9. Temperature dependence of Young’s modulus for two quartz sandstone samples (denoted I and II), each measured twice (denoted 1 and 2).
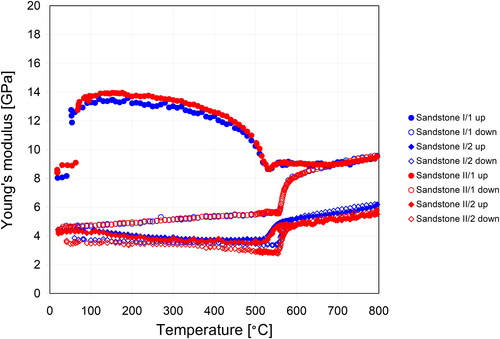
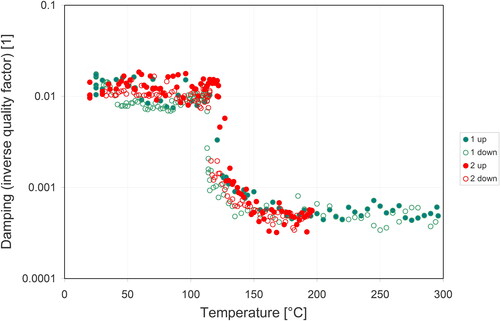
Figure 10. Temperature dependence of damping (quantified via the inverse quality factor) of porous barium titanate ceramics (porosity 0.331), measured for two complete heating-cooling cycles; full symbols heating (up), empty symbols cooling (down).
There are several characteristic differences between the temperature dependence of Young’s modulus for quartz sandstone and that of BT ceramics, apart from the different absolute values. In particular, during the first heating the former exhibits an extremely steep increase at around 50 °C, where the values increase from 8–9 GPa at room temperature to 13–14 GPa around 150 °C, followed by a gradual decrease, an anomaly indicative of the phase transition at around 535 °C (during heating) and a virtually constant value of around 9 GPa (with a slight upward curvature above 650 °C, which makes fitting according to Levanyuk’s theory impossible). During cooling Young’s modulus decreases (with a downward curvature) toward the phase transition point at around 560 °C, below which there is a more or less linear decrease toward the room temperature value. The very low room temperature values after cooling (around 4.5 GPa) are indicative of extensive damage accumulation. Also the second heating-cooling cycle is for sandstone completely different than for BT ceramics, obviously as a consequence of the completely changed (damaged) microstructure.
However, the most important finding is the fact that the phase transition temperature determined via impulse excitation is for sandstone lower during heating than during cooling. This is confirmed also by fitting the temperature dependence above the phase transition via the aforementioned logarithmic relation based on Levanyuk’s theory, see . The T0 values obtained by fitting are 522–524 °C during heating and 554–558 °C during cooling, and the Efit values of the second heating-cooling cycle (around 6 GPa) are significantly lower than during the first cooling (around 10 GPa). The fit parameters (referred to natural and decadic logarithms, respectively) are much smaller for sandstone (0.4–0.9 GPa and 1–2 GPa) than for BT ceramics (5.2–7.6 GPa and 12–17 GPa). Interestingly, the first heating cycle could not be fitted by this relation (because of the dominant upward curvature of the temperature dependence of Young’s modulus above the phase transition temperature). The fact that the phase transition temperature is for sandstone lower during heating than during cooling clearly shows that thermal inertia is not an issue in these measurements. Therefore it is verified that the “hysteresis” in the Curie temperature measured for BT ceramics between heating and cooling is a real effect and not just an artifact caused by thermal inertia.
Table 2. Fit parameters obtained by fitting the temperature dependence of Young’s modulus in the paraelectric (high-temperature) phase of quartz sandstone according to Levanyuk’s theory.
Now coming back to BT ceramics, shows the temperature dependence of damping (caused by dissipative mechanisms, e.g. internal friction, and quantified by the inverse quality factor). Damping measurements are much more difficult to perform by impulse excitation than elastic modulus measurements, because damping is prone to be affected by external friction effects (e.g. caused by the sample support) and – in contrast to the resonant frequency measurement – is very sensitive to positioning of the specimen along the nodal lines. A slight shift off the nodal line can enormously increase the external contributions to damping.This is the main reason for the large scatter of experimental data in . Therefore, unless the sample support is virtually friction-free (which could be approximated by fixing the sample which platinum wires), only the lowest damping values can be considered as material-specific internal damping caused by mechnical losses due to internal friction or other modes of energy dissipation. Nevertheless, from the two measurements shown in it is evident that around the Curie temperature there is a significant change in the damping. The absolute values decrease from 0.007–0.018 in the ferroelectric phase to values more than an order of magnitude lower (0.0003–0.0008) in the paraelectric phase. These values are in very good agreement with those found by Cheng et al. in 1994 [Citation13] and Chen et al. in 2020 [Citation16]. Also the hysteresis in damping between heating and cooling is visible.
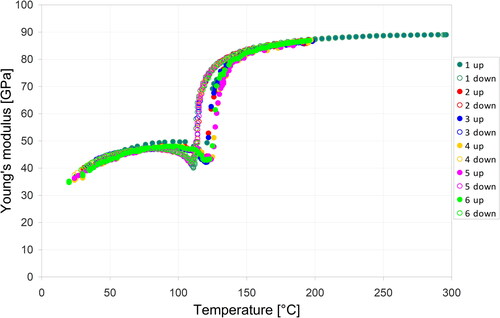
Last but not least, shows the temperature dependence of Young’s modulus of the porous barium titanate ceramic sample (porosity 0.331) described in this paper for six complete heating-cooling cycles. From these results it would seem that the heating curves exhibit a slight shift to the right (indicating a slightly higher Curie temperature of around 125 °C) and a blunter and broader elastic anomaly compared to the cooling curves. The reason is not clear, and could be just due to a larger degree of scatter during heating than during cooling. The reason might be that the microstructure before heating contains random defects (microcracks) as result of previous cooling that may differently affect the transition temperatures (depending on the size of crack clusters which may vary statistically, i.e. can somtimes be larger, sometimes smaller), whereas the cooling curves always start from a more less annealed state.
Figure 11. Temperature dependence of Young’s modulus of porous barium titanate ceramics (porosity 0.331), measured for six complete heating-cooling cycles; full symbols heating (up), empty symbols cooling (down).
4. Summary and conclusions
In this work the tetragonal-cubic (ferroelectric-paraelectric) phase transition of unpoled barium titanate (BaTiO3)/BT ceramics has been studied via impulse excitation. For this purpose a porous BT ceramic sample has been prepared by uniaxial pressing (at 50 MPa) and partial sintering in air at 1100 °C using a standard firing schedule (heating rate 2 °C/min, dwell time 2 h). This bar-shaped sample, which had a porosity of 0.331 (i.e. 33.1%), has been tested in a resonant frequency and damping analyzer (IMCE RDFA 23) equipped with a high-temperature furnace (IMCE HT 1600) between room temperature and 200–300 °C, using heating and cooling rates of 5 °C/min. Two complete heating-cooling cycles have been analyzed in great detail (temperature dependence of Young’s modulus and damping), and four more heating-cooling cycles have been performed for additional comparison (only Young’s modulus).
The measured Young’s modulus of 35–37 GPa, as determined from the fundamental mode of the resonant frequency of flexural vibrations, is below the Pabst-Gregorová exponential prediction (43 GPa), but significantly above the Pabst-Uhlířová benchmark prediction for ideally concave pores (8 GPa), which indicates a certain degree of pore spheroidization due to sintering. During heating the BT ceramics exhibit an elastic anomaly (mechanical softening) at 120 °C, while during cooling this anomaly occurs at 110 °C. This “hysteresis” in the elastic anomaly, which corresponds to the tetragonal-cubic phase transition, indicates a “hysteresis” in the Curie temperature between heating and cooling of approximately 10 K. By contrast, another type of “hysteresis” in the phase transition temperature is observed in quartz sandstone, where the phase transition from piezoelectric (but non-ferroelectric) low-temperature quartz to the non-piezoelectric high-temperature quartz occurs at 535 °C and 560 °C during heating and cooling, respectively. This shows that “hysteresis” in the Curie temperature determined for BT ceramics is a real effect and not an artifact due to thermal inertia of the equipment.
Both for BT ceramics and for quartz sandstone the high-temperature branches of the heating and cooling curves of the temperature dependence of Young’s modulus can be fitted by a logarithmic relation according to Levanyuk’s theory of ferroelectric phase transitions. Concomitant with the elastic anomaly at the Curie temperature, BT ceramics exhibit an abrupt change in damping at this temperature, from values of order 0.01 to less than 0.001. Six repeated measurements of the same BT ceramic sample show that the heating branches exhibit larger scatter than the cooling branches, probably due to random clusters of microcracks.
Acknowledgments
This work is part of the project “Impulse excitation as an unconventional method for monitoring phase changes and microstructure evolution during thermal loading of materials”, funded by the Czech Science Foundation/GAČR (project no. 22-25562S/GA22-25562S). Support is gratefully acknowledged.
References
- D. Berlincourt, and H. Jaffe, Elastic and piezoelectric coefficients of single-crystal barium titanate, Phys. Rev. 111 (1), 143 (1958). DOI: 10.1103/PhysRev.111.143.
- S. Kashida et al., Ultrasonic velocities in BaTiO3, J. Phys. Soc. Jpn. 34 (4), 997 (1973). DOI: 10.1143/JPSJ.34.997.
- J. M. Courdille, J. Dumas, and J. Servais, Logarithmic velocity variations for longitudinal ultrasonic waves in cubic BaTiO3 near its ferroelectric transition, J. Phyique. Lett. 39 (13), 227 (1978). DOI: 10.1051/jphyslet:019780039013022700.
- J. H. Ko et al., Elastic softening and central peaks in BaTiO3 single crystals above the cubic-tetragonal phase-transition temperature, Appl. Phys. Lett. 93 (10), 102905 (2008). DOI: 10.1063/1.2980444.
- L. Dong, D. S. Stone, and R. S. Lakes, Softening of bulk modulus and negative Poisson ratio in barium titanate ceramic near the Curie point, Philos. Mag. Lett. 90 (1), 23 (2010). DOI: 10.1080/09500830903344907.
- J. H. Ko et al., Precursor dynamics in the ferroelectric phase transition of barium titanate single crystals studied by Brillouin light scattering, Phys. Rev. B 84 (9), 094123 (2011). DOI: 10.1103/PhysRevB.84.094123.
- J. H. Ko et al., Logarithmic temperature variations of the elastic constant of barium titanate near the ferroelectric phase transition, Curr. Appl. Phys. 12 (4), 1185 (2012). DOI: 10.1016/j.cap.2012.02.055.
- J. Lee et al., Complete determination of elastic stiffness coefficients and local symmetry breaking in the paraelectric barium titanate, Appl. Phys. Lett. 114 (7), 072901 (2019). DOI: 10.1063/1.5086964.
- T. Ikeda, The internal friction of barium titanate ceramics, J. Phys. Soc. Jpn. 13 (8), 809 (1958). DOI: 10.1143/JPSJ.13.809.
- E. J. Huibregtse, W. H. Bessey, and M. E. Drougard, Electromechanical behavior of single crystals of barium titanate from 25 to 160 °C, J. Appl. Phys. 30 (6), 899 (1959). DOI: 10.1063/1.1735260.
- A. Y. Kudzin, L. K. Bunina, and O. A. Grzhegorzhevskii, Internal friction in single crystals of barium titanate, Fiz. Tverd. Tela, Sov. Phys. Solid State 11, 1939 (1969). 112397
- A. Y. Kudzin, E. P. Kashchenko, and V. I. Kostrub, Diffusion potentials in barium titanate and the theory of PTC materials, Fiz. Tverd. Tela 13, 3733 (1971). /SovPhysSolid State 13, 3162 (1972).
- B. L. Cheng et al., Mechanical loss and elastic modulus associated with phase transitions of barium titanate ceramics, J. Alloys Compounds 211-212, 352 (1994). DOI: 10.1016/0925-8388(94)90519-3.
- B. L. Cheng et al., Mechanical loss and Young’s modulus associated with phase transitions of barium titanate based ceramics, J. Mater. Sci. 31 (18), 4951 (1996). DOI: 10.1007/BF00355886.
- W. Duffy et al., Anelastic behavior of barium-titanate-based ceramic materials, MMTA. 26 (7), 1735 (1995). DOI: 10.1007/BF02670760.
- Y. Chen et al., Grain size effects on the electric and mechanical properties of submicro BaTiO3 ceramics, J. Eur. Ceram. Soc. 40 (2), 391 (2020). DOI: 10.1016/j.jeurceramsoc.2019.09.033.
- M. S. Alkathy, and K. C. J. Raju, Structural, dielectric, electromechanical, piezoelectric, elastic and ferroelectric properties of lanthanum and sodium co-substituted barium titanate ceramics, J. Alloys Compounds 737, 464 (2018). DOI: 10.1016/j.jallcom.2017.12.121.
- K. Zloužeová et al., Partially sintered lead-free ceramics from piezoelectric powders prepared via conventional firing and spark plasma sintering (SPS) – Characterization of microstructure and dielectric properties, Ceram. Silik. 65 (1), 30 (2020). DOI: 10.13168/cs.2020.00439.
- A. C. Dent et al., Effective elastic properties for unpoled barium titanate, J. Eur. Ceram. Soc. 27 (13-15), 3739 (2007). DOI: 10.1016/j.jeurceramsoc.2007.02.031.
- B. Garbarz-Glos et al., Elastic properties of barium zirconate titanate ceramics, Integr. Ferroelectrics 123 (1), 130 (2011). DOI: 10.1080/10584587.2011.570666.
- T. Ogawa, and T. Ikegaya, Elastic constants measured from acoustic wave velocities in barium titanate piezoelectric ceramics, Jpn. J. Appl. Phys. 54 (1), 011501 (2015). DOI: 10.7567/JJAP.54.011501.
- R. W. C. Lewis et al., Microstructural modelling of the polarization and properties of porous ferroelectrics, Smart Mater. Struct. 20 (8), 085002 (2011). DOI: 10.1088/0964-1726/20/8/085002.
- Y. Zhang et al., Understanding the effect of porosity on the polarization-field response of ferroelectric materials, Acta Mater. 154, 100 (2018). DOI: 10.1016/j.actamat.2018.05.007.
- W. Pabst, S. Hříbalová, and T. Uhlířová, Quasi-laminate and quasi-columnate modeling of dielectric and piezoelectric properties of cubic-cell metamaterials, J. Eur. Ceram. Soc. 42 (4), 1396 (2022). DOI: 10.1016/j.jeurceramsoc.2021.12.013.
- R. Bechmann, Elastic, piezoelectric, and dielectric constants of polarized barium titanate ceramics and some applications of the piezoelectric equations, J. Acoust. Soc. Am. 28 (3), 347 (1956). DOI: 10.1121/1.1908324.
- M. Zgonik et al., Dielectric, elastic, piezoelectric, electrooptic, and elasto-optic tensors of BaTiO3 crystals, Phys. Rev. B Condens. Matter. 50 (9), 5941 (1994). DOI: 10.1103/physrevb.50.5941.
- D. A. Berlincourt, H. H. A. Krueger, and C. Near, Properties of Piezoelectric Ceramics (Morgan Electro Ceramics, Wrexham, UK 1999
- V. Dvořák, A thermodynamic theory of the cubic-orthorhombic phase transitions in boracites, Czech. J. Phys. 21 (12), 1250 (1971). DOI: 10.1007/BF01699488.
- A. P. Levanyuk, K. A. Minaeva, and B. A. Strukov, Anomalous sound absorption near the Curie points of uniaxial ferroelectrics, /Sov. Phys. Solid State 10, 1919 (1968). Fiz. Tverd. Tela 102443
- ASTM E 1876-99, Standard Test Method for Dynamic Young’s Modulus, Shear Modulus, and Poisson’s Ratio by Impulse Excitation of Vibration (American Society for Testing of Materials/ASTM, West Conshohocken, PA 1999
- A. S. Nowick, and B. S. Berry, Anelastic Relaxation in Crystalline Solids (Academic Press, New York, NY 1972
- W. Pabst et al., Elastic properties and damping behavior of alumina-zirconia composites at room temperature, Ceram. Int. 38 (7), 5931 (2012). DOI: 10.1016/j.ceramint.2012.04.045.
- E. Gregorová et al., Temperature dependence of damping in silica refractories measured via the impulse excitation technique, Ceram. Int. 44 (7), 8363 (2018). DOI: 10.1016/j.ceramint.2018.02.028.
- E. Gregorová et al., Young’s modulus evolution during heating, re-sintering and cooling of partially sintered alumina ceramics, J. Eur. Ceram. Soc. 39 (5), 1893 (2019). DOI: 10.1016/j.jeurceramsoc.2019.01.005.
- E. Gregorová et al., Temperature dependence of Young’s modulus and damping of partially sintered and dense zirconia ceramics, J Eur Ceram. Soc. 40 (5), 2063 (2020). DOI: 10.1016/j.jeurceramsoc.2019.12.064.
- E. Gregorová et al., Microstructure and Young’s modulus evolution during re-sintering of partially sintered alumina-zirconia composites (ATZ ceramics), J. Eur. Ceram. Soc. 41 (6), 3559 (2021). DOI: 10.1016/j.jeurceramsoc.2021.01.045.
- M. Marutake, A calculation of physical constants of ceramic barium titanate, J. Phys. Soc. Jpn. 11 (8), 807 (1956). DOI: 10.1143/JPSJ.11.807.
- W. Pabst, and E. Gregorová, Elastic and thermal properties of porous materials – rigorous bounds and cross-property relations (Critical assessment 18), Mater. Sci. Technol. 31 (15), 1801 (2015). DOI: 10.1080/02670836.2015.1114697.
- W. Pabst, and T. Uhlířová, Benchmark polynomials for the porosity dependence of elastic moduli and conductivity of partially sintered ceramics, J. Eur. Ceram. Soc. 41 (15), 7967 (2021). DOI: 10.1016/j.jeurceramsoc.2021.08.028.
- B. Subramanyam, and K. S. Viswanathan, Elastic anomalies of barium titanate, J. Appl. Phys. 74 (2), 945 (1993). DOI: 10.1063/1.354836.
- B. Subramanyam, and K. S. Viswanathan, Second order elastic anomalies in barium titanate from cubic to tetragonal phase transition, Pramana. - J. Phys. 41 (1), 31 (1993). DOI: 10.1007/BF02847315.
- A. Bussmann-Holder, H. Beige, and G. Völkel, Precursor effects, broken local symmetry, and coexistence of order-disorder and displacive dynamics in perovskite ferroelectrics, Phys. Rev. B 79 (18), 184111 (2009). DOI: 10.1103/PhysRevB.79.184111.
- W. Pabst, and E. Gregorová, Elastic properties of silica polymorphs – a review, Ceram. Silik 57 (3), 167 (2013).
Appendix
show the semi-logarithmic plots of the temperature dependence of Young’s modulus of porous barium titanate ceramics (porosity 0.331) above the Curie temperature fitted according to Levanyuk’s theory, corresponding to in the main text of this paper. These plots confirm the logarithmic temperature dependence of Young’s modulus above the Curie temperature.
Figure A1. Semi-logarithmic graph of the temperature dependence of Young’s modulus of porous barium titanate ceramics (porosity 0.331) above the Curie temperature fitted according to Levanyuk’s theory; heating branch of the first heating–cooling cycle.
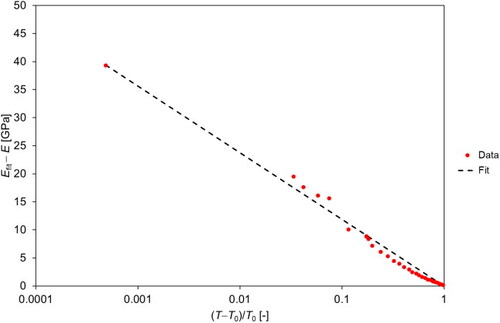
Figure A2. Semi-logarithmic graph of the temperature dependence of Young’s modulus of porous barium titanate ceramics (porosity 0.331) above the Curie temperature fitted according to Levanyuk’s theory; cooling branch of the first heating–cooling cycle.
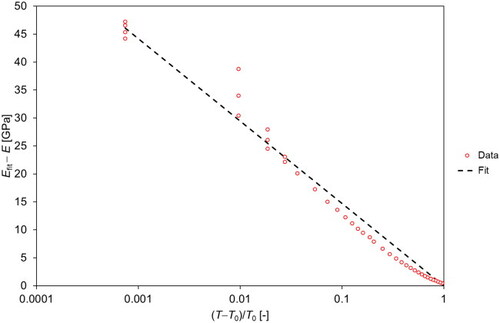
Figure A3. Semi-logarithmic graph of the temperature dependence of Young’s modulus of porous barium titanate ceramics (porosity 0.331) above the Curie temperature fitted according to Levanyuk’s theory; heating branch of the second heating–cooling cycle.
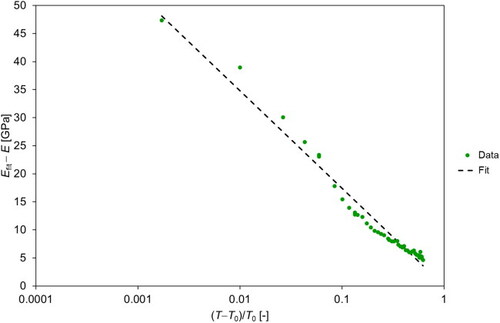
Figure A4. Semi-logarithmic graph of the temperature dependence of Young’s modulus of porous barium titanate ceramics (porosity 0.331) above the Curie temperature fitted according to Levanyuk’s theory; cooling branch of the second heating–cooling cycle.