
Article title: Reports of Value’s Death May Be Greatly Exaggerated
Authors: Robert D. Arnott, Campbell R. Harvey, Vitali Kalesnik, and Juhani T. Linnainmaa
Journal: Financial Analysts Journal
Bibliometrics: Volume 77, Number 1, pages 44–67
When the above article was originally published, and endnote Footnote32 contained production errors. The correct and endnote Footnote32 follow. These issues have been corrected in the online version of the article.
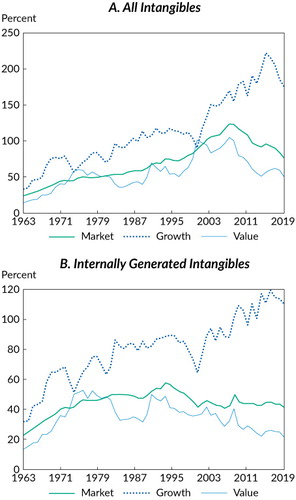
Notes: Panel A displays the ratio of all intangibles (capitalized R&D and 30% of SG&A plus acquired intangibles) to the tangible part of the book value of equity (the book value of equity minus acquired intangibles). Panel B displays the ratio of internally generated intangibles (capitalized R&D and 30% of SG&A) to the book value of equity.
Sources: Research Affiliates, LLC, using data from CRSP/Compustat; Peters and Taylor (2017).
Notes
32 This amount differs from the –6.1% in Table 3 because these results reflect arithmetic returns rather than log returns and a slightly different time span, one beginning in January 2007 instead of July 2007.