
Abstract
This study focuses on the pollen season timing and intensity, and the influence of weather conditions, on airborne Cupressaceae, Quercus, and Poaceae pollen in two different biogeographical areas, Córdoba (Spain) and Tulsa, Oklahoma (USA), during 2010–2014. Pollen concentrations were recorded using Hirst-type spore traps. The meteorological parameters studied included temperature, relative humidity, wind speed, and rainfall. This study aims to define the pollen seasons and their intensity and relationships with meteorological parameters in different biogeographical areas. The main pollen season (MPS) of each pollen type was divided into two periods: pre-peak and post-peak. The Shapiro–Wilk normality test was applied to the pollen concentrations and log transformed data were used. Pearson correlations and linear regression were applied for the pre-peak, post-peak, and MPS for comparing pollen concentrations with meteorological parameters considering both the same day and the previous day. Then, multiple regression analysis was applied with all the meteorological parameters that showed significant results in the linear regression. The models were validated through correlations between the measured and predicted pollen concentrations. The results showed a small difference in the MPS for the different pollen types at each site. Temperature, relative humidity, and rainfall influenced the pollen concentrations. The same day's meteorological parameters usually had a greater impact on the pollen concentration than the previous day's meteorological parameters; although, pollen concentrations for the next day could be forecasted considering the meteorological parameters forecasted for the present day. The pollen concentrations showed greater correlations with temperature.
Studies have been conducted on airborne pollen behaviour in different biogeographical areas around the world, especially in the Northern Hemisphere (Grewling et al. Citation2012; Ziello et al. Citation2012; Zhang et al. Citation2015a, Citation2015b; Helfman-Hertzog et al. Citation2018). In each area, different species contribute to the airborne pollen calendar. The pollen season timing and intensity also differed from area to area, as they are influenced by different meteorological parameters: temperature, rainfall, relative humidity, wind speed, and wind direction. Differences and changes in the meteorological parameters affect the daily pollen concentrations (Helfman-Hertzog et al. Citation2018). The meteorological parameters also influence pollen distribution (Beggs Citation2015) and the onset and length of the pollen season (García-Mozo et al. Citation2013). Different studies performed in the same locations have found year-to-year variations in airborne pollen concentrations, peak days, and the main pollen season (MPS) (Levetin Citation1998; Dvorin et al. Citation2001; Velasco-Jiménez et al. Citation2013) because of the changes in the daily meteorological parameters during the pollen season.
Three common pollen types in the two studied areas (Córdoba, Spain, and Tulsa, Oklahoma, USA) were selected. These are Cupressaceae, Quercus, and Poaceae, but different species are represented because of different biogeographical regions. The three pollen types were studied because of their high prevalence and their effect on the allergic population. Each pollen type has its own highlights, which will be detailed later.
Cupressaceae
Cupressaceae is a conifer family of over 15 genera with worldwide distribution (Bortenschlager Citation1990). Cupressaceae species are native to the Aegean region, but over time, they were planted in southern Europe (Tutin et al. Citation1964), an area with a warm temperate climate (Marchetti et al. Citation2017). The species are pollinated by wind and their pollen are light (Flonard et al. Citation2018). The species in Córdoba and Tulsa are different. The main species in Córdoba are: Cupressus sempervirens L., C. arizonica Greene and C. macrocarpa Hartweg (Galán et al. Citation2020). A new genus name for cypresses in Western Hemisphere (Hesperocyparis) has been described by Adams et al. (Citation2009) using phylogenetic comparisons with Eastern Hemisphere cypresses. However, in this study, we continue to use Cupressus when referring to C. sempervirens, C. arizonica and C. macrocarpa that were planted in western and southern Europe (Tutin et al. Citation1993; Hidalgo et al. Citation2003) and were well represented in urban spaces and surrounding areas in Córdoba (Velasco et al. Citation2014). Native Juniperus species are also represented in natural areas of the province of Córdoba, but the high airborne Cupressaceae pollen concentration came from ornamental cypress trees in the city. In Tulsa (Oklahoma), J. virginiana L. is the only local native species of Cupressaceae (Levetin et al. Citation2000). Tulsa has other minor represented ornamental species, such as J. communis L. and J. chinensis L. (Flonard et al. Citation2018), which contributed to the Cupressaceae pollen type. In addition, long-distance transport of J. ashei J. Buchholz (mountain cedar) pollen from southern Oklahoma and central Texas (Levetin & Buck Citation1986; Mohanty et al. Citation2017) was responsible for the pollen registered in December and January.
Cupressaceae was chosen for this study because, in recent decades, they have been identified as a growing source of pollen in the Mediterranean region (Geller-Bernstein et al. Citation2000; Papa et al. Citation2001; Charpin et al. Citation2005; Charpin et al. Citation2019), representing 20–40% of total airborne pollen during winter and early spring (Mandrioli et al. Citation2000; Galán et al. Citation2016; Rojo et al. Citation2016) and being responsible for winter allergies (Guerra et al. Citation1996; Charpin et al. Citation2005). Additionally, some species in North America, such as Juniperus ashi can be transported long distances and can cause allergy symptoms in places far from the source (Mohanty et al. Citation2017).
Quercus
Quercus is distributed in the Northern Hemisphere; however, different species are represented in different biogeographical areas. The common species in Córdoba are Q. ilex subsp. ballota (Desf.) Samp., Q. coccifera L., Q. suber L., Q. faginea Lam. (García-Mozo et al. Citation2007a; García-Mozo et al. Citation2007b; López-Orozco et al. Citation2021). Quercus pyrenaica Willd. also grows in a narrow space in the north of the province, but it is in the southern border of distribution in the Iberian Peninsula, and it is uncommon in the study area (Tutin et al. Citation1993). Tulsa has 12 native Quercus species, and the common ones are Q. stellata Wangenh, Q. marilandica Muench. (Levetin et al. Citation2000), Q. muehlenbergii Engelm, Q. prinoides Willd., Q. rubra L., and Q. shumardii Buckland. (https://www.floraoklahoma.org Flora of Oklahoma, 26 February 2020).
Quercus was chosen for this study because different species are well represented in Europe and are considered a moderate cause of pollinosis, especially in areas with high pollen concentrations (Pedrosa et al. Citation2020). Additionally, some studies have shown changes in the Quercus pollen season trends, especially at the start of the pollen season, i.e. in the Iberian Peninsula (García-Mozo et al. Citation2010) and in some places in the United States (Zhang et al. Citation2014), and probably in other places, depending on weather and climate, but not in Tulsa (Levetin Citation2021).
Poaceae
Poaceae represents a botanical family with 771 genera and 12 074 species (Soreng et al. Citation2015). In Córdoba, the phenological behaviour of 33 Poaceae species has been studied, presenting the species more contributing to the pollen curve: Dactylis glomerata L., Lolium rigidum Gaud., Trisetaria panicea Lam., and Vulpia geniculata L. (León-Ruiz et al. Citation2011; Cebrino et al. Citation2016). In Oklahoma, at least 45 Poaceae species had been studied. The species that contribute the most to pollen concentrations were Agropyron smithiis Gaertn., Agrostis stolonifera L., Cynodon dactylon L., Dactylis glomerata L., Festuca pratensis Huds., Holcus lanatus L., Phleum pratense L. and species from Lolium L. and Poa L. (Levetin & Buck Citation1980). Some genera, e.g. Cynodon, Dactylis, Lolium and Poa, grew in both biogeographical areas (Levetin & Buck Citation1980; García-Mozo et al. Citation2007a). Poaceae was chosen for this study because it is a cosmopolitan botanical family, and Poaceae pollen is known as the leading cause of allergies in different regions in the world, more than any other pollen type (García-Mozo Citation2017).
The impact of global warming on pollen seasonality
In recent years, global warming had been discussed among the scientific community. Global warming may affect the main pollen season start (MPSS) for different plants. Various studies have presented different findings.
Cupressaceae
A study in Bavaria, Germany (Rojo et al. Citation2021) found that the MPS of Cupressaceae starts earlier, while a study in Jaen, Spain (Ruiz-Valenzuela & Aguilera Citation2018) also found an earlier MPSS. In Tulsa, USA, the same trend of earlier MPSS was observed, but it was not significant (Levetin Citation2021). Alternatively, some studies have found that the MPSS has not changed over the years, such as in Salamanca (Rodríguez de la Cruz et al. Citation2015) and Córdoba (De Linares et al. Citation2021), both cities with a warm summer Mediterranean climate in Spain.
Quercus
The same contradictory findings that occurred for Cupressaceae also occur for Quercus. The MPS started earlier than in previous years in Leiden, the Netherlands (Van Vliet et al. Citation2002); in Fargo, Omaha, Cherry Hill, Newark, and Pleasanton, in the United States (Zhang et al. Citation2014), and also in Invergowrie (Scotland) (Adams-Groom et al. Citation2022). However, in Córdoba (López-Orozco et al. Citation2021) and Ourense (Fernández-González et al. Citation2020), south and north-western Spain, respectively, the MPSS was delayed over the years.
Poaceae
The Poaceae’s MPS also started earlier than in previous years in Bavaria, Germany (Rojo et al. Citation2021), Leicester, Worcester, and Cardiff, in the United Kingdom (Adams-Groom et al. Citation2022), and in Tulsa, in the United States, a trend was observed but not significant (Levetin Citation2021). But, as with Cupressaceae and Quercus, the MPS was delayed in Jaen, Spain (Ruiz-Valenzuela & Aguilera Citation2018).
The impact of meteorological parameters on pollen concentration during the pollination period
Another aspect of meteorological parameter impact on airborne pollen is during the pollination period. Positive correlations between the concentrations of different pollen types and temperature in different climate types and biogeographic regions have been found in many studies around the world, e.g. for Cupressaceae in Évora, south of Portugal (Galveias et al. Citation2021), and in Granada, Spain (Díaz de la Guardia et al. Citation2006). Across the Unites States, according to a climate model that was applied to predict the Cupressaceae pollen following climate change also, shows a positive relationship between the temperature and pollen concentrations in the future (Zhang & Steiner, Citation2022). Many studies present a negative correlation between Cupressaceae pollen and relative humidity and also with rainfall, e.g. in Haifa, Israel (Helfman et al. Citation2011), in Porto, Portugal (Gomes et al. Citation2019), and with rainfall in Konya, Turkey (Kizilpinar et al. Citation2012). The same climate model applied across the United States predicted for Quercus an increase in pollen production with higher temperatures (Zhang & Steiner, Citation2022). In addition, a study in Derby, UK (Corden & Millington Citation1999) also presents a positive relationship between current temperatures and Quercus pollen, as occurs in other studies, i.e. in Santiago de Compostela, Spain (Jato et al. Citation2002b). Relative humidity and rainfall correlated negatively with Quercus pollen in Santiago de Compostela and Guadalajara, Spain (Jato et al. Citation2002b; Rojo et al. Citation2015). The exact relationship of a positive correlation between temperature and Poaceae pollen was found in Tetouan, northwest Morocco (Aboulaich et al. Citation2013), in Zagreb, Croatia (Peternel et al. Citation2006), in Guangzhou, southern China (Rahman et al. Citation2021), and in Bratislava, southwest Slovakia (Scevková et al. Citation2020). The same occurrence for the two trees, Cupressaceae and Quercus, was found for Poaceae pollen with relative humidity and rainfall, which correlated negatively in Santiago de Compostela, Guadalajara, Galicia, Spain, and in Bratislava, Slovakia (Jato et al. Citation2002b; Jato et al. Citation2009; Rojo et al. Citation2015; Scevková et al. Citation2020).
Daily prediction of pollen concentration by linear regression, or lately by machine learning algorithms, has been accelerated in recent years for the three pollen types. For example, for Cupressaceae, in Malaga (Spain) (Picornell et al. Citation2019), in Istanbul, Turkey (Zemmer et al. Citation2022), and across the United States (Lo et al. Citation2021; Zhang & Steiner, Citation2022); for Quercus in Malaga (Picornell et al. Citation2019), in Córdoba (López-Orozco et al. Citation2021) and in the United States (Lo et al. Citation2021; Zhang & Steiner, Citation2022); and for Poaceae, in Istanbul (Zemmer et al. Citation2022), in the United States (Lo et al. Citation2021; Zhang & Steiner, Citation2022), in Moscow, Russia (Volkova & Severova, Citation2019); but the range of influence of meteorological parameters on pollen concentrations needs additional study.
In this context, it could be considered that the three pollen types pollinate at different periods, and their intensity will be different from each other in such different climate regions. A comparison between two different climate regions for the same pollen types at the same time is lacking. Such comparison can determine how the meteorological conditions influence pollen concentrations in different climate regions.
This study defines the MPS and the intensity for three important pollen types. The study specifically compared two biogeographical regions with different climates during the same years to explore the relationship between meteorological conditions and their impact on three pollen types.
Material and methods
Study areas
The study was carried out in two different areas. One pollen sampling station was in western Europe, in the Guadalquivir River valley (37° 50′ N, 4° 45′ W) in Córdoba city, south Spain. The pollen sampling was performed in Campus de Rabanales (University of Cordoba), 9 km from the city, 123 m above sea level (a.s.l.) and 144 km from the Mediterranean Sea. According to a new global map of Köppen–Geiger climate classification, Córdoba has a hot Mediterranean climate (Csa) (Beck et al. Citation2018) with a slightly continental climate. The weather conditions in Córdoba vary significantly from year-to-year (Domínguez-Bascón Citation2002). The temperature amplitude during the year is about 18–21 °C (Testi et al. Citation2006). The annual average temperature is 18.2 °C, with mild winter temperatures (9.1 °C in January) and high summer mean temperatures (27–30 °C in August), and the mean annual rainfall is 605 mm (data from 1981–2010, AEMET – State weather agency). Low relative humidity and low rainfall normally occur (Domínguez-Bascón, Citation2002).
The other pollen sampling station was in Tulsa, Oklahoma, in the southern Great Plains of the United States. Tulsa (36° 15′ N, 95° 99′ W) is located at an elevation of 236 m a.s.l. and 740 km from the Gulf of Mexico, resulting in a continental climate with four distinctive seasons. According to a new global map of Köppen–Geiger climate classification, Tulsa has a humid subtropical climate (Cfa) (Beck et al. Citation2018). Tulsa’s climate is influenced by warm, humid air from the Gulf of Mexico. The mean annual temperature is 16.4 °C (Levetin Citation2021). The winter months are moderate, although sometimes the temperatures fall below zero for a short time. The average temperature in January is 2.5 °C, and that in July is 28.3 °C, although, in the summer months, July‒September, the temperature rises to 37 °C (National Weather Service, Citation2015). That explains why the amplitude of mean temperature during the year is about 25 °C . The mean annual rainfall is approximately 1030 mm (Levetin Citation2021). It can rain all year, with the spring months being the wettest. The spring rain occurs in showers and thunderstorms. The rain is steadier during the fall season, and in January and early March the highest amounts of snow are received (National Weather Service, Citation2015). The sampling station is on the campus of the University of Tulsa, in a residential area approximately 5 km east of the downtown business district and approximately 8 km northwest of the city's geographic centre (Levetin et al. Citation2000).
Aerobiology
Daily airborne pollen concentrations for Cupressaceae, Quercus and Poaceae were recorded during 2010–2014 (total five seasons) using standardised methods for pollen monitoring at the two stations with Hirst-type spore traps (Hirst Citation1952). However, in Córdoba, only four seasons were recorded for Cupressaceae, because the species Cupressus arizonica can start flowering during December, which was out of the dataset of the current study. The samplers were located on the rooftops of buildings (20 and 12 m above the ground in Córdoba and Tulsa, respectively). Followed the minimum requirements for European Aerobiology Society (EAS) sampler positioning (Galán et al. Citation2014). In Córdoba, pollen was counted in a minimum of 10% of the slide, according to EAS requirements (Galán et al. Citation2014), recommended terminology for aerobiological studies (Galán et al. Citation2017), and the European Normalization (EN 16868:2020). In Tulsa, pollen was counted in the daily slides with three longitudinal traverses for Poaceae and Cupressaceae (10.3% of the slide), and one for Quercus (3.4% of the slide), according to the recommendations of the American Academy of Allergy Asthma and Immunology (AAAAI Citation1997) and the Pan American Aerobiology Association (Rogers & Muilenberg Citation2000). Levetin (Citation2021), reported that the comparison of different counting methods (one, three and four traverses) had highly significant correlations for Quercus and other pollen types.
The three selected pollen types were chosen because they are present in the two research sites as previously described. These pollen types represented different species with different pollen season timing and intensity, mainly depending on the weather and climate.
The MPS of each pollen type was defined following Pfaar et al. (Citation2017), with some changes according to their seasonal curves. We worked with the hydrologic year (October–September) for Cupressaceae pollen because some species released pollen from October to December in Córdoba (Pérez-Badia et al. Citation2010). The MPSS for Cupressaceae and Quercus was defined as the day when pollen concentrations were ≥ 10 pollen grains/m3 of air per day for more than three consecutive days and ended when the pollen concentration dropped to ≤10 pollen grains/m3 of air per day. The MPSS was defined for Poaceae when the pollen concentration was ≥ 5 pollen grains/m3 of air per day for more than three consecutive days and ended when ≤ 5 pollen grains/m3 of air per day. This method was chosen because it defines the MPS, including the clinical and aerobiological points of view, and also takes into account the testimony of patients suffering from symptoms when the thresholds of pollen were low (Pfaar et al. Citation2017). This method has an advantage over the accumulating percentage (2.5%, 5% or 10%) (Pathirane, Citation1975) since the latter misses the low concentrations. The MPSS and the MPSE are presented as the day of the year (DOY) from the first day of January.
To define the MPS of each pollen type at the two sites, we calculated the average date of the pollen season start and end for all five years of the study. The MPS of each pollen type for each year separately was divided into two periods: the pre-peak period, from MPSS to the peak, and the post-peak period, from the first day after the peak day to the MPSE, because the pollination and dispersion are affected differently at the meteorological parameters at the beginning and the end of the pollination season (Vázquez et al. Citation2003).
Meteorological parameters
The meteorological parameters studied include the maximum, mean, and minimum temperature (°C), relative humidity (%), wind speed (m/s), and accumulated daily rainfall (mm). The meteorological data for Córdoba were supplied by the National Institute of Meteorology, located 4 km from the sampling point. Tulsa's meteorological data were provided by the main National Weather Service station in Tulsa, which is located 8 km from the Tulsa sampling site.
Statistical analysis
The Shapiro–Wilk normality test was applied to define whether the daily airborne pollen concentrations and the meteorological parameters were normally distributed in each site for pre-peak, post-peak, and the entire MPS. Data that were not normally distributed were transformed by log 10, and 1 was added to the pollen concentrations to avoid a negative log and then applied parametric statistics. The log 10 transformation was chosen because the pollen season can be easily characterised at the level of the original data (Limpert et al. Citation2008). Pearson correlation was performed between the pollen concentrations and the meteorological parameters during all periods to assess the significant correlations between the pollen concentrations and the different meteorological parameters.
Simple linear regression analysis was applied to predict the effects of the meteorological parameters on daily pollen concentrations for pre-peak, post-peak, and MPS, considering both the same day and the previous day’s meteorological parameters. Afterward, multiple regression analysis was applied using all the meteorological parameters with significant linear regression results. Multicollinearity was checked by the variance inflation factor (VIF) between the three temperature parameters. The highest determinant coefficient (R) value of one of the temperature parameters was included in the model. The meteorological indices were placed in the resulting model equation to obtain the expected pollen concentrations according to the equation of five years of measured research data (2010‒2014). Then the model was validated by correlating the expected and measured daily average pollen concentrations of the year 2015 to study the daily predicted pollen concentration level according to the model. All the statistical analysis stages were performed using SPSS 25 software.
Results
Main pollen season and pollen season index
The MPSS, main pollen season end (MPSE), peak-pollen values, and season pollen index (SPIn) for the three pollen types showed interannual variability (). The differences in the MPS at the two stations for the different pollen types differed in several aspects (, ). It is important to note that the peak days (values and date) were calculated for each year separately; therefore, the legend differs from the scale of the graph. First, the MPSS mostly occurred in a range of two weeks between Córdoba and Tulsa, except for Cupressaceae, for which the range was more than a month between the two sites. Second, the MPSE range was longer than the MPSS range, from seven weeks for Quercus to nine weeks for Poaceae. Third, differences in the main pollen season duration (MPSD) were also observed. Córdoba had the longer MPSD for Cupressaceae and Quercus, while the Poaceae season was longer in Tulsa. Fourth, differences in SPIn were observed between the different pollen types and the two sites. A longer pollen season was not always related to a higher SPIn, i.e. the MPSD of Cupressaceae and Quercus were longer in Córdoba than in Tulsa, but SPIn of Cupressaceae was higher in Tulsa and similar for Quercus; Poaceae had the higher SPIn in Córdoba but during a shorter pollen season than at Tulsa. More than that, the SPIn of the Poaceae was lower than those of trees (). Another aspect considered was the period of the pollen season, if pre-peak or post-peak. The season intensity was stronger during the shorter pre-peak period than during the longer post-peak period. Fifth, the pollen concentrations on peak dates also varied among the different sites and from year-to-year, but they mostly depended on the local phenology and weather.
Figure 1. MPS average for the years 2010‒2014. A. Cupressaceae in Córdoba. B. Cupressaceae in Tulsa. C. Quercus in Córdoba. D. Quercus in Tulsa. E. Poaceae in Córdoba. F. Poaceae in Tulsa. Note: The average peaks (day and values) in the text boxes were calculated from the peaks for each year and do not correspond to the scale on the X and Y axes.
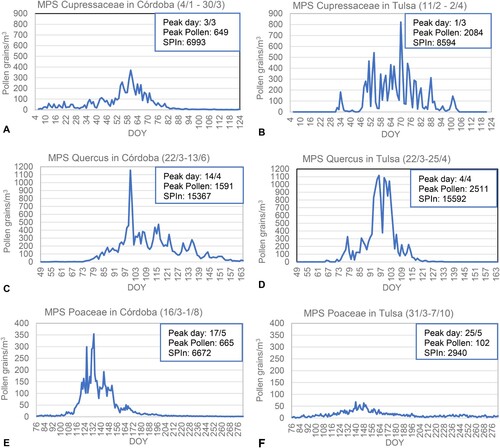
Table I. Pre-peak and post-peak periods of pollen concentration for years 2010‒2014.
Meteorological parameters
Average monthly values for the three important meteorological parameters: maximum, mean, and minimum temperature, relative humidity, and rainfall at the two sampling locations in the research period were calculated (). Tulsa had a larger temperature amplitude during the year in comparison to Córdoba. The maximum temperatures in Tulsa during the winter months (December–February) were lower than in Córdoba, while during the summer months (June–August), the minimum temperatures in Tulsa were higher than in Córdoba. Tulsa's average monthly minimum temperature was below zero from December to February. From April to September, the differences in the maximum temperature between the two sites are minor ().
Figure 2. Average meteorological parameters during the study period. A. Mean monthly temperature. B. Mean monthly relative humidity. C. Mean monthly rainfall.
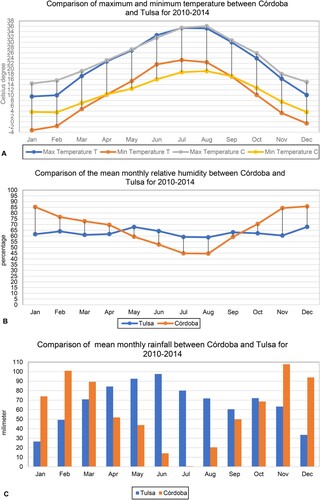
The average monthly relative humidity in Tulsa was stable throughout the year. The values range was from 59% to 68%; while in Córdoba, the fluctuations were more significant than in Tulsa. The winter months in Córdoba were particularly humid (86%), while the summer was arid (45%) ().
In Tulsa, it rained every month of the year; the rainiest months were April–July, compared to Córdoba, which did not rain in July, the rainiest months were November–March ().
Relationship between daily airborne pollen concentration and meteorological parameters
The results showed significant correlations between the daily airborne pollen concentrations and some meteorological parameters during the pre-peak, post-peak, and MPS periods (‒). However, it is important to note that the meteorological parameters explained a greater percentage of the variability of the pollen intensity during the pre-peak period than in the post-peak period. In general, there were significant positive correlations with temperature and negative correlations with relative humidity, rainfall, and wind speed during the pre-peak period, depending on the site and pollen type.
Table II. Pearson correlations coefficient between Cupressaceae pollen and meteorological parameters in the same days (first line) and the previous day's meteorological parameters (second line).
Table III. Pearson correlations coefficient between Quercus pollen and meteorological parameters in the same days (first line) and the previous day's meteorological parameters (second line).
Table IV. Pearson correlation coefficient between Poaceae pollen and meteorological parameters in the same days (first line) and the previous day's meteorological parameters (second line).
Significant correlations between daily pollen concentrations and the three temperature parameters were found at both sites for all pollen types. Moreover, significant correlations between the three pollen types and the previous day’s maximum temperature were also observed for Quercus in Córdoba.
Both sites found significant negative correlations between daily Cupressaceae pollen concentration on the same day and the previous day’s relative humidity. In Tulsa, the correlation coefficient values for Quercus were higher significantly with the relative humidity of the previous day. In Córdoba, the correlation coefficient values for Poaceae were higher significantly with the relative humidity of the same day, while in Tulsa, the correlation coefficient values for Poaceae were only with the relative humidity of the same day.
Negative correlations with rainfall were found for Cupressaceae in Córdoba during the pre-peak period and for Quercus during the post-peak period. The correlation coefficient values were higher significantly on the same day than with the previous day’s observations. In Tulsa, for Cupressaceae and Poaceae, the same results were observed for the rainfall during pre-peak period, but the higher correlation coefficient was with the previous day’s rainfall.
Negative correlations were observed in Córdoba for all three pollen types with wind speed, especially with the previous day’s wind speed for Cupressaceae during pre-peak and MPS periods, for Quercus and Poaceae during post-peak and MPS periods. In Tulsa, a positive correlation was observed for Quercus and wind speed on the same day and the previous day and Poaceae only on the same day.
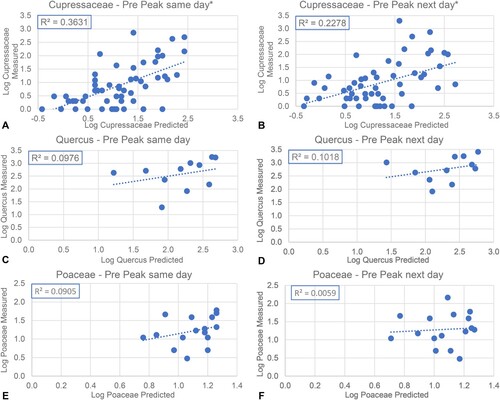
The results of the multiple regression analysis between pollen concentrations and meteorological parameters for the same day and the previous day support correlations results (‒). However, the coefficient of determination (R2) was low in many cases and varied between the different periods, sites, and pollen types. In Tulsa, the multiple regression analysis between the pollen concentrations and the previous day's meteorological parameters showed lower R2 values than the meteorological parameters for the same day. While in Córdoba, the R2 values were higher for the previous day’s meteorological parameters. High R2 values (> 0.3) were observed only in Tulsa during the pre-peak period when the temperatures were involved in the regression model. The validation was tested in the year 2015, which did not participate in the calibration. The validation comparing the measured and predicted pollen concentrations showed significant results for Cupressaceae in Tulsa during the pre-peak and the MPS periods. In both periods, predicting the same day was better than the previous day. The maximum temperature and relative humidity were involved in the prediction.
Table V. Multiple regression models for the Cupressaceae pollen concentration with the same day (first line) and the previous day (second line). For model validation, the predicted and observed concentrations were analyzed with Pearson correlation.
Table VI. Multiple regression models for the Quercus pollen concentration with the same day (first line) and the previous day (second line). For model validation, the predicted and observed concentrations were analysed with Pearson correlation.
Table VII. Multiple regression models for the Poaceae pollen concentration with the same day (first line) and the previous day (second line). For model validation, the predicted and observed concentrations were analyzed with Pearson correlation.
In Córdoba, the minimum temperature and the relative humidity of the previous day during the MPS period predicted the pollen concentration (, ). In Córdoba, the model for Quercus predicted the pollen concentrations in all three periods. The meteorological parameters of the previous day were used to predict the pollen concentration better than the meteorological parameters of the same day. The maximum temperature was the parameter that predicted the pollen concentration during the pre-peak period, while the minimum temperature and the rainfall predicted the pollen concentration during the post-peak and the MPS periods. The model did not predict the pollen concentration of Quercus in Tulsa. The model of Poaceae predicted the pollen concentration in the three periods, excepted the MPS of the previous day in Córdoba, with maximum temperature during the pre-peak and the MPS periods, and minimum temperature and relative humidity in the post-peak. In Tulsa, the model of Poaceae predicted the pollen concentrations only during the MPS with wind speed and rainfall of the same day.
Figure 3. Comparison between measured and predicted pollen during the pre-peak period in Córdoba. A. Cupressaceae same day. B. Cupressaceae next day. C. Quercus same day. D. Quercus next day. E. Poaceae same day. F. Poaceae next day.
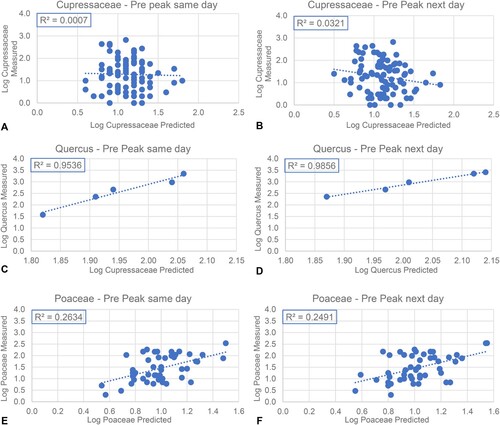
Figure 4. Comparison between measured and predicted pollen during the pre-peak period in Tulsa. A. Cupressaceae same day. B. Cupressaceae next day. C. Quercus same day. D. Quercus next day. E. Poaceae same day. F. Poaceae next day. *The maximum temperatures were close to 0 °C or even lower; hence the three points were negative.
Discussion
Aerobiology enables awareness of biogeographic and ecological information about bioaerosols, and this information can protect the human population from adverse health impacts (Benninghoff et al. Citation1991). Studies of common pollen types in different biogeographical areas can offer interesting results, even when different species contribute to airborne pollen. The presence of different species in the pollen spectrum and the differences in their phenological behaviour depend on climate and local weather and, consequently, will affect the MPS.
Prior studies of the MPS of these pollen types have been carried out in Córdoba (De Linares et al. Citation2021; López-Orozco et al. Citation2021) and Tulsa (Levetin Citation2021). Not all the results coincided with those of the current research since they depend on site-specific weather conditions, database period, or used a different method to determine the MPS. The temperatures a decade or two earlier were lower, and the precipitation regime probably differed (IPCC, Citation2022). These changes can explain the difference in findings between various studies in the same sites These different results emphasised the uniqueness of the pollen types in each environment and their relationship to meteorological parameters.
Cupressaceae
The MPS of Cupressaceae pollen started in Tulsa during the second week of February, while in Córdoba, the average MPS started at the beginning of January, but in the five years of research, the MPSS changed from year-to-year due to pollen emissions from Cupressus arizonica, which was three weeks before pollen release started in C. macrocarpa and C. sempervirens (Hidalgo et al. Citation2003). The MPSE occurred during March. Data from Córdoba and Tulsa in the present study showed no difference in the MPS timing compared to those in previous studies (Galán et al. Citation1998; Rogers & Levetin, Citation1998; Flonard et al. Citation2018; Velasco-Jimenez et al. Citation2020; Levetin Citation2021).
Quercus
The MPS of Quercus started during the fourth week of March at both sites. The MPSE occurred in Tulsa in the third week of April; in Córdoba, it occurred in the middle of June due to Q. suber flowering during late spring. Therefore, the MPS of Quercus was similar to that in previous research in both Córdoba and Tulsa (García-Mozo et al. Citation2000; García-Mozo et al. Citation2006b; López-Orozco et al. Citation2021; Levetin Citation1998). But recent findings from a long-term study suggested the MPSE on 1 May. It is about eight days later than it was before in Tulsa (Levetin Citation2021).
Poaceae
The MPS for Poaceae started during the last two weeks of March, but the MPSE was different at the two study sites. Comparing these results to those of a previous study in Córdoba, the MPSS and MPSE were similar to those in previous studies (Jato et al. Citation2006; García-Mozo et al. Citation2009; Ghitarrini et al. Citation2017). In Tulsa, the MPS started at the same time but ended earlier than in a previous study (Levetin et al. Citation2000); however, recent findings from a long-term study suggested the MPSS on 15 April (Levetin Citation2021).
MPS and SPIn
A few differences in the MPS were observed between the current study and previous studies. Differences between the two sites’ MPS, SPIn, and peak days depended on the species contributing to the pollen type in the local land cover distribution. The most important causes of differences in the MPSS and MPSE were the different species that contributed to the airborne pollen, e.g. the role of Cupressus arizonica in the Córdoba pollen curve, and the use of different methods for defining the MPS, i.e. in Tulsa for Poaceae, may also explain these differences.
In only five years, it is impossible to present trends in the MPSS and MPSE, but some papers have shown significant trends based on warming (Cecchi et al. Citation2010; Levetin Citation2021; López-Orozco et al. Citation2021). An earlier pollen season start had been observed in the case of Cupressaceae in Granada, south-eastern Spain (Velasco-Jiménez et al. Citation2020), in Quercus (García-Mozo et al. Citation2006b), and in Poaceae (Rojo et al. Citation2021). Other papers have shown a delayed pollen season start in Córdoba for Poaceae (Cebrino et al. Citation2016) and for Quercus when considering a longer period and during recent years (López-Orozco et al. Citation2021). There were also studies that had shown no change in the MPSS, i.e. for Quercus in Malaga, Spain (Recio et al. Citation2018). A comparison between studies from more than a decade ago and the current research indicated that there was still no change in the date of the MPSS for the three pollen types studied in Córdoba, and non-significant trends in Tulsa for Cupressaceae and Poaceae despite climate change, possibly because of the latitude and the temperatures. Phenology in warm regions at relatively low latitudes, like Córdoba and Tulsa, was less sensitive to temperature change than high latitude phenology where the temperature was normally lower. In cold regions, small temperature changes constituted a greater relative change in the thermal balance (Prevey et al. Citation2017), such as in Leiden, the Netherlands (Van Vliet et al. Citation2002), Bavaria, Germany (Rojo et al. Citation2021), or Fargo, Newark, Cherry Hill in the United States for Quercus (Zhang et al. Citation2014).
The MPS and the SPIn are dependent on geographical regions; climate conditions, especially temperature and rainfall (Galán et al. Citation2016; Ruiz-Valenzuela & Aguilera Citation2018; Recio et al. Citation2018), long-distance transport, species, and flowering season (Adams Citation1975; Rogers & Levetin Citation1998; Sofiev & Bergmann Citation2014). In general, the SPIn of trees is usually higher than that of herbaceous plants (Galán et al. Citation2016); one reason is that the samplers are located at tree height, much higher than herbaceous plants (Sofiev & Bergmann Citation2014). However, the MPS of Poaceae was longer than the MPS of trees because of the greater number of Poaceae species included in the same pollen type, but the SPIn of Poaceae was lower than the SPIn of Cupressaceae and Quercus.
Although Tulsa had a larger annual temperature amplitude than Córdoba, and the average of the minimum temperature during the winter months (December–February) was below 0 °C, the MPS of Quercus started in both sites at the same time, and the MPS for Poaceae started with two weeks difference between the two sites. The small difference in the MPSS is possibly due to only 1.6 degrees difference in latitude. The small difference in latitude between Córdoba and Tulsa affects little on day length. The day length can influence the plant's growth and development before the flowering start (Laaidi Citation2001). This factor joins the small temperature and relative humidity differences between the two sites and can create a small difference in the MPSS. The average monthly mean temperature and relative humidity differences were 1.6 °C and 12%, respectively. According to those findings, although environmental conditions influence each species, a particular threshold value for the MPSS of Quercus and Poaceae may be identified, but the issue needs to be further explored.
Relationship between airborne pollen concentrations and meteorological parameters
It is important to note that the discussion refers mainly to the pre-peak periods because lower correlation coefficients were observed in the post-peak period. The pollen concentration during the post-peak period also depends on other variables that facilitate reflow and extend the MPS duration in different ways, e.g. resuspension (Sánchez Mesa et al. Citation2003).
The relationship between pollen concentrations and meteorological parameters was considered in two ways: the first was to observe the impact of daily meteorological parameters on pollen concentrations, and the second, considering the impact of the previous day's meteorological parameters on pollen concentrations, which could indicate the ability to predict pollen concentrations one day before.
Same day temperature correlated positively with all three pollen types, especially during the pre-peak period. Similar results have also been obtained in previous studies for Quercus, Poaceae in western Europe (Cariñanos et al. Citation2004; Gioulekas et al. Citation2004; García-Mozo et al. Citation2006b; Jato et al. Citation2009) and Juniperus in Tulsa (Flonard et al. Citation2018). The impact of the previous day’s temperature on airborne pollen was not observed before. This study showed that temperature affects airborne pollen well into the next day.
Cupressaceae pollen at both sites, Poaceae and Quercus only in Tulsa, correlated negatively with relative humidity in both situations (the same day and the previous day). But in a prior study in Tulsa for Cupressaceae, the significant result was for the post-peak (Flonard et al. Citation2018) and not for the pre-peak as in the current study, probably because the long period research had much more data which reinforces the trend that the most humid months are between March and June, the post-peak period of Cupressaceae. The same negative correlations with relative humidity were found in many studies worldwide but not necessarily in Córdoba and Tulsa; e.g. Cupressaceae, Quercus, and Poaceae, in Toledo, Spain (García-Mozo et al. Citation2006a; Sabariego et al. Citation2012), Cupressaceae in both Porto, Portugal (Gomes et al. Citation2019) and Badajoz, Spain (Monroy-Colín et al. Citation2020), Quercus in Malaga, Spain (Recio et al. Citation2018) and in Mexico City (Calderón-Ezquerro et al. Citation2018), and for Poaceae in Sydney, Australia (Stennett & Beggs, Citation2004), in Tetouan, northwest Morocco (Aboulaich et al. Citation2013), and in Tel-Aviv, Israel (Helfman-Hertzog et al. Citation2018).
Frequent rainfall during the pollen season usually causes low SPIn because it washes the pollen to the ground and cleans the atmosphere (Díaz de la Guardia et al. Citation2006; Tormo-Molina et al. Citation2010). In this study, airborne pollen concentrations were lower or did not even exist at all on rainy days. Additionally, the lack of water availability before the pollination period limits the flowering intensity, especially in herbaceous plants (Galán et al. Citation1995).
Wind speed had no uniform effect on airborne pollen intensity because it depends on the local topography and weather. It is important to note that the pollen of a few Cupressaceae species in Tulsa was detected over long distances (Rogers & Levetin Citation1998), which increased the pollen intensity.
Temperature and relative humidity were the most included parameters in multiple regression models for daily pollen forecasting. Temperature, mainly maximum temperature, predicted pollen concentrations for Cupressus in south-western Spain (Silva-Palacios et al. Citation2016), for Quercus in Córdoba (López-Orozco et al. Citation2021), and for Poaceae pollen in western and north-western Europe (de Weger et al. Citation2014; Rojo et al. Citation2017; Gessman Citation2017). Rainfall was the third most important parameter for predicting pollen concentrations in south-western Spain (Silva-Palacios et al. Citation2016). In Tulsa, the rainfall had less impact on Cupressaceae pollen, possibly due to the rain regime during spring (Flonard et al. Citation2018). The ability to predict pollen concentrations during pre-peak period with temperature from the previous day was close to the ability to predict it with the temperature of the same day, but with some exceptions. Considering the above, a weather forecast can predict the pollen concentrations one day ahead.
Conclusions
Since each research site has a unique environment with its own species from the same families, the SPIn and the MPS at each site were influenced by the local meteorological parameters and by the local species. Additionally, there are differences in the SPIn between the years at the same site.
Considering the local species and the different meteorological parameters, the differences in the MPSS between the two sites were slight, except for the MPSS of Cupressaceae in Córdoba. In Córdoba, the Cupressus arizonica can start flowering in December, earlier than the other species in Córdoba and Tulsa.
The relationships between pollen concentration and temperature, and relative humidity were uniform at the sites studied.
When the maximum temperature and relative humidity were similar in both sites, the MPSS of Quercus was the same, and the MPSS of Poaceae was two weeks apart. The Poaceae MPSS in Córdoba was two weeks before Tulsa.
The same day's meteorological parameters had a greater impact on the pollen concentration than the previous day's meteorological parameters in Tulsa. In Córdoba, the previous day's meteorological parameters also had an impact on the pollen concentrations.
A local model could be developed with the temperature, relative humidity, and rainfall at the two sites that predict the pollen concentrations based on local meteorological parameters.
Acknowledgements
The authors want to thank Claudia Owens, a technician, and several students in the Aerobiology Laboratory at the University of Tulsa, Oklahoma, USA, and the working group on Aerobiology and Phenology at the University of Córdoba, Spain, who helped with the pollen analysis.
Disclosure statement
No potential conflict of interest was reported by the author(s).
Additional information
Funding
References
- AAAAI. 1997. Aeroallergen monitoring network 1996 pollen and spore report. Milwaukee, WI: AAAAI.
- Aboulaich N, Achmakh L, Bouziane H, Trigo MM, Recio M, Kadiri M, Cabezudo B, Riadi H, Kazzaz M. 2013. Effect of meteorological parameters on Poaceae pollen in the atmosphere of Tetouan (NW Morocco). International Journal of Biometeorology 57: 197–205. doi: 10.1007/s00484-012-0566-2
- Adams RP. 1975. Gene flow versus selection pressure and ancestral differentiation in the composition of species. Analysis of populational variation of Juniperus ashei Buch. using terpenoid data. Journal of Molecular Evolution 5: 177–185. doi: 10.1007/BF01741240
- Adam RP, Bartel JA, Price RA. 2009. A new genus, Hesperocyparis for the cypresses of the Western Hemisphere (Cupressaceae). Phytologia 91: 160–185.
- Adams-Groom B, Selby K, Derrett S, Frisk CA, Pashley CH, Satchwell J, King D, McKenzie G, Neilson R. 2022. Pollen season trends as markers of climate change impact: bBetula, Quercus, and Poaceae. Science of the Total Environment 831: 154882. doi:10.1016/j.scitotenv.2022.154882.
- Beck HE, Zimmermann NE, McVicar TR, Vergopolan N, Berg A, Wood EF. 2018. Data descriptor: present and future Koppen–Geiger climate classification maps at 1-km resolution. Scientific Data 5: 3, 5. doi:10.1038/sdata.2018.214.
- Beggs PJ. 2015. Environmental allergens: From asthma to hay fever and beyond. Current Climate Change Reports 1: 176–184. doi:10.1007/s40641-015-0018-2.
- Benninghoff WS. 1991. Aerobiology and its significance to biogeography and ecology. Grana 30: 9–15. doi: 10.1080/00173139109427762
- Bortenschlager S. 1990. Aspects of pollen morphology in the Cupressaceae. Grana 29: 129–137. doi: 10.1080/00173139009427743
- Calderón-Ezquerro MC, Martinez-Lopez B, Guerrero-Guerra C, López-Espinosa ED, Cabos-Narvaez WD. 2018. Behaviour of Quercus pollen in the air, determination of its sources and transport through the atmosphere of Mexico City and conurbated areas. International Journal of Biometeorology 62: 1721–1732. doi: 10.1007/s00484-018-1572-9
- Cariñanos P, Galán C, Alcázar P, Eugenio Domíınguez E. 2004. Airborne pollen records response to climatic conditions in arid areas of the Iberian peninsula. Environmental and Experimental Botany 52: 11–22. doi: 10.1016/j.envexpbot.2003.11.008
- Cebrino J, Galán C, Domínguez-Vilches E. 2016. Aerobiological and phenological study of the main Poaceae species in Córdoba City (Spain) and the surrounding hills. Aerobiologia 32: 595–606. doi: 10.1007/s10453-016-9434-6
- Cecchi L, D’Amato G, Ayres JG, Galán C, Forastiere F, Forsberg B, Gerritsen J, Nunes C, Behrendt H, Akdis C, Dahl R, Annesi-Maesano I. 2010. Projections of the effects of climate change on allergic asthma: The contribution of aerobiology. Allergy 65: 1073–1081.
- Charpin D, Calleja M, Lahoz C, Pichot C, Waisel Y. 2005. Allergy to cypress pollen. Allergy 60: 293–301. doi: 10.1111/j.1398-9995.2005.00731.x
- Charpin D, Pichot C, Belmonte J, Sutra JP, Zidkova J, Chanez P, Shahali Y, Sénéchal H, Poncet P. 2019. Cypress pollinosis: From tree to clinic. Clinical Reviews in Allergy & Immunology 56: 174–195. doi: 10.1007/s12016-017-8602-y
- Corden J, Millington W. 1999. A study of Quercus pollen in the Derby area, U.K. Aerobiologia 15: 29–37. doi: 10.1023/A:1007580312019
- De Linares C, Pilar Plaza M, Valle A, Alcázar P, de la Guardia C D, Galán C. 2021. Airborne Cupressaceae pollen and its major allergen, cup a 1, in urban green areas of southern Iberian peninsula. Forests 12: 254. doi: 10.3390/f12020254
- de Weger LA, Thijs Beerthuizen T, Pieter S, Hiemstra PS, Jacob K, Sont JK. 2014. Development and validation of a 5-day-ahead hay fever forecast for patients with grass-pollen-induced allergic rhinitis. International Journal of Biometeorology 58: 1047–1055.
- Díaz de la Guardia C, Alba F, de Linares C, Nieto-Lugilde D, López Caballero J. 2006. Aerobiological and allergenic analysis of Cupressaceae pollen in Granada (southern Spain). Journal of Investigational Allergology and Clinical Immunology 16: 24–33.
- Domínguez-Bascón P. 2002. Clima regionaly microclimas urbanos en la provincia de Córdoba. Córdoba: Servicio de Publicaciones de la Universidad de Córdoba. (In Spanish.)
- Dvorin DJ, Lee JJ, Belecanech GA, Goldstein MF, Dunshy EH. 2001. A comparative, volumetric survey of airborne pollen in Philadelphia, Pennsylvania (1991-1997) and Cherry Hill, New Jersey (1995-1997). Annals of Allergy, Asthma & Immunology 87: 397–404. doi: 10.1016/S1081-1206(10)62921-3
- Fernández-González M, González-Fernández E, Ribeiro H, Abreu I, Rodríguez-Rajo FJ. 2020. Pollen production of Quercus in the north-western Iberian peninsula and airborne pollen concentration trends during the last 27 years. Forests 11: 702. doi: 10.3390/f11060702
- Flonard M, Lo E, Levetin E. 2018. Increasing Juniperus virginiana L. pollen in the Tulsa atmosphere: Long-term trends, variability, and influence of meteorological conditions. International Journal of Biometeorology 62: 229–241. doi: 10.1007/s00484-017-1444-8
- Flora of Oklahoma Project. 2020. Oklahoma Biological Survey. https://www.floraoklahoma.org.
- Galán C, Alcázar P, Oteros J, García-Mozo H, Aira MJ, Belmonted J, de la Guardia C D, Fernández-González D, Gutierrez-Bustillo M, Moreno-Graui S, Pérez-Badía R, Rodríguez-Rajo J, Ruiz-Valenzuela L, Tormo R, Trigo MM, Domínguez-Vilches E. 2016. Airborne pollen trends in the Iberian peninsula. Science of the Total Environment 550: 53–59. doi: 10.1016/j.scitotenv.2016.01.069
- Galán C, Ariatti A, Bonini M, Clot B, Crouzy B, Dahl A, Fernandez-González D, Frenguelli G, Gehrig R, Isard S, Levetin E, Li DW, Mandrioli P, Rogers CA, Thibaudon M, Sauliene I, Skjoth C, Smith M, Sofiev M. 2017. Recommended terminology for aerobiological studies. Aerobiologia 33: 293–295. doi: 10.1007/s10453-017-9496-0
- Galán C, Domínguez E. 2020. La Botánica. In: La Ciencia en la Córdoba Andalusí, 1st ed. Córdoba, Spain: Real Academia de Córdoba, Litopress Córdoba.
- Galán C, Emberlin J, Dominguez E, Bryant RH, Villamandos F. 1995. A comparative analysis of daily variations in the Gramineae pollen counts at Córdoba, Spain and London, UK. Grana 34: 189–198. doi: 10.1080/00173139509429042
- Galán C, Fuillerat MJ, Comtois P, Domínguez-Vilches E. 1998. Bioclimatic factors affecting daily Cupressaceae flowering in southwest Spain. International Journal of Biometeorology 41: 95–100. doi: 10.1007/s004840050059
- Galán C, Smith M, Thibaudon M, Frenguelli G, Oteros J, Gehrig R, Berger U, Clot B, Brandao R, EAS QC Working Group. 2014. Pollen monitoring: minimum requirements and reproducibility of analysis. Aerobiologia 30: 385–395. doi: 10.1007/s10453-014-9335-5
- Galveias A, Costa AR, Bortoli D, Alpizar-Jara R, Salgado R, João Costa M, Antunes CM. 2021. Cupressaceae pollen in the city of Évora, south of Portugal: Disruption of the pollen during air transport facilitates allergen exposure. Forests 12: 64. doi: 10.3390/f12010064
- García-Mozo H, Domínguez-Vilches E, Galán C. 2007a. Airborne allergenic pollen in a natural area–Hornachuelos natural park, Córdoba, southern Spain. Annals of Agricultural and Environmental Medicine 14: 109–115.
- García-Mozo H, Galán C, Belmonte J, Bermejo D, Candau P, de la Guardia C D, Elvira B, Gutiérez M, Jato V, Silva I. 2009. Predicting the start and peak dates of the Poaceae pollen season in Spain using process-based models. Agricultural and Forest Meteorology 149: 256–262. doi: 10.1016/j.agrformet.2008.08.013
- García-Mozo H, Galán C, Gomez-Casero MT, Domínguez-Vilches E. 2000. A comparative study of different temperature accumulation methods for predicting the start of the Quercus pollen season in Córdoba (south west Spain). Grana 39: 194–199. doi: 10.1080/00173130051084322
- García-Mozo H, Galán C, Jato V, Belmonte J, de la Guardia CD, Fernández D, Gutiérrez M, Aira MJ, Roure JM, Ruiz L, Trigo MM, Domínguez-Vilches E. 2006b. Quercus pollen season dynamics in the Iberian peninsula: Response to meteorological parameters and possible consequences of climate change. Annals of Agricultural and Environmental Medicine 13: 209–224.
- García-Mozo H, Gómez-Casero MT, Domínguez-Vilches E, Galán C. 2007b. Influence of pollen emission and weather-related factors on variations in holm-oak (Quercus ilex subsp. ballota) acorn production. Environmental and Experimental Botany 61: 35–40. doi: 10.1016/j.envexpbot.2007.02.009
- García-Mozo H, Mestre A, Galán C. 2010. Phenological trends in southern Spain: A response to climate change. Agricultural and Forest Meteorology 150: 575–580. doi: 10.1016/j.agrformet.2010.01.023
- García-Mozo H, Perez-Badia R, Fernandez-Gonzalez F, Galán C. 2006a. Airborne pollen sampling in Toledo, central Spain. Aerobiologia 22: 55–66. doi: 10.1007/s10453-005-9015-6
- García-Mozo H, Yaezel L, Oteros J, Galán C. 2013. Statistical approach to the analysis of olive long-term pollen season trends in southern Spain. Science of the Total Environment 473–474: 103–109. doi: 10.1016/j.scitotenv.2013.11.142
- García-Mozo H. 2017. Poaceae pollen as the leading aeroallergen worldwide: A review. Allergy 72: 1849–1858. doi: 10.1111/all.13210
- Geller-Bernstein C, Waisel Y, Lahoz C. 2000. Environment and sensitization to cypress in Israel. Allergie et Immunologie (Paris) 32: 92–93.
- Gessman D. 2017. Pollen Forecasting in Sarasota, Florida. Graduate Theses and Dissertations. University of South Florida.
- Ghitarrini S, Galán C, Frenguelli G, Tedeschini E. 2017. Phenological analysis of grasses (Poaceae) as a support for the dissection of their pollen season in Perugia (central Italy). Aerobiologia 33: 339–349. doi: 10.1007/s10453-017-9473-7
- Gioulekas D, Papakosta D, Damialis A, Spieksma F, Giouleka P, Patakas D. 2004. Allergenic pollen records (15 years) and sensitization in patients with respiratory allergy in Thessaloniki, Greece. Allergy 59: 174–184. doi: 10.1046/j.1398-9995.2003.00312.x
- Gomes C, Ribeiro H, Abreu I. 2019. Aerobiology of Cupressaceae in Porto city, Portugal. Aerobiologia 35: 97–103. doi: 10.1007/s10453-018-9543-5
- Grewling Ł, Šikoparija B, Skjøth CA, Radišic P, Apatini D, Magyar D, Paldy A, Yankova R, Sommer J, Kasprzyk I, Myszkowska D, Uruska A, Zimny M, Puc M, Jager S, Smith M. 2012. Variation in Artemisia pollen seasons in central and eastern Europe. Agricultural and Forest Meteorology 160: 48–59. doi: 10.1016/j.agrformet.2012.02.013
- Guerra F, Daza JC, Miguel R, Galán C, Dominguez E, Sanchez-Gijo P. 1996. Sensitivity to Cupressus. Allergenic significance in Cordoba (Spain). Journal of Investigational Allergology & Clinical Immunology 6: 117–120.
- Helfman I, Waisel Y, Kutiel H. 2011. Relationship between weather conditions and release of allergen pollen and spores to the air in Haifa. Geography Research Forum 31: 24–38.
- Helfman-Hertzog I, Kutiel H, Levetin E, Galán C. 2018. The impact of Sharav weather conditions on airborne pollen in Jerusalem and Tel Aviv (Israel). Aerobiologia 34: 497–511. doi: 10.1007/s10453-018-9526-6
- Hidalgo PJ, Galán C, Domínguez E. 2003. Male phenology of three species of Cupressus correlation with airborne pollen. Trees 17: 336–344. doi: 10.1007/s00468-002-0243-x
- Hirst JM. 1952. An automatic volumetric spore trap. Annals of Applied Biology 39: 257–265. doi: 10.1111/j.1744-7348.1952.tb00904.x
- IPCC. 2022. Intergovernmental Panel on Climate Change. Climate Change 2022 – Impacts, Adaptation and Vulnerability, Summary for Policymakers. Contribution of Working Group II to the Sixth Assessment Report of the Intergovernmental Panel on Climate Change [Pörtner HO, Roberts DC, Tignor M, Poloczanska ES, Mintenbeck K, Alegría A, Craig M, Langsdorf S, Löschke S, Möller V, Okem A, Rama B (eds.)]. Cambridge, UK and New York, NY: Cambridge University Press, 3056 pp., doi:10.1017/9781009325844
- Jato V, Rodríguez-Rajo FJ, Alcazar P, De Nuntiis P, Galán C, Mandrioli P. 2006. May the definition of pollen season influence aerobiological results? Aerobiologia 22: 13–25. doi: 10.1007/s10453-005-9011-x
- Jato V, Rodríguez-Rajo FJ, Méndez J, Aira MJ. 2002b. Phenological behaviour of Quercus in Ourense (NW Spain) and its relationship with the atmospheric pollen season. International Journal of Biometeorology 46: 176–184. doi: 10.1007/s00484-002-0132-4
- Jato V, Rodríguez-Rajo FJ, Seijo MC, Aira MJ. 2009. Poaceae pollen in Galicia (N.W. Spain): characterization and recent trends in atmospheric pollen season. International Journal of Biometeorology 53: 333–344. doi: 10.1007/s00484-009-0220-9
- Kizilpinar I, Dogan C, Artac H, Reisli I, Pekcan S. 2012. Pollen grains in the atmosphere of Konya (Turkey) and their relationship with meteorological factors, in 2008. Turkish Journal of Botany 36: 344–357.
- Laaidi M. 2001. Forecasting the start of the pollen season of Poaceae: Evaluation of some methods based on meteorological factors. International Journal of Biometeorology 45: 1–7. doi: 10.1007/s004840000079
- León-Ruiz E, Alcázar P, Domínguez-Vilches E, Galán C. 2011. Study of Poaceae phenology in a Mediterranean climate. Which species contribute most to airborne pollen counts? Aerobiologia 27: 37–50. doi: 10.1007/s10453-010-9174-y
- Levetin E, Buck P. 1980. Hay fever plants in Oklahoma. Annals of Allergy & Immunology 45(1): 26–32.
- Levetin E, Buck P. 1986. Evidence of mountain cedar pollen in Tulsa. Annals of Allergy & Immunology 56: 295–299.
- Levetin E, Rogers CA, Hall SA. 2000. Comparison of pollen sampling with a Burkard spore trap and a Tauber trap in a warm temperate climate. Grana 39: 294–302. doi: 10.1080/00173130052504333
- Levetin E. 1998. A long-term study of winter and early spring tree pollen in the Tulsa, Oklahoma atmosphere. Aerobiologia 14: 21–28. doi: 10.1007/BF02694591
- Levetin E. 2021. Aeroallergens and climate change in Tulsa, Oklahoma: Long-term trends in the south central United States. Frontiers in Allergy 2: 726445. doi: 10.3389/falgy.2021.726445
- Limpert E, Burke J, Galán C, del Mar Trigo M, West JS, Stahel WA. 2008. Data, not only in aerobiology: how normal is the normal distribution? Aerobiologia 24: 121–124. doi: 10.1007/s10453-008-9092-4
- Lo F, Bitz CM, Hess JJ. 2021. Development of a Random Forest model for forecasting allergenic pollen in North America. Science of the Total Environment 773: 145590. doi: 10.1016/j.scitotenv.2021.145590
- López-Orozco R, García-Mozo H, Oteros J, Galán C. 2021. Long-term trends in atmospheric Quercus pollen related to climate change in southern Spain: A 25-year perspective. Atmospheric Environment 262: 118637. doi: 10.1016/j.atmosenv.2021.118637
- Mandrioli P, De Nuntiis P, Ariatti A, Magnani R. 2000. Cypress in Italy: Landscape and pollen monitoring. Allergie et Immunologie 31: 116–121.
- Marchetti P, Pesce G, Villani S, Antonicelli L, Ariano R, Attena F, Bono R, Bellisario V, Fois A, Gibelli N, Nicolis M, Olivieri M, Pirina P, Scopano E, Siniscalco C, Verlato G, Marcon A. 2017. Pollen concentrations and prevalence of asthma and allergic rhinitis in Italy: Evidence from the GEIRD study. Science of the Total Environment 584-585: 1093–1099. doi: 10.1016/j.scitotenv.2017.01.168
- Mohanty RP, Buchheim MA, Anderson J, Levetin E. 2017. Molecular analysis confirms the long-distance transport of Juniperus ashei pollen. Plos One 12: e0173465. doi: 10.1371/journal.pone.0173465
- Monroy-Colín A, Maya-Manzano JM, Silva-Palacios I, Tormo-Molina R, Pecero-Casimiro R, Gonzalo-Garijo A, Fernández-Rodríguez S. 2020. Phenology of Cupressaceae urban infrastructure related to its pollen content and meteorological variables. Aerobiologia 36: 459–479. doi: 10.1007/s10453-020-09645-9
- National Weather Service. 2015. National Oceanic and atmospheric administration Tulsa Climate Overview (weather.gov). http://www.weather.gov/tsa/climo_tulcliover.
- Papa G, Romano A, Quarantino D, Di Fonso M, Viola M, Artesani MC, Serniac S, Di Gioacchinod M, Venuti A. 2001. Prevalence of sensitization to Cupressus sempervirens: A 4-year retrospective study. Science of the Total Environment 270: 83–87. doi: 10.1016/S0048-9697(00)00795-6
- Pathirane L. 1975. Graphical determination of the main pollen season. Pollen & Spores 17: 609–610.
- Pedrosa M, Guerrero-Sanchez VM, Canales-Bueno N, Loli-Ausejo D, Castillejo M´A, Quirce S, Jorrin-Novo JV, Rodriguez-Perez R. 2020. Quercus ilex pollen allergen, Que i 1, responsible for pollen food allergy syndrome caused by fruits in Spanish allergic patients. Clincal and Experimental Allergy 50: 815–823. doi: 10.1111/cea.13679
- Pérez-Badia R, Rapp A, Morales C, Sardinero S, Galán C, García-Mozo H. 2010. Pollen spectrum and risk of pollen allergy in central Spain. Annals of Agricultural and Environmental Medicine 17: 139–151.
- Peternel P, Srnec L, Culig J, Hrga I, Hercog P. 2006. Poaceae pollen in the atmosphere of Zagreb (Croatia), 2002-2005. Grana 45: 130–136. doi: 10.1080/00173130600662114
- Pfaar O, Bastl K, Berger U, Buters J, Calderon MA, Clot B, Darsow U, Demoly P, Durham S R, Galán C, Gehrig R, van Wijk R G, Jacobsen L, Klimek L, Sofiev M, Thibaudon M, Bergmann KC. 2017. Defining pollen exposure times for clinical trials of allergen immunotherapy for pollen-induced rhinoconjunctivitis – an EAACI position paper. Allergy 72: 713–722. doi: 10.1111/all.13092
- Picornell A, Oteros J, Trigo MM, Gharbi D, Docampo Fernández S, Melgar Caballero M, Toro FJ, García-Sánchez J, Ruiz-Mata R, Cabezudo B, Recio M. 2019. Increasing resolution of airborne pollen forecasting at a discreate sampled area in the southwest Mediterranean Basin. Chemosphere 234: 668–681. doi: 10.1016/j.chemosphere.2019.06.019
- Prevey J, Vellend M, Ruger N, Hollister R, Bjorkman AD, Myers-Smith IH, Elmendorf SC, Clark K, Cooper EJ, Elberling B, Fosaa AM, Henry GHR, Hoye T, Jonsdottir IS, Klanderud K, Evesque EL, Mauritz M, Molau U, Natali SM, Oberbauer SF, Panchen ZA, Post E, Rumpf SB, Troxler N, Welker JM, Rixen C. 2017. Greater temperature sensitivity of plant phenology at colder sites: Implication for convergence across northern latitudes. Global Change Biology 23: 2660–2671. doi: 10.1111/gcb.13619
- Rahman A, Rahaman Khan H, Luo C, Yang Z, Ke J, Jiang W. 2021. Variations in airborne pollen and spores in urban Guangzhou and their relationships with meteorological variables. Heliyon 7: e08379. doi: 10.1016/j.heliyon.2021.e08379
- Recio M, Picornell A, Trigoa MM, Gharbia D, García-Sánchezb J, Cabezudoa B. 2018. Intensity and temporality of airborne Quercus pollen in the southwest Mediterranean area: Correlation with meteorological and phenoclimatic variables, trends and possible adaptation to climate change. Agricultural and Forest Meteorology 250–251: 308–318. doi: 10.1016/j.agrformet.2017.11.028
- Rodríguez de la Cruz D, Sánchez-Reyes E, Sánchez- Sánchez J. 2015. A contribution to the knowledge of Cupressaceae airborne pollen in the middle west of Spain. Aerobiologia 31: 435–444. doi: 10.1007/s10453-015-9376-4
- Rogers CA, Levetin E. 1998. Evidence of long-distance transport of mountain cedar pollen into Tulsa, Oklahoma. International Journal of Biometeorology 42: 65–72. doi: 10.1007/s004840050086
- Rogers CA, Muilenberg ML. 2000. Comprehensive guidelines for the operation of Hirst-type suction bioaerosol samplers. Standardized Protocol of the Pan American Aerobiology Association, Boston, MA. https://www.paaa.org.
- Rojo J, Picornell A, Oteros J, Werchan M, Werchan B, Bergmann KC, Smith M, Weichenmeier I, Schmidt-Weber CB, Buters J. 2021. Consequences of climate change on airborne pollen in Bavaria, central Europe. Regional Environmental Change 21: 9. doi: 10.1007/s10113-020-01729-z
- Rojo J, Rapp A, Lara B, Fernández-González F, Pérez-Badia R. 2015. Effect of land uses and wind direction on the contribution of local sources to airborne pollen. Science of the Total Environment 538: 672–682. doi: 10.1016/j.scitotenv.2015.08.074
- Rojo J, Rapp A, Lara B, Sabariego S, Fernández-González F, Pérez-Badia R. 2016. Characterization of the airborne pollen spectrum in Guadalajara (central Spain) and estimation of the potential allergy risk. Environmental Monitoring and Assessment 188: 130. doi: 10.1007/s10661-016-5129-2
- Rojo J, Rivero R, Romero-Morte J, Fernández-González F, Pérez-Badia R. 2017. Modeling pollen time series using seasonal-trend decomposition procedure based on LOESS smoothing. International Journal of Biometeorology 61: 335–348. doi: 10.1007/s00484-016-1215-y
- Ruiz-Valenzuela L, Aguilera F. 2018. Trends in airborne pollen and pollen-season-related features of anemophilous species in Jaen (south Spain): A 23-year perspective. Atmospheric Environment 180: 234–243. doi: 10.1016/j.atmosenv.2018.03.012
- Sabariego S, Cuesta P, Fernández-González F, Pérez-Badia R. 2012. Models for forecasting airborne Cupressaceae pollen levels in central Spain. International Journal of Biometeorology 56: 253–258. doi: 10.1007/s00484-011-0423-8
- Sánchez Mesa JA, Smith M, Emberlin J, Allitt U, Caulton E, Galán C. 2003. Characteristics of grass pollen seasons in areas of southern Spain and the United Kingdom. Aerobiologia 19: 243–250. doi: 10.1023/B:AERO.0000006597.44452.a3
- Scevková J, Vasková Z, Sepsiová R, Dusicka J, Kovác J. 2020. Relationship between Poaceae pollen and Phl p 5 allergen concentrations and the impact of weather variables and air pollutants on their levels in the atmosphere. Heliyon 6: e04421. doi: 10.1016/j.heliyon.2020.e04421
- Silva-Palacios I, Fernández-Rodríguez S, Durán-Barroso P, Tormo-Molina R, Maya-Manzano JM, Gonzalo-Garijo A. 2016. Temporal modelling and forecasting of the airborne pollen of Cupressaceae on the southwestern Iberian peninsula. International Journal of Biometeorology 60: 297–306. doi: 10.1007/s00484-015-1026-6
- Sofiev M, Bergmann KC. 2014. Allergenic pollen: A review of the production, release, distribution and health impacts. Dordrecht: Springer.
- Soreng RJ, Peterson PM, Romaschenko K, Davidse G, Zuloaga FO, Judziewicz EJ, Filgueiras TS, Davis JI, Morrone O. 2015. A worldwide phylogenetic classification of the Poaceae (Gramineae). Journal of Systematics and Evolution 53: 117–137. doi: 10.1111/jse.12150
- Stennett PJ, Beggs PJ. 2004. Pollen in the atmosphere of Sydney, Australia, and relationships with meteorological parameters. Grana 43: 209–216. doi: 10.1080/00173130410000758
- Testi L, Villalobos FJ, Orgaz F, Fereres E. 2006. Water requirements of olive orchards: I simulation of daily evapotranspiration for scenario anaylsis. Irrigation Science 24: 69–79. doi: 10.1007/s00271-005-0011-y
- Tormo-Molina R, Gonzalo-Garijo MA, Silva-Palacios I, Muñoz Rodríguez AF. 2010. General trends in airborne pollen production and pollination periods at a Mediterranean site (Badajoz, southwest Spain). Journal of Investigational Allergology and Clinical Immunology 20: 567–574.
- Tutin TG, Burges NA, Chater AO, Edmondson JR, Heywood VH, Moore DM, Valentine DH, Walters SM, Webb DA. 1993. Flora Europaea (Psilotaceae to Platanaceae) 2nd ed. 45–46. Cambridge: Cambridge University Press.
- Tutin TG, Heywood VH, Burges NA, Valentine DH, Walters SM, Webb DA. 1964. Flora Europaea. Volume 1. Lycopodiaceae to Platanaceae. Cambridge: Cambridge University Press.
- Van Vliet AJH, Overeem A, De Groot RS, Jacobs AFG, Spieksma FTM. 2002. The influence of temperature and climate change on the timing of pollen release in the Netherland. International Journal of Climatology 22: 1757–1767. doi: 10.1002/joc.820
- Vázquez LM, Galán C, Domínguez-Vilches E. 2003. Influence of meteorological parameters on Olea pollen concentrations in Córdoba (south-west Spain). International Journal of Biometeorology 48: 83–90. doi: 10.1007/s00484-003-0187-x
- Velasco-Jiménez MJ, Alcázar P, de la Guardia CD, del Mar Trigo M, de Linares C, Criado MR, Galán C. 2020. Pollen season trends in winter flowering trees in south Spain. Aerobiologia 36: 213–224. doi: 10.1007/s10453-019-09622-x
- Velasco-Jiménez MJ, Alcázar P, Domínguez-Vilches E, Galán C. 2013. Comparative study of airborne pollen counts located in different areas of the city of Córdoba (southwestern Spain). Aerobiologia 29: 113–120. doi: 10.1007/s10453-012-9267-x
- Velasco-Jiménez MJ, Alcázar P, Valle P, Trigo MM, Minero F, Domínguez-Vilches E, Galán C. 2014. Aerobiological and ecological study of the potentially allergenic ornamental plants in south Spain. Aerobiologia 30: 91–101. doi: 10.1007/s10453-013-9311-5
- Volkova O, Severova E. 2019. Poaceae pollen season and association with meteorological parameters in Moscow, Russia, 1994-2016. Aerobiologia 35: 73–84. doi: 10.1007/s10453-018-9540-8
- Zemmer F, Dahl A, Galán C. 2022. The duration and severity of the allergic pollen season in Istanbul, and the role of meteorological factors. Aerobiologia 38: 195–215. doi: 10.1007/s10453-022-09742-x
- Zhang Y, Bielory L, Cai T, Zhongyuan Mi Z, Georgopoulos P. 2015b. Predicting onset and duration of airborne allergenic pollen season in the United States. Atmospheric Environment 103: 297–306. doi: 10.1016/j.atmosenv.2014.12.019
- Zhang Y, Bielory L, Georgopoulos PG. 2014. Climate change effect on Betula (birch) and Quercus (oak) pollen seasons in the United States. International Journal of Biometeorology 58: 909–919. doi: 10.1007/s00484-013-0674-7
- Zhang Y, Bielory L, Mi Z, Cai T, Robock A, Georgopoulos P. 2015a. Allergenic pollen season variations in the past two decades under changing climate in the United States. Global Change Biology 21: 1581–1589. doi: 10.1111/gcb.12755
- Zhang Y, Steiner AL. 2022. Projected climate-driven changes in pollen emission season length and magnitude over the continental United States. Nature Communications 13: 1234. doi: 10.1038/s41467-022-28764-0
- Ziello C, Sparks TH, Nicole Estrella N, Belmonte J, Karl C, Bergmann KC, Bucher E, Brighetti MA, Damialis A, Detandt M, Galán C, Gehrig R, Grewling L, Gutiérrez Bustillo AM, Hallsdóttir M, Kockhans-Bieda M, De Linares C, Myszkowska D, Páldy A, Sánchez A, Smith M, Thibaudon M, Travaglini A, Uruska A, Valencia-Barrera RM, Vokou D, Wachter R, de Weger LA, Menze A. 2012. Changes to airborne pollen counts across Europe. Plos One 7: e34076. doi: 10.1371/journal.pone.0034076