
 ?Mathematical formulae have been encoded as MathML and are displayed in this HTML version using MathJax in order to improve their display. Uncheck the box to turn MathJax off. This feature requires Javascript. Click on a formula to zoom.
Abstract
In this paper, we will evaluate integrals that define the conditional expectation, variance and characteristic function of stochastic processes with respect to fractional Brownian motion (fBm) for all relevant Hurst indices, i.e. . Particularly, the fractional Ornstein–Uhlenbeck (fOU) process gives rise to highly nontrivial integration formulas that need careful analysis when considering the whole range of Hurst indices. We will show that the classical technique of analytic continuation, from complex analysis, provides a way of extending the domain of validity of an integral from
to the larger domain
. Numerical experiments for different Hurst indices confirm the robustness and efficiency of the integral formulations presented. Moreover, we provide accurate and highly efficient financial option pricing results for processes that are related to the fOU process, with the help of Fourier cosine expansions.
1. Introduction
In this paper, we will evaluate the integrals that define the conditional expectation and variance of stochastic processes that are based on fractional Brownian motion (fBm). For this, we first define fBm, to which a Hurst index is associated, as a generalization of standard Brownian motion (sBm).
Let be a complete probability space,
be an fBm with Hurst index
defined on this probability space, and
be its natural filtration.
Fractional Brownian motion, , is then uniquely characterized by the following properties [Citation22]:
has stationary increments, which means
From the first three properties, it follows that the covariance function is given by
(1)
(1) A special case of Equation (Equation1
(1)
(1) ) is sBm (
), with covariance function
. Particularly for fBm, and different from sBm, the increments are not independent and fBm is neither a Markov process nor a semi-martingale, for
. As a consequence, fBm enables modelling of stochastic processes that are self-similar or exhibit long-range dependence on time. Properties of fBm have been presented, for example, in Refs [Citation4] and [Citation24].
Fractional Brownian motion forms the basis for a broad class of stochastic processes, like the fractional Ornstein–Uhlenbeck (fOU), the fractional Cox–Ingersoll–Ross (fCIR) and the geometric fOU (GfOU) processes. Such processes play an increasingly important role in diverse application fields, like hydrology [Citation19,Citation21], telecommunication [Citation23,Citation27], weather forecast [Citation30,Citation33] and epidemic disease (such as the Coronavirus) modelling [Citation1]. FBm has also been used in finance for the modelling of commodities, weather (considered as an asset) and currencies in financial products, that are based on these assets, in Refs [Citation2,Citation3,Citation6,Citation29,Citation36] among others, for bond markets in Ref. [Citation14] and recently for rough volatility in Refs [Citation15,Citation18]. In these application areas, the computation of conditional expectations is required to compute the average behaviour under uncertainty and also to price options on these non-tradable assets in finance.
For Markov processes, the accurate computation of conditional expectations and variances has been given ample attention. In the diverse literature, we encounter, for such processes, approaches based on numerical integration, Fourier or Laplace inversion, Monte Carlo simulation and recently also neural network approximations. For non-Markov processes, to which fBm belongs, the literature is more scarce, but some significant books and papers have been presented in the past 20 years, like Refs [Citation2,Citation4,Citation14,Citation24]. The conditional characteristic function for the fOU process has been derived in Ref. [Citation14] and was evaluated in Refs [Citation14,Citation34], where involved integration formulas had to be calculated numerically. These integration formulas are nontrivial when considering all Hurst indices , due to the occurrence of singularities in the integrand. Particularly, for the range
, we encounter approximation formulas in the literature that are not easily understood from a numerical analysis point-of-view.
In this paper, we analyse the integration formulas for the expectation and variance for all relevant Hurst indices and aim to approximate them numerically on the basis of accurate (classical) approximations and numerical techniques. The technique of analytic continuation [Citation31,Citation32] is used in this paper to deal with the integration formulas for certain Hurst index values. Analytic continuation provides a way of extending the domain over which a complex function is defined. Here, it is used to extend the domain of validity of an integral which is defined on an interval with respect to the Hurst index, from , to the larger domain,
. Here, we calculate the conditional expectation, variance and the conditional characteristic function of fBm and of fBm-driven stochastic differential equations (SDEs). The accuracy of our numerical results is verified by results obtained by Monte Carlo simulation.
As an application in finance, we discuss the option pricing problem where the asset price is modelled as a fractional stochastic process. Clearly, fBm is not a semi-martingale, but some assets, like those based on the weather or volatility, are non-tradable, so the well-known financial derivative pricing theory, based on the no-arbitrage and market completeness, cannot be used anyway. Valuation of such a derivative is then based on the expected discounted value approach under the real-world probability measure. With the characteristic function for the fOU process available, we can compute the conditional expectation by means of the COS method, a Fourier-based numerical integration technique, see Refs [Citation9,Citation10]. The COS method is based on an approximation of the appearing (conditional) probability density function by a Fourier cosine series expansion. The characteristic function of some of the fractional processes considered here is either unavailable or not easy to derive. However, by means of a transformation of variables, the COS method can still be employed.
This paper is organized as follows. Section 2 briefly introduces fBm and the related stochastic processes. In Section 3, we analyse the conditional variance of the fOU process and present a convenient numerical method to compute the appearing integrals. Option pricing with the COS method is described in Section 4. Section 5 presents numerical results, including conditional distributions and option pricing. Section 6 concludes the paper. Some examples and pointers for the analytic continuation technique are presented in Appendix 1.
2. Fractional Brownian motion and related processes
In this section, we discuss some well-known properties of fBm and also present several stochastic processes driven by fBm.
2.1. Fractional Brownian motion
Fractional Brownian motion has the following three important properties.
Self-similarity.
Regularity. Trajectories of
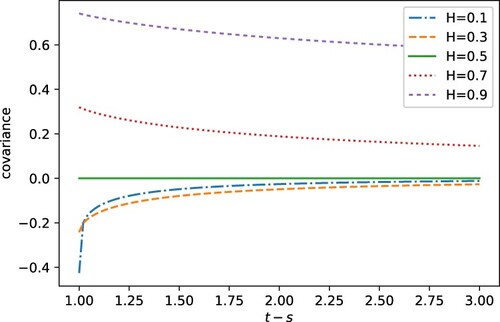
Long-range dependence. The autocovariance function of the increment process,
Figure 1. Covariance of fBm increments for various H.
2.2. Fractional Ornstein–Uhlenbeck process
The fractional Ornstein–Uhlenbeck (fOU) process, , is driven by fBm and is defined by the following SDE:
(3)
(3) with an fBm
and given initial value
. The parameter μ represents the long-term mean value of the process, λ the speed of mean reversion, and σ the volatility. It has a unique path-wise solution as
(4)
(4) For
, using It
's isometry property, the analytical solution of the Ornstein–Uhlenbeck process driven by standard Brownian motion reads:
(5)
(5) where W is a sample from the standard normal distribution
.
Using , and based on the derivation of the conditional characteristic function, it is proved in Ref. [Citation14] that under the filtration
,
is normally distributed, with
(6)
(6)
(7)
(7) where
; and, for
,
(8)
(8) while for
,
. For
, the norm of a function f is defined by the fractional Riemann–Liouville integral
(9)
(9) with
(10)
(10) where
is the gamma function. For
,
is set as the
norm, i.e.
(11)
(11) The accurate numerical evaluation of Equations (Equation6
(6)
(6) ) and (Equation7
(7)
(7) ) is the focus of the present paper. These equations also form the basis for the conditional characteristic function.
Remark 2.1
Conditional distribution of fBm
FBm can be considered a special case of the fOU process, setting and
in Equation (Equation3
(3)
(3) ). Then, the conditional distribution of the fBm also is a normal distribution, with
(12)
(12)
(13)
(13) where, for
,
(14)
(14) for
,
. See Ref. [Citation14].
2.3. Stochastic processes related to the fOU process
There are important processes that are related to the fOU process, i.e. they can be defined based on the fOU process, as follows,
(15)
(15) where
is the fOU process and the function
is invertible. With
, the cumulative distribution functions (CDFs) of Z and X are related, as follows,
(16)
(16) By differentiation, we have the relation of their probability density functions (PDFs),
(17)
(17) So, because the PDF of the fOU process is available, the PDF of stochastic process Z is also available by means of Equation (Equation17
(17)
(17) ). We are interested in the following three processes.
The geometric fractional Ornstein–Uhlenbeck (GfOU) process is defined as the process whose logarithm is the fOU process,
The fractional Cox–Ingersoll–Ross (fCIR) process is an extension of the classical Cox–Ingersoll–Ross (CIR) process, which is used for short-term interest rates and stochastic volatility modelling [Citation7,Citation17]. Compared to the CIR process, the fCIR process has the capability of modelling ‘memory’ in financial data [Citation20], like in rough volatility. It is shown in Ref. [Citation13] that, for
Equation (Equation19
3. Conditional distribution of the fOU process
We reviewed the conditional distribution of the fOU process, which is a conditional normal distribution with its expectation as in Equation (Equation6(6)
(6) ) and variance in Equation (Equation7
(7)
(7) ). In this section, we calculate the relevant integrals by which the conditional distributions of the fOU process and several related processes can be determined for all relevant Hurst indices.
With a discretization in the time interval , i.e.
, and the corresponding discrete realizations of
[Citation28], the conditional expectation can be calculated by
(21)
(21) The variance in Equation (Equation7
(7)
(7) ) is expressed as the difference of two terms, each being the square of a norm that is not easily calculated when
. The expression involves a nontrivial integration with multiple variables and singularities in its integral function. To deal with this, we simplify the expression of the conditional variance for
in Section 3.1 and obtain a solution for all
(i.e.
) in Section 3.2, which is summarized in Algorithm 1.
3.1. Simplification of the conditional variance
For , since both terms in Equation (Equation7
(7)
(7) ) contain indicator functions, we can rewrite them as
(22)
(22) and
(23)
(23) respectively, where
(24)
(24) By a variable transformation and the new variable,
,
(25)
(25) and interchanging the order of integration, we find
(26)
(26) Here, we recognize the Mellin transform (see [Citation26, Table 1.14.4])Footnote1
(27)
(27) This gives us,
(28)
(28) We have thus derived this relation for
, see Equation (Equation27
(27)
(27) ), however, we need this expression, or a similar result, also for
. For this, the classical technique of analytic continuation is employed, see also Appendix 1.
Substituting Equations (Equation28(28)
(28) ) into (Equation23
(23)
(23) ) and comparing with Equation (Equation22
(22)
(22) ), we find that
is part of
and the expression of the conditional variance in Equation (Equation7
(7)
(7) ) can be simplified, from two terms to one term only:
(29)
(29)
3.2. Calculation of the conditional variance
Next, we illustrate how to calculate Equation (Equation29(29)
(29) ) for the conditional variance with
.
Knowing that
the front factor
in Equation (Equation29
(29)
(29) ) is given by
(30)
(30) Equation (Equation29
(29)
(29) ) can now be written as,
(31)
(31) with
(32)
(32)
(33)
(33) and
(34)
(34)
3.2.1. Calculation of
A set of transformations is now proposed for the calculation of in Equation (Equation32
(32)
(32) ):
First, we use the transformation
Then, using
The final transformation is given by
The resulting integral in Equation (Equation37(37)
(37) ) is approximated by the Trapezoidal Rule,
(40)
(40) where m>0 is the step size. Because of the fast convergence of the series in (Equation40
(40)
(40) ), the range of summation can be cut off to a smaller interval
, a>0:
(41)
(41) For details about the Trapezoidal Rule, see [Citation16, §5.4]. In our case,
, with w a function of z.
3.2.2. Calculation of
Here we will derive convenient expressions for the term in Equation (Equation33
(33)
(33) ), which is the involved part remaining.
We expand from Equation (Equation34
(34)
(34) ) in powers of r and get an expansion with fast convergence, i.e.
(42)
(42) Then, we obtain
(43)
(43) Initially, we consider
, because for r = z, we need a convergence of the integral. Integrating by parts gives us,
(44)
(44) In this representation, we can accept
, so integration by parts gives us again an analytic continuationFootnote2 of
with respect to κ.
Using , a simple recursion formula follows
(45)
(45) The functions
can be expressed in terms of Gauss hypergeometric functions. For details about these functions, see [Citation25]. In particular, we have the integral representation and power series,
(46)
(46) For the integral, we assume that
, where
denotes the real part of the input argument. Furthermore, we assume that ζ is a complex number not in the interval
, and for the series, we need the conditions
and
.
Again, initially we assume that and use the transformation
, to obtain
(47)
(47) In this integral, we take
, which gives us, by invoking the integral in (Equation46
(46)
(46) ),
(48)
(48) The representation in the second line of Equation (Equation48
(48)
(48) ) is valid for
, and it gives us again the analytic continuation to the domain of
initially defined for
.
Remark 3.1
From Equation (Equation43(43)
(43) ), we observe that we do not need to deal with a singularity at the endpoint z = s when s>0. However, this will be needed when s = 0, in which case the variable of integration, z in Equation (Equation32
(32)
(32) ), will reach the value z = 0, where the
-function in Equation (Equation48
(48)
(48) ) is not defined at z = 0. For this case, a different form of
will be required, which is given by
(49)
(49) The derivation of this form is presented in Appendix 2. The
-function is not defined for
when
. In that case, Equation (Equation48
(48)
(48) ) should be used.
4. Option pricing methodology
In this section, we will compute conditional expectations based on the calculation of the expectation and variance of the fOU process described in the previous sections.
Usually, financial option valuation starts from the risk-neutral valuation formula, which is the discounted expectation of the asset price process under a risk-neutral measure. Risk neutrality is related to complete markets, no arbitrage and the asset price process being a martingale, i.e. the expected fair value of the discounted price process at a future time point is the present asset price. Processes based on fractional Brownian motion are not (semi-) martingales, so the risk-neutral pricing formula does not apply in this case. For financial option pricing based on non-tradable assets, the real-world probability measure is often employed. Under the assumption that such a measure has been defined, option pricing can be cast in an integral form:
(50)
(50) where
, V denotes the option value, x the state variable at time t and y at time T,
the transition probability density, and r the interest rate.
We focus on pricing European-style options where the asset price is modelled by means of the processes described in Section 2.3. For these processes, the transition probability, in Equation (Equation50
(50)
(50) ), is the PDF of a normal distribution with expectation
and variance
, as in Equations (Equation6
(6)
(6) ) and (Equation7
(7)
(7) ), respectively. It is therefore possible to obtain a closed-form solution of Equation (Equation50
(50)
(50) ) for some specific processes. For example, if the asset price follows a GfOU process, see Equation (Equation18
(18)
(18) ), and the payoff reads
(51)
(51) with the strike price K, the closed-form solution of Equation (Equation50
(50)
(50) ) for a call option can be derived as
(52)
(52) and for a put option,
(53)
(53) Here,
denotes the CDF of the standard normal distribution.
For more general processes, e.g. polynomial processes, a closed-form option value expression is difficult or even impossible to obtain. It is, however, possible to employ the COS method in such cases.
4.1. The COS method
The COS method [Citation9,Citation10] can be applied to compute expectations of (underlying) processes for which the characteristic function is available. For Markov processes with affine dynamics, the characteristic function can be derived by solving the Ricatti differential equations [Citation8]. Affinity is not invariant under polynomial transformations [Citation12] and, therefore, the characteristic function of a stochastic model which is based on a polynomial process, , generally does not exist. However, by using a transformation
in the definition of the COS method, the state variables can be appropriately defined so that the characteristic function of the underlying process
,
(54)
(54) can be employed within the pricing formula, with, again,
and
, as in Equations (Equation6
(6)
(6) ) and (Equation7
(7)
(7) ).
The conditional probability density function in Equation (Equation50(50)
(50) ) is approximated by a truncated Fourier cosine expansion, which uses the characteristic function to recover the Fourier coefficients, as follows [Citation9]:
(55)
(55) where
is the integration interval, L is the number of terms in the Fourier-cosine expansion and
implies that the first term of the summation is multiplied by
.
By replacing the conditional density function in Equation (Equation50
(50)
(50) ) by its Fourier cosine expansion approximation Equation (Equation55
(55)
(55) ) and interchanging integration and summation, with the help of Fubini's theorem, the COS formula is obtained:
(56)
(56) where coefficients
are defined by:
(57)
(57) where, importantly, the state variables x and y can be any function of respectively the asset prices
and
, e.g. in our case,
and
, with
, invertible, as in Equation (Equation15
(15)
(15) ). So, we can work with the characteristic function of the fOU process
, but price options under the more involved process
. A closed-form solution of the coefficients
is available for various payoff functions and several choices of the state variables x and y [Citation9].
5. Numerical results
We show numerical results for the methods presented, starting with the calculation of the conditional variances of the fBm and fOU processes, followed by the computation of the probability density functions of the GfOU, fCIR and polynomial processes, and some option pricing results using the COS method. These results show the accuracy and efficiency of the proposed computational techniques.
5.1. Calculation of variance
First of all, we focus on the accurate representation of the conditional variance by means of the integrals that are derived in Section 3.
5.1.1. Choice of hyperparameters
As explained in the previous sections and also shown in Algorithm 1, there are three hyperparameters in the numerical method to compute the integrals in the approximation of the conditional variance for the fOU process, i.e. the step size m, summation range a for the Trapezoidal Rule in Equation (Equation41(41)
(41) ), and the number of expansion terms N in Equation (Equation43
(43)
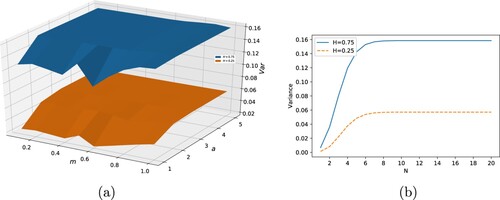
(43) ). To determine suitable values for these parameters, we perform the following experiment. For two values of H, and the value of N sufficiently large (i.e. N = 20), the computed results by varying m and a are presented in Figure (a). The figure shows that the summation range value a has a bigger impact than the step size m. The numerical approximation converges when a is larger than 3 and m is smaller than 0.6. We therefore set a = 5 and m = 0.5 in the subsequent numerical experiments. Next, we consider the effect of the number of expansion terms N on the computed results, also for the two values of H, see Figure (b). The results show that the numerical scheme converges rapidly as N increases, and setting N>10 already provides reliable computational results. We may define the stopping criterion by checking when
is less than
, then stop the summation. The results presented are representative for a large range of model parameters.
Figure 2. Calculated variances with ,
, s = 0 and t = 5 for two values of H. (a) Step size m varies from 0.1 to 1.0, and summation range a from 1 to 5, with fixed N = 20. (b) N varies from 1 to 20, with m = 0.5 and a = 5 fixed. (a) m and a; (b) N.
5.1.2. Numerical performance
To analyse the accuracy of the numerical technique, we compare the conditional (s = 3) and unconditional (s = 0) variances obtained by our method with Monte Carlo simulation. FBm and fOU, with ,
, are considered, with different Hurst indices H. For the simulation of fBm, we use a Python package named ‘fbm’Footnote3.
Two sets of parameters are chosen, one with a step size of 0.01 and the number of Monte Carlo paths of , and another with the step size halved and the number of paths multiplied by 10. We report the relative errors in Table , which are defined as
(58)
(58) where the standard deviation of the Monte Carlo results is
and the computed standard deviation by numerical integration is
.
Table 1. Conditional (s = 3) and unconditional (s = 0) standard deviations of fBm and the fOU process, with ,
, t = s + 5 and Hurst index H from 0.1 to 0.9.
As shown in Table , our numerical technique provides highly accurate results very close to the Monte Carlo simulation results, with average relative errors of less than . By using a smaller time step and simulating more paths within the Monte Carlo simulation, the differences are even smaller. The CPU timesFootnote4 are also compared in Table . Clearly, a numerical integration technique costs much less computing time than a Monte Carlo sampling method, because Monte Carlo simulation requires the generation of many paths with a small time step to obtain reliable results.
Table 2. CPU times (s) using our computational technique and Monte Carlo simulations for the variances of fBm and the fOU process with three representative H indices (i.e. ).
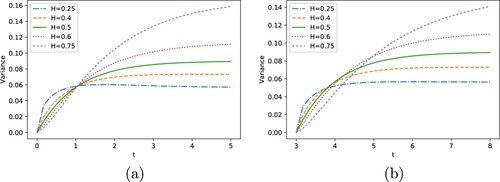
We further present the computed variances for different values of H, time points s and with increasing sizes of the time interval t−s in Figure (fBm) and Figure (fOU process with ,
). From these figures, we conclude that our computational technique converges very well for all relevant H indices, in a robust way. The curves for the different values of H are very accurate, as compared to the literature [Citation14]. As the time interval t−s increases, the variance increases too. With a sufficiently large time interval t−s, large values of the Hurst parameter H give rise to higher variances. This makes sense as the Hurst index indicates the roughness of a process, with a higher value leading to smoother paths. Comparing the variances for s = 0 and s = 3, we see different results for the same time interval t−s, which confirms that the variance is not a function t−s, but of s and t separately.
Figure 3. Variances of the fBm process for different H and t values. (a) s = 0; (b) s = 3.
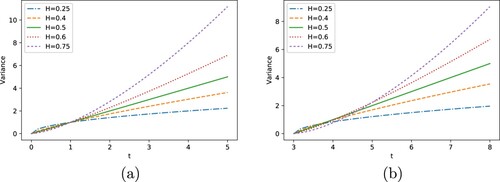
Figure 4. Variances of the fOU process for different H and t, and ,
. (a) s = 0; (b) s = 3.
5.2. PDF recovery of fOU-related processes
As described in Section 2.3, due to the relation between the PDFs of the fOU process and the processes in Equation (Equation17(17)
(17) ), we can compute the PDFs of the related processes by means of the PDF of the fOU process, which is normally distributed with the expectation in Equation (Equation21
(21)
(21) ) and the variance computed as in Algorithm 1, and the transformation
in Equation (Equation15
(15)
(15) ).
Figure presents the PDFs of the GfOU, fCIR and polynomial process, as in Equations (Equation18(18)
(18) ), (Equation19
(19)
(19) ) and (Equation20
(20)
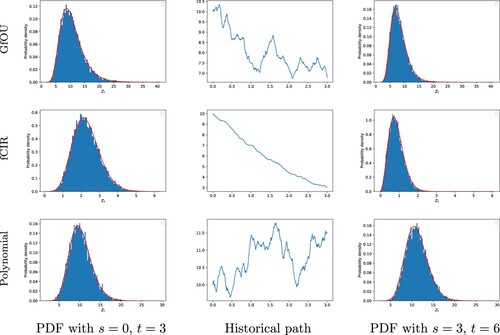
(20) ), respectively. We calculate the PDFs on the condition of either initial value (s = 0, t = 3) or realized historical paths (s = 3, t = 6), and compare them with the results by Monte Carlo simulation. It is shown that the calculated PDFs resemble the histograms of Monte Carlo simulation very well, which is an indication of the accuracy of our technique. Moreover, by comparing the first and third columns of Figure , we can see the impact of the memory of the processes (the second column of Figure ) on the PDFs.
Figure 5. PDFs of the related processes with H = 0.75, ,
,
. The red curves are the PDFs obtained by our scheme, the blue histograms are Monte Carlo simulation results. From left to right, first column: PDFs at time t = 3 with given initial value; second column: realized paths until time s = 3; third column, PDFs at time t = 6 on the condition of corresponding path in the second column. From top to bottom, first row: the GfOU process as in Equation (Equation18
(18)
(18) ) with
; second row: the fCIR process as in Equation (Equation19
(19)
(19) ); third row: the polynomial process as in Equation (Equation20
(20)
(20) ) with
and
, where
.
5.3. Option pricing
The COS method enables us to price options if we have the characteristic function available for a function of the asset price process, like in
. When the asset prices are modelled as one of the fOU-related processes, the use of the COS method is based on the characteristic function of the fOU process
.
To test the performance of the COS method, we price a European call option under the GfOU process. This is just a reference example, since a closed-form solution is available in this case, as in Equation (Equation52(52)
(52) ). The errors of the COS method are presented in Table with the strike price K = 10, the interval of integration
and a varying number of cosine terms L, see Equations (Equation55
(55)
(55) ) and (Equation56
(56)
(56) ). It is shown that the COS method converges rapidly, as with only L = 16 Fourier-cosine expansion terms, the errors are of the order
.
Table 3. Errors of the COS method for a European call option under the GfOU process with K = 10, t = 0, T = 3, r = 0.1.
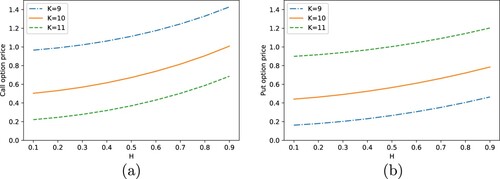
We further present the prices of European call and put options under the GfOU process in Figure and the polynomial process in Figure , respectively, for different Hurst indices H and strike prices K. Obviously, the Hurst index H has a significant impact on the option price, which indicates the importance of modelling the asset price as a stochastic process with a suitable H.
Figure 6. European option values under the GfOU process with different H and K, t = 0 and T = 3 fixed. (a) Call option; (b) Put option.
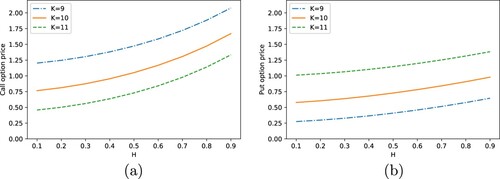
Figure 7. European option values under the polynomial process with different H and K, t = 0 and T = 3 fixed. (a) Call option; (b) Put option.
6. Conclusion
We have shown that, on the basis of several transformations of variables and the analytic continuation technique, integrals that define the conditional expectation, variance and characteristic function of stochastic processes with respect to fractional Brownian motion (fBm) can be reformulated for all relevant Hurst indices. Numerical experiments confirm the robustness and efficiency of the integral formulations and of the numerical technique regarding different values of the Hurst index. Moreover, by means of the COS method, we have presented accurate and highly efficient option pricing results for processes connected to the fOU process, on the basis of the conditional characteristic function of the fOU process.
The methodology presented can be used as an alternative to Monte Carlo simulation when appropriate, or as a validation technique for implementations of other numerical techniques.
Acknowledgements
N. M. Temme thanks CWI, Amsterdam, for general support.
Disclosure statement
No potential conflict of interest was reported by the author(s).
Additional information
Funding
Notes
2 For details on analytic continuation, we refer again to Appendix 1.
4 The computer used has an Intel Core i7-8700K CPU. The code is written in Python 3.
References
- M.A. Akinlar, M. Inc, J.F. Gómez-Aguilar, and B. Boutarfa, Solutions of a disease model with fractional white noise, Chaos Solit. Fractals 137 (2020), pp. 109840.
- F.E. Benth, On arbitrage-free pricing of weather derivatives based on fractional Brownian motion, Appl. Math. Finance 10 (2003), pp. 303–324.
- F.E. Benth and J. Saltyte-Benth, Modeling and Pricing in Financial Markets for Weather Derivatives, Vol. 17, World Scientific, Singapore, 2012.
- F. Biagini, Y. Hu, B. Øksendal, and T. Zhang, Stochastic Calculus for Fractional Brownian Motion and Applications, Springer Science & Business Media, Berlin, German, 2008.
- B.C. Boonstra and C.W. Oosterlee, Valuation of electricity storage contracts using the COS method, Appl. Math. Comput. 410 (2021), pp. 126416.
- D.C. Brody, J. Syroka, and M. Zervos, Dynamical pricing of weather derivatives, Quant. Finance 2 (2002), pp. 189.
- J.C. Cox, J.E. Ingersoll Jr, and S.A. Ross, A theory of the term structure of interest rates. Econometrica 53(2) (1985), pp. 385–407.
- D. Duffie, J. Pan, and K. Singleton, Transform analysis and asset pricing for affine jump-diffusions, Econometrica 68 (2000), pp. 1343–1376.
- F. Fang and C.W. Oosterlee, A novel pricing method for European options based on Fourier-cosine series expansions, SIAM J. Sci. Comput. 31 (2009), pp. 826–848.
- F. Fang and C.W. Oosterlee, Pricing early-exercise and discrete barrier options by Fourier-cosine series expansions, Numer. Math. 114 (2009), pp. 27–62.
- D. Filipović and M. Larsson, Polynomial diffusions and applications in finance, Finance Stoch. 20 (2016), pp. 931–972.
- D. Filipović and M. Larsson, Polynomial jump-diffusion models, Stoch. Syst. 10 (2020), pp. 71–97.
- H. Fink and C. Klüppelberg, Fractional Lévy-driven Ornstein–Uhlenbeck processes and stochastic differential equations, Bernoulli 17 (2011), pp. 484–506.
- H. Fink, C. Klüppelberg, and M. Zähle, Conditional distributions of processes related to fractional Brownian motion, J. Appl. Probab. 50 (2013), pp. 166–183.
- J. Gatheral, T. Jaisson, and M. Rosenbaum, Volatility is rough, Quant. Finance 18 (2018), pp. 933–949.
- A. Gil, J. Segura, and N.M. Temme, Numerical Methods for Special Functions, SIAM, Philadelphia, PA, 2007.
- S.L. Heston, A closed-form solution for options with stochastic volatility with applications to bond and currency options, Rev. Financ. Stud. 6 (1993), pp. 327–343.
- G. Livieri, S. Mouti, A. Pallavicini, and M. Rosenbaum, Rough volatility: evidence from option prices, IISE Trans. 50 (2018), pp. 767–776.
- S. Lu, F.J. Molz, and H.H. Liu, An efficient, three-dimensional, anisotropic, fractional Brownian motion and truncated fractional Lévy motion simulation algorithm based on successive random additions, Comput. Geosci. 29 (2003), pp. 15–25.
- Y. Mishura and A. Yurchenko-Tytarenko, Fractional Cox–Ingersoll–Ross process with non-zero mean, Mod. Stoch. Theory Appl. 5 (2018), pp. 99–111.
- F.J. Molz, H.H. Liu, and J. Szulga, Fractional Brownian motion and fractional Gaussian noise in subsurface hydrology: A review, presentation of fundamental properties, and extensions, Water Resour. Res. 33 (1997), pp. 2273–2286.
- I. Norros, A storage model with self-similar input, Queueing Syst. 16 (1994), pp. 387–396.
- I. Norros, On the use of fractional Brownian motion in the theory of connectionless networks, IEEE J. Sel. Areas Commun. 13 (1995), pp. 953–962.
- D. Nualart, Fractional Brownian Motion: Stochastic Calculus and Applications, Proceedings of the International Congress of Mathematicians, European Mathematical Society, Madrid, Spain, 2006
- A.B. Olde Daalhuis, Chapter 15, Hypergeometric function, in NIST Handbook of Mathematical Functions, Cambridge University Press, Cambridge, 2010, pp. 383–401. http://dlmf.nist.gov/15. MR 2655355.
- F.W.J. Olver, D.W. Lozier, R.F. Boisvert, and C.W. Clark, NIST Handbook of Mathematical Functions, Cambridge University Press, Cambridge, 2010.
- A. Pashko, Simulation of telecommunication traffic using statistical models of fractional Brownian motion, in 2017 4th International Scientific-Practical Conference Problems of Infocommunications. Science and Technology (PIC S&T). IEEE, 2017, pp. 414–418.
- V. Pipiras and M.S. Taqqu, Are classes of deterministic integrands for fractional Brownian motion on an interval complete? Bernoulli 7 (2001), pp. 873–897.
- G.J. Power and C.G. Turvey, Long-range dependence in the volatility of commodity futures prices: Wavelet-based evidence, Phys. A: Stat. Mech. Appl. 389 (2010), pp. 79–90.
- C.R. Rivero, D. Patiño, J. Pucheta, and V. Sauchelli, A new approach for time series forecasting: Bayesian enhanced by fractional Brownian motion with application to rainfall series, Int. J. Adv. Comput. Sci. Appl. 7 (2016), pp. 237–244.
- R. Roy, F.W.J. Olver, R.A. Askey, and R. Wong, Chapter 1, Algebraic and analytic methods, in NIST Handbook of Mathematical Functions, U.S. Dept. Commerce, Washington, DC, 2010, pp. 1–39. http://dlmf.nist.gov/1. MR 2655341.
- E.C. Titchmarsh, The Theory of Functions, Oxford University Press, Oxford, 1958. Reprint of the second (1939) edition. MR 3155290.
- A.A. Tsonis, P.J. Roebber, and J.B. Elsner, Long-range correlations in the extratropical atmospheric circulation: Origins and implications, J. Clim. 12 (1999), pp. 1534–1541.
- X. Wang, W. Xiao, and J. Yu, Modeling and forecasting realized volatility with the fractional Ornstein–Uhlenbeck process, J. Econ. (2021). forthcoming.
- A. Ware, Polynomial processes for power prices, Appl. Math. Finance 26 (2020), pp. 453–474.
- W. Xiao, W. Zhang, X. Zhang, and Y. Wang, Pricing currency options in a fractional Brownian motion with jumps, Econ. Model. 27 (2010), pp. 935–942.
Appendices
Appendix 1.
Analytic continuation
In complex analysis, analytic continuation is a classical technique to extend the domain of definition of a given analytic function. Analytic continuation often succeeds in defining further values of a function, for example, in a new region where an infinite series representation, in terms of which it is initially defined, becomes divergent.
As a standard form to explain analytic continuation for a class of integrals, we consider the function defined by
where the function
is analytic in
, and in a complex domain around this interval.
is an analytic function in the domain
. When we assume that
, the integral does not converge if x = 0. The reciprocal gamma function in front of the integral will allow us to give an interpretation to
for
, but a different choice of a front factor may act in a similar way. By a standard method, we can change the representation of
into a different form from which we can conclude that
is analytic in a larger domain, in particular at x = 0.
We demonstrate the idea in detail by using the example
where
is some real or complex parameter. Here, the condition
controls the convergence at the origin.
Integration by parts gives, by writing and using
,
The new integral converges inside the domain
.
We have two representations of . In the overlapping domain,
, these representations give the same analytic function
, in the new domain
the second representation is analytic, and the principle of analytic continuation gives that, hence,
can be analytically extended from all points in
to all points in
. The first representation cannot be used in that new domain.
The integration by parts technique can be continued, and it gives the result that is analytic in a domain
for each nonnegative integer n.
As a bonus, we observe that by expanding the cosine function as a power series, we obtain for
Because for
as
, we see that the series gives a representation of
as an analytic function for all complex values of x.
For further details on analytic continuation, we refer to the references [Citation31, Section 1.10(ii)] and [Citation32, Chapter IV].
Appendix 2.
The case s = 0
In (Equation32(32)
(32) ), we see that we do not need to handle a singularity at the endpoint z = s when s>0. However, this will be needed when s = 0, in which case the variable of integration, z in (Equation33
(33)
(33) ), will take the value z = 0.
To deal with this, first of all, we write the representation of in (Equation48
(48)
(48) ) in different form because the
-function is not defined at z = 0 (although the front factor
will control the product of the two quantities).
We use
(A1)
(A1) of [Citation25, Eqn. 15.10.21], with
and
in the first lines of Equations (15.10.13) and (15.10.14) of that reference. Here,
(A2)
(A2) and
(A3)
(A3) For
, we have an elementary form, i.e.
(A4)
(A4) and
is given by
(A5)
(A5) This gives us, for (Equation48
(48)
(48) ),
(A6)
(A6) This
-function is not defined for
when
. In that case Equation (Equation48
(48)
(48) ) should be used.