
Abstract
Mathematics is traditionally considered necessary for engineering courses. Over the last three decades, the mathematics requirements for entry into engineering programmes has steadily weakened in Australia. Further, the mathematics component of engineering programmes has progressively decreased. This research aims to investigate the following two questions. First, is mathematics a barrier for students to complete an engineering programme? And second, is performance in mathematics associated with performance in engineering? We identified the significant factors associated with weighted average mark and the completion status of engineering studies at both an undergraduate level and a Masters level. Of particular interest was the students' mathematical background. Furthermore, a survey of students enrolled in engineering at the University of Western Australia was conducted to obtain more in depth views of student attitudes and perceptions towards how mathematics has affected their engineering studies. Binary logistic models were fitted to the survey data. Additionally, focus group interviews were conducted to gain insight on student perspectives regarding the effectiveness of mathematics teaching in engineering. The results are discussed in relation to the importance of mathematics and statistics for the engineering curriculum.
MATHEMATICS SUBJECT CLASSIFICATION:
1. Introduction
1.1. Background
Mathematics is a fundamental and key skill for engineers. Appropriate high school mathematical preparation has traditionally been considered a necessary pre-requisite for university engineering courses. Recently, however, mathematics prerequisites in several university courses, including engineering, has been weakened (Finkel et al., Citation2020).
A report by the Australian Mathematical Sciences Institute (AMSI) examined 268 undergraduate engineering courses from 34 Australian universities and found 38% of them did not have any mathematics requirements and 53% required only intermediate mathematics prerequisite (Finkel et al., Citation2020). This is a key reason for the decline in enrolments in intermediate and advanced mathematics in high school. With universities lowering their mathematics requirements, students have less incentive to take the more difficult mathematics (Hine, Citation2019). Schools also have less reason to allocate resources to higher mathematics.
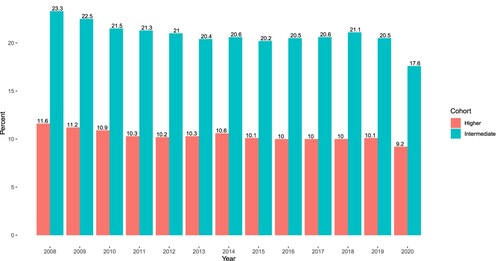
Between 2008 and 2011, enrolment in Intermediate and Higher mathematics dropped by 2% (Figure ). Enrolments remained fairly steady from then on, with a slight increase between 2016 and 2018. The large decrease in 2020 was due to Queensland changing its Year 12 assessment from wholly school-based to a 50% external examination.
Figure 1. Proportion of mathematics enrolment in year 12. Based on data from Wienk (Citation2022).
A technical report by Engineers Australia (Bell et al., Citation2022) estimates that 50,000 engineers will be needed over the next few years. The report also deduces that the problem is compounded by fewer students choosing intermediate and higher level mathematics at school, and a decline in the number of students opting to study engineering (Bell et al., Citation2022). In addition, the retention rate in engineering course is low. According to data, only 25% of students complete their study in minimum time (Department of Education, Australian Government, Citation2022), and only 50–60% of commencing students complete an engineering degree (International Engineering Alliance, Citation2021).
The decline in mathematics requirements and retention rate raises the question whether there is a relationship between mathematics and retention in engineering. How much does mathematics performance affect performance in engineering and is it a barrier for student retention and completion of an engineering course?
1.2. Literature survey
Several studies report the results of multivariate models developed to identify relationships between numerous predictive factors and the performance and retention of engineering students. However, they do not include enough predictors.
An American study (Kauffmann et al., Citation2007) investigated six factors associated with GPAs of freshman and sophomore (1st year and 2nd year) engineering students. Of these six factors, only math SAT score was related to mathematics. High school GPA had significant positive correlations with both freshman and sophomore GPAs. They also found that high school class rank was significant for both freshman and sophomore GPAs, but the association varied between cohorts; it had a negative relation for the 2004 freshman cohort and the 2005 sophomore cohort whilst having a positive relation for 2005 freshman cohort. Math SAT was insignificant in their models. A UK study (Lee et al., Citation2008) investigated 14 factors associated with first year engineers university performance. They found three significant factors, all of which were related to mathematics. These were the mathematics diagnostic test results, visits to the MLSC (Mathematics Learning Support Centre) in their first year of study and the number of statistics modules studied in A-level mathematics. Both the mathematics diagnostic test results and visits to the MLSC had positive correlations with performance in first-year engineering. The number of statistics modules had a negative effect. They suggest a potential reason could be that by studying more statistics modules, students have less opportunity to study engineering modules. Another study (De Winter & Dodou, Citation2011) found that high school examination scores in Natural Sciences and in Mathematics have positive correlations with first-year engineer GPA. This suggests students who perform well in high school mathematics perform better in first-year engineering.
A more comprehensive study by French (French et al., Citation2005) used both quantitative (SAT scores, high school rank) and qualitative factors (such as academic motivation) in a hierarchical linear model. French investigated the effects on engineering students' university GPA as well as enrolment in engineering. In their data only math SAT was related to mathematics. They found that both SAT scores (maths and verbal) and high school rank were positively correlated to GPA while females had higher GPA than males. Further GPA, high school rank, maths SAT and motivation were all positively correlated with enrolment in engineering. Barry and Chapman (Citation2007) investigated the effect of Australia's Tertiary Entrance Rank (TER) and level of mathematics completed in high school on first semester university performance. They found TER has a positive relationship with performance. In addition, students taking higher level mathematics in high school performed better than those taking lower level mathematics.
Other studies investigated factors associated with retention and persistence of students in engineering. Zhang et al. (Citation2004) examined the impact of ethnicity, gender, high school GPA, math SAT, SAT verbal score and citizenship status on graduation success of an engineering student. Their study used a multiple logistic regression model using data from nine different institutions. They found that high school GPA and quantitative math SAT scores were the only significant factors in all models. Some other predictors varied in significance among the institutions, including gender, ethnicity and citizenship. Studies by Suresh (Citation2006) and Seymour and Hewitt (Citation1997) found that performance in key introductory courses is also a factor in the persistence to continue studying engineering. These ‘barrier courses’ include introductory mathematical courses as well as chemistry and physics. Failure to overcome these barrier courses leads students to feel discouraged in persisting and completing the engineering program. This is also seen in another study looking at retention and attrition in engineering in Australia (Godfrey et al., Citation2010). Through an exit questionnaire to students who had left their engineering studies prior to completion, they found students who had transferred to a non-engineering degree were categorised into two groups. One group had good grades and used engineering as a means to enter their preferred course, whereas the other group performed poorly in engineering specifying mathematics as a ‘killer’ unit.
Flegg et al. (Citation2012) used questionnaires and interviews to explore engineering students perceptions on the relevance of mathematics. They found that although a majority of students agreed or strongly agreed that mathematics was relevant to their study, they also raised several curriculum issues. These include a difference in perceptions within different engineering majors and using inconsistent methods in teaching mathematics between different lecturers. The engineering students in the study were learning mathematics in a separate unit to their engineering units. Flegg strongly suggests a ‘unified approach’, where mathematics and engineering departments work closely. This is so they can teach mathematics more effectively, by presenting mathematics concepts through engineering contexts students are already familiar with or in which mathematics will be used. Their questionnaire also showed over 30% of the students considered leaving engineering due to being overwhelmed by the mathematics in their studies. Some students stated in interviews that they had ‘lost all enjoyment of doing maths’. This loss of enjoyment can also be seen in Shaw and Shaw (Citation1997), which saw the number of students who did not enjoy mathematics treble from 16% to 51% after one and a half terms in university.
A student's perception of mathematics plays a role on how they perform in mathematics courses. This includes their perceptions of their self-efficacy and their confidence in their ability to do mathematics, and their perception of relevance or importance of mathematics in engineering. Literature has supported the trend that students who choose engineering as their major have high mathematics self-efficacy and are confident of their ability to succeed in mathematical courses required by engineering (Morán-Soto & Benson, Citation2018). However, students with high mathematics self-efficacy that is not backed up with high mathematics performance tend to negative behaviours and attitudes and a lack of effort to improve. Ultimately, this causes students to perform poorly and fail their introductory mathematics courses (Morán-Soto & Benson, Citation2018).
1.3. Research objectives
This research examines factors from engineering student records to determine which best predict performance, and completion of undergraduate engineering course and masters in professional engineering course. Data obtained include demographics, TER (Tertiary Entry Rank), high school mathematics background and mathematics units taken in university. This study serves to complement current literature by including demography as well as variables related to high school and university mathematics. We explore whether mathematics affects performance and retention of engineering students. This information is expected to inform universities and educators to implement strategies to help students and improve retention rates. Furthermore, it gives an Australian perspective to the current literature and explores the effectiveness of mathematics teaching in engineering courses.
The primary aims of this project are as follows.
To investigate if
mathematics is a barrier for completion in the engineering programme and
if performance in mathematics and statistics is associated with overall performance of engineering students.
To investigate student attitudes towards mathematics and their insight on the effectiveness of mathematics teaching in the engineering programme.
This paper is organised as follows. In Section 2, we discuss the statistical models and methods used in the study, including data sources and survey methodology. In Section 3, we present data exploration and modelling results, followed by the results of the survey analysis in Section 4. We discuss the results in Section 5 and conclude in Section 6 by relating the findings to the aims.
2. Methodology
Engineering at the University of Western Australia (UWA) is (until 2022) a 5-year degree, consisting of a 3-year undergraduate bachelor (UG) and a 2-year masters in professional engineering (MPE) programme. The data for this study was obtained in 2021. We chose the 2013 engineering admission, with the expectation that this cohort will have completed the programme at the time of data collection.
The high school mathematics units taken by this cohort and the corresponding sequence of mathematics units taken at first year undergraduate level are as follows.
MAT3AB (algebra, probability, basic statistics, introduction to differential calculus). Students take two bridging units, MATH1711 and MATH1712. This is followed by MATH1001 and MATH1002, the required core units for engineering.
MAT3CD (log and exponential functions, composition, chain rule, integration, FTC, rates of change, random variables, confidence intervals). Students take two bridging units, MATH1711 and MATH1712. This is followed by MATH1001 and MATH1002, the required core units for engineering.
MAS3CD (vectors, trigonometry, complex numbers, calculus of exponential and log, matrices, systems of linear equations, simple harmonic motion, exponential growth and decay). Students take MATH1001 and MATH1002, required core units for engineering.
The data obtained from university records are given in Table . Note the WAM refers to the weighted average mark, where the weights are the credit points corresponding to the unit. Since all units now have equal credit points this is simply the average mark for all units completed for the degree.
Table 1. List of variables in the data.
Student performance and demographic data were obtained from the University student records. The following statistical models will be fitted to the data.
A linear statistical model (Faraway, Citation2014) will be fitted to WAM as response against all the other covariates. We are interested to estimate the effect of high school and university mathematics units and corresponding marks on WAM.
A logistic regression model (Faraway, Citation2016) will be fitted to the completion of EngUG, a binary response, against all the other covariates. The interest is to estimate effect of high school and university mathematics units and corresponding marks on the odds of completing the UG in engineering.
Similarly, a logistic regression model will be fitted to the completion of the MPE, a binary response, against all the other variables. The interest is to estimate the effect of high school and university mathematics units and corresponding marks on the odds of completing the MPE.
We will fit a principal components analysis (PCA) (Wold et al., Citation1987) based on the continuous variables in the data. Plots from the analysis can be used to identify if any groupings in the data correspond to particular student characteristics, such as completion of UG or MPE, WAM bracket and high school mathematics unit.
A k-means clustering (Li & Wu, Citation2012; Wu, Citation2012) of the continuous variables in the data to investigate if the clusters correspond to any student characteristics.
Finally, a logistic regression analysis of the survey data will be conducted to determine attitudes of students towards the importance of mathematics. Some qualitative analysis will also be performed.
All statistical analysis will be conducted using the R statistical environment (R Core Team, Citation2020). Statistical significance will be taken at 5% (0.05).
3. Results
The 2013 engineering cohort at UWA comprised 692 students. Of this, 69.8% (483) completed an engineering undergraduate degree, while 5.2% opted out of engineering with the majority of these completing a degree in commerce. The remaining 25% did not complete their studies at UWA. Further, 54% of the cohort completed a Masters in professional engineering. In this cohort, 25.7% of the students took at least one bridging mathematics units prior to the core mathematics units required for engineering.
The WAM for this cohort is left skewed, with minimum 2.7, maximum 94.8 and mean 63.3. A majority (76.6%) of the cohort has a WAM between 50 and 80. Students with WAM below 50 make up about 14.5% of the cohort; 97% of this group did not complete the undergraduate engineering course.
Table summarises the completion of engineering undergraduate degree (EngUG) and MPE by mathematics level in university and high school. Note that all students who complete the MPE would have completed the undergraduate in engineering. The table shows students taking higher level mathematics in high school have a higher completion rate for the engineering undergraduate. Similarly for students taking higher level mathematics in university. Interestingly, students taking the intermediate high school mathematics (MAT3CD) have the highest MPE completion rate at 58.3%, slightly ahead of those taking the advance mathematics at 57.9%. Taking the lowest level mathematics corresponds to the lowest completion rate for MPE at 37%. This similar trend can be seen in university level mathematics, with students taking second-year mathematics having the highest MPE completion rate at 67.6% over those taking third year mathematics at 62.5%. Those taking only first-year mathematics at university have the lowest completion rates. Students who take up to third-year mathematics units have the highest rate of completion of the undergraduate in engineering, but this does not translate to MPE completion.
Table 2. Summary of successful completion by highest level of mathematics taken in university and high school.
Table compares the highest marks obtained in university mathematics unit (UniHighM) and high school (HSHighM) with completion of MPE and EngUG. It shows that those who complete their MPE have a higher mean UniHighM and HSHighM compared to those who do not. Similarly those who complete their engineering undergraduate have a higher mean UniHighM and HSHighM compared to those who do not. Tables and show that students who complete their engineering studies take the more difficult maths and also perform better in engineering.
Table 3. Summary of completion by highest mathematics marks in university and high school.
3.1. Linear model for WAM
Table shows the statistically significant variables in the model for WAM. The model shows the following.
Age: Students with age between 22 and 25 have on average 3.03 lower WAM than the other age groups.
Standing: Students with good standing have on average 4.63 higher WAM than those with other Standings (Exclusion, Expulsion, Probation).
Status: Compared with students who have completed their degrees, Discontinued students have on average 6.33 lower WAM, Enrolled students have on average 2.35 lower WAM, and inactive students have on average 8.36 lower WAM.
Students who have repeated a mathematics unit have on average 4.67 lower WAM.
NoU (Number of mathematics Units): Compared with students who took four or fewer mathematics units at university, those who took 5 mathematics units have on average 2.65 lower WAM, while those who took 6 mathematics units have on average 4.72 lower WAM.
MATH1001: An increase of 10 marks in MATH1001 results in an average increase of 1.7 in WAM.
MATH1002: An increase of 10 marks in MATH1002 results in an average increase of 2.6 in WAM.
TER: An increase of 10 in TER gives an average increase of 2.5 in WAM.
UniHighM: An increase of 10 in a students highest university mathematics mark results in an average increase of 0.8 in WAM.
Table 4. Significant variables for model for WAM.
The results show that performance in mathematics is strongly associated with overall performance in engineering, as measured by the WAM.
Model assumptions (appropriateness of linear model, homoscedacity and normality of residuals) were verified by residual plots.
3.2. Logistic regression model for completion
Table shows the statistically significant variables in the model for completion of EngUG. The variables Gender, Citizenship, Status, Standing, MATH1001, MATH1002, UniHighM, Repeat, NoU, HSHighM and HSLevel were insignificant in the model. The effects of the significant variables are as below.
WAM: An increase of 1% in WAM increases the odds of completing engineering undergraduate by 22%.
UniLevel: Taking a second-year mathematics unit gives 2.5 times the odds of completing engineering undergraduate compared to those who only did first-year mathematics units.
Age: The odds of completing engineering undergraduate for students aged higher than 25 is 9.6% of the odds for students aged 18.
TER: An increase of 1 in TER decreases the odds of completing engineering undergraduate by a factor of 0.94.
Table 5. Significant variables for model with EngUG completion as response.
Table shows the statistically significant variables in the model for completion of MPE. The variables Gender, Status, Standing, UniHighM, Repeat, NoU and HSLevel were insignificant in the model. The effects of the significant variables are as below.
WAM: An increase of 1% in WAM increases the odds of completing MPE by 10%.
Age: The odds of completing MPE for students aged 19 is 38%, aged 20 is 45%, aged 21 is 27% and aged between 22 and 25 is 2.7% of the odds for students aged 18.
Citizenship: The odds of completing MPE for international students is 3.6 times that for domestic students.
MATH1001: An increase of 1% in MATH1001 decreases the odds of completing MPE by a factor of 0.96.
MATH1002: An increase of 1% in MATH1002 increases the odds of completing MPE by a factor of 1.04.
HSHighM: An increase of 1% in HSHighM gives 7% lower odds to complete MPE.
Table 6. Significant variables for model with MPE as response.
3.3. PCA
Principal Component Analysis was performed on the continuous variables of the data: Age, HSHighM, WAM, Min, Max and TER. The first three components contained 86% of the variation in the data, and the loadings for these are shown in Table .
Table 7. Loadings for first three principal components.
The first principal component, PC1, is essentially a weighted average of the performance variables, with Age having an opposite sign. This component takes large negative values for large values of the performance variables and lower Age. Conversely, for older students who do not perform so well, PC1 is large positive. The second principal component, PC2, is not very interesting, and takes large values for older students who have high minimum and maximum marks, that is, have done well. Finally, PC3 is a contrast between student background variables and performance at university. This component is large for older students who performed well in high school but badly at university. As such, large values of PC3 correspond to under-performing older students relative to their high school performance, and low values correspond to younger students who did poorly in year 12 but relatively well at university. Medium values of PC3 correspond to students who performed similarly in high school and university.
Figure is a plot of the third principal component against the first. The plotting symbol is the completion status (C = completed, D = Discontinued), colour coded by high school mathematics unit. The completion status is well separated in this plot. Of particular interest are the C (completed) and D (discontinued) levels. Students who have completed a degree at UWA correspond to those who did well in high school mathematics and obtained high minimum and maximum marks in university mathematics. Most of these students complete MAS3CD, the highest level mathematics, in high school. About half the students who discontinued took lower level mathematics in high school (see also Table ).
Figure 2. Plot of PC3 against PC1. Colour indicates high school mathematics unit and plotting symbol completions status (C = completed, D = not completed).
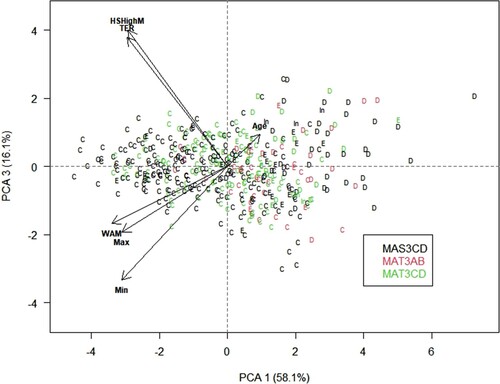
Table 8. Completion status by high school mathematics unit.
3.4. Kmeans
Kmeans clustering was performed on the continuous variables of the data, as for PCA. Figure shows a plot of the clusters, with the plotting symbol as completion status (Figure a) and high school mathematics unit (Figure b). Three clusters (k=3) best separated the data. The plot shows three distinct clusters with little overlap. Table shows a count of some key variables corresponding to each cluster; in particular the WAM category and the completion of MPE and engineering undergraduate.
Figure 3. Plot of WAM against high school mathematics marks by clusters: (a) completion status by cluster and (b) high school mathematics unit by cluster.
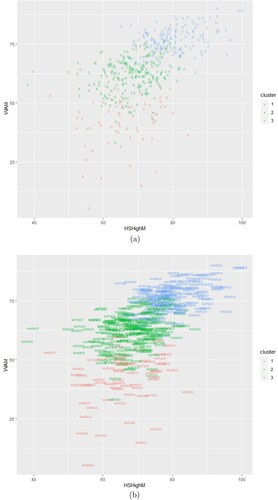
Table 9. Summary of clusters by key variables.
The first cluster contains students who have a high WAM, most above a 70. Almost all of the first cluster has completed their undergraduate (92%) in engineering and the majority (72%) completed their MPE. This cluster contains mostly students who took the advanced mathematics (MAS3CD) whilst also performing well in it, with a majority averaging above 70. The second cluster contains students with mid-range WAM, between 60 and 80. This cluster has a lower proportion of students completing their undergraduate (72%) and MPE (60%) compared to the first cluster. This cluster has students who took the advanced MAS3CD (45%) and the intermediate MAT3CD (44%). These students have an average mark of between 60 and 80 in their high school mathematics. Finally the third cluster has students with lower WAM, with most below 60. The cluster also has low rates of completion, with 15% completing undergraduate and only 3% completing MPE. Only the first cluster contained students with a WAM of over 80 and only one student in this cluster had a WAM below 60.
4. Survey and interview results
In this section, we explore and analyse the survey and student interview data. We use logistic regression models to fit intention of completion and the view of students regarding the importance of mathematics for engineering. The main themes from the student interviews include students' perceptions regarding the importance and relevance of mathematics in engineering, their attitudes towards mathematics, their intentions to complete engineering and issues raised about the way mathematics is taught and used in engineering.
Of the cohort of 692 students enrolled in engineering, a total of 289 students responded to the survey, consisting of 172 undergraduate students and 118 MPE students. Table shows the variables obtained in the survey. Of the undergraduate students, 96.5% (166) said they intended to complete the undergraduate studies whilst 79% (136) said they intended to complete the MPE. Table shows a summary of the undergraduate student characteristics against their completion intentions. Females have a slightly higher intention to complete their studies compared to males. The intention to complete undergraduate studies shows an expected increasing trend as the student's year level increases. Interestingly, compared with both first- and third-year students, there is a smaller percentage of second-year students who intend to complete their MPE. Students who did higher level mathematics in high school have a greater intention of completion. It is interesting to note that there is a greater percentage of students who took the lowest level of mathematics in high school but intend to complete the MPE; however, due to the low number in MAT3AB, this is not a clear trend.
Table 10. List of variables from the survey.
Table 11. Summary of undergraduate student characteristics and completion intention.
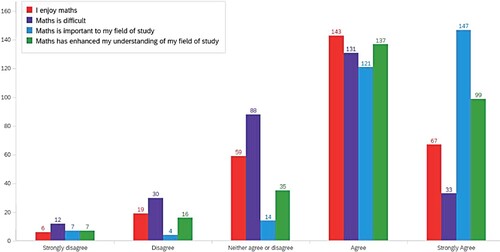
Figure shows a bar graph of the main attitude questions asked in the survey. The findings are summarised below.
71% found mathematics enjoyable.
55.7% found mathematics difficult.
91% found mathematics to be important to engineering.
80.3% found mathematics enhanced their understanding of engineering.
Figure 4. Bar graph of main mathematics attitudes questions.
4.1. Analysis of survey data
A binomial logistic model was fitted to the binary variable importance of mathematics against all other variables listed in Table . Table shows that relevance, enjoyability, difficulty and enhance understanding were the significant variables. Specifically, the odds of agreeing that mathematics is important for engineering was
27.4 times that for students who considered mathematics to be relevant to engineering compared with those who did not.
11.0 times that for students who enjoyed mathematics compared with those who did not.
13.3 times that for students who considered mathematics to be difficult compared with those who did not.
84.8 times that for students who considered that mathematics enhanced understanding of engineering concepts compared with those who did not.
Table 12. Significant variables from fitting logistic model with Importance as response.
A binomial logistic model was also fitted to IntendMPE (intention to complete MPE) and IntendEngUG (intention to complete the engineering undergraduate) against all other variables. For these two models, the MPE students were removed since they have already competed their undergraduate degree and were already undertaking MPE.
Tables and show that the only significant variable for both cases was enjoyability. If a student finds mathematics enjoyable, the odds for intending compared to not intending to complete their undergraduate is increased by a factor of 20, whilst the odds for intending compared with not intending to complete their MPE is increased by a factor of 3.5.
Table 13. Significant variables from fitting logistic model with IntendEngUG as response.
Table 14. Significant variables from fitting logistic model with IntendMPE as response.
4.2. Interview themes
The interviewed students consisted of two Masters students, one third-year and one second-year students. Due to the voluntary nature and lack of availability, we were unable to interview any first-year students nor have a larger sample size. In the interviews, we discussed the students' perceptions and attitudes towards mathematics and the role mathematics has played in their engineering studies. Four themes were identified in the interviews.
4.2.1. Theme 1: relevance and importance of mathematics in engineering
Students could see the relevance and importance of mathematics in engineering. However, they had different opinions regarding the use of mathematics in engineering. Two students said mathematics is an important tool used in engineering to solve problems whilst to the other two it was a subject of study containing transferable skills for engineering.
Overall, all the students saw the relevance of mathematics to engineering and none viewed mathematics in a negative manner.
4.2.2. Theme 2: enjoyment of mathematics
All interviewed students expressed some sense of enjoyment of mathematics. However, some talked about how they know ‘it's not very common’ and how others would ‘struggle with the maths side’ and would ‘stay away from it as much as possible’. This suggests the enjoyment of mathematics is not the case for all students.
4.2.3. Theme 3: intentions on completing engineering
When asked about whether they have ever thought about leaving engineering, all indicated that they had not. One of the students had changed degrees from accounting to study engineering. When asked why she made this change, she stated she ‘wanted to do more maths’. However it is important to note that all interviewed students found minimal difficulties in their studies and voiced their mathematical ability to be sufficient. Due to the voluntary nature of the interviews, we could not talk to students on the other side of the spectrum; those who struggled with mathematics nor those who have wanted to leave engineering.
4.2.4. Theme 4: teaching of mathematics in engineering
All the students voiced various concerns regarding the effectiveness of mathematics teaching in engineering. These concerns seem to stem from the structure of the engineering course and the fact that the mathematics is taught in a separate unit. Because of this, inconsistencies in teaching mathematical concepts arise which affect the effectiveness of mathematics teaching and ultimately causes negative perceptions of mathematics. The most common concerns include the application of mathematical concepts in engineering teaching, using different methods and notations, mathematics being taught long before it is used in engineering and the need for more engineering context-based problem solving in mathematics.
Students noted that engineering lecturers will make assumptions on student knowledge behind mathematical concepts. They also voiced the need for engineering educators to spend more time going through the mathematical details.
The fact that the mathematics is taught ahead of time and for the ‘future’ means the students do not apply the mathematics in engineering whilst the mathematics is fresh in their minds. This leads to less effective learning as students often struggle to remember the details behind mathematics concepts and thus struggle to understand how to apply it to engineering.
Ultimately, these issues are the result of mathematics and engineering being taught in different units, by different lecturers. This supports the idea that there must be a unified approach, one where the mathematics and engineering departments communicate and work together.
5. Discussion
The purpose of this study was to complement current literature in investigating the importance of mathematics to academic success as well as persistence in engineering. Student data from UWA records for the 2013 engineering cohort were obtained. The data included the mathematics units taken in high school and university. Statistical models were used to investigate the effect of mathematics on WAM and completion of undergraduate engineering and Masters of Professional Engineering (MPE). Further principal component analysis and k-means clustering were used to reveal patterns and relationships in the data.
We summarise the mathematical background and its relationship to engineering into seven factors to explore whether mathematics has any impact on academic success and persistence.
5.1. Factors affecting performance measured by WAM
Previous research has found factors relating to a students' high school performance, such as mathematics SAT scores and high school rank, to be significant predictors of university GPA or equivalent (French et al., Citation2005; Kauffmann et al., Citation2007). Our findings are consistent with this, as our multiple linear regression analysis determined that TER (high school rank equivalent) is a significant factor in predicting WAM.
Additionally, our model confirms our interpretation of the PCA, where students beginning engineering at an age between 22 and 25 will have on average a lower WAM compared to younger ages. This is not surprising as students who are younger would have entered university straight from high school whilst those 22 or older would have entered through alternative pathways or taken a few years off study after high school.
In terms of the factors related to mathematics, the predictors repeat, number of mathematics units, MATH1001 and MATH1002 marks and UniHighM were all significant. Unsurprisingly, students who have to repeat mathematics units have a lower WAM as they would have failed mathematics and perhaps other units, resulting in a lower WAM. The data further shows that in general repeating students do not do well at subsequent attempts. Also expected is that students with higher marks in core mathematics units MATH1001 MATH1002 will have a higher WAM. Similarly for UniHighM, the highest mark in university mathematics. An interesting result is that students who take more than five mathematics units have a lower average WAM. The engineering course at UWA may require two bridging units, two core mathematics units and a second-year mathematics unit for some engineering disciplines. Thus students who have taken five or more mathematics units have come from a lower mathematics background. Alternatively, these students have taken additional higher level mathematics units at second- and third-year levels which are more difficult. This explains the apparent contradiction.
5.2. Factors affecting completion of engineering
From the logistic regression models (Table ), WAM, Age and TER are significant factors in determining the completion of an undergraduate engineering degree. As expected, students with a higher weighted average mark is more likely to complete their course. Students aged 25 or over at the time of enrolment have a lower WAM, and this affects their completion.
The only factor related to mathematics that was significant is UniLevel with students who take a second-year maths unit more likely to complete their degree compared to those who only take first-year mathematics units. While this partly depends on the specific engineering discipline, students do have the option of taking a second year mathematics unit. This suggests students who undertake additional mathematics units have a higher likelihood of completion.
For MPE, again a higher WAM gives greater odds of completing MPE. The student age at enrolment is also significant, with ages 19 and above having lower odds of completion compared to those aged 18. This is consistent with our interpretation of the PCA (Figure ). Students aged between 22 and 25 have 2.6% of odds of completion compared with 18-year olds. This may be partly explained by the additional 2 years to complete the masters course, with older students opting to enter the workforce instead. International students have significantly larger odds of completing the MPE compared to domestic students.
Finally in terms of mathematical factors, only MATH1001, MATH1002 and HSHighM were significant. Interestingly, a better mark in MATH1001 gives slightly lower odds, whilst a better mark in MATH1002 gives a slightly higher odds of completing MPE. This is caused by a handful of Bachelor of Philosophy students (advanced stream students) and some bright students who changed courses after one semester. Also interesting is that a higher mark in the highest level of high school maths gives a slightly lower odds of completion. This may also be due to the bright students changing courses.
We also looked at exploratory factors that may affect completion. From the logistic models fitted to student completion intentions (Tables and ), the only significant factor was enjoyment of mathematice, with the odds for completion of undergraduate and MPE increasing by a factor of 20 and 3.5 respectively. This suggests students who enjoy mathematics are more likely to complete their engineering courses, and students who do not enjoy mathematics are more likely to drop out or switch degrees. This enjoyment of mathematics can also be seen in the student interviews.
5.3. Students perceptions and attitudes towards mathematics
In the interviews, all four students indicated a sense of enjoyment of mathematics. However, they mentioned that this is not the case for all students in engineering and that others try to ‘stay away from it as much as possible’. This is also seen in the literature. Shaw and Shaw (Citation1997) found 16% of students did not enjoy maths before university, and this increased to 51% after first year. Since enjoyment is a significant factor to the intentions of student completion, it is important for educators to investigate why students do not enjoy mathematics.
The logistic model in Table suggests student enjoyment is also significant to whether they think mathematics is important for engineering. Besides enjoying maths, students who find mathematics relevant to engineering, find maths difficult or believe mathematics enhances understanding of engineering are all more likely to perceive mathematics as important to engineering. This was also seen in the interviews, with students viewing mathematics as a relevant tool to solve engineering problems and enhance problem solving skills.
5.4. Issues in teaching mathematics
As discussed in Section 4.2.4, students voiced various issues including the assumption of knowledge by educators, inconsistencies in notation and methods between mathematics and engineering lecturers and mathematics being taught for the future. These issues are mainly due to the result of mathematics and engineering being taught in different units by different lecturers. This causes students to feel there is a ‘bridge’ and a ‘wall’ between the subjects. These findings are consistent with those by Flegg et al. (Citation2012), who also found similar curriculum issues. The students in their study were also learning mathematics in a separate unit to engineering.
6. Conclusion
Engineers are important to the economic growth of a country. They develop new and innovative technologies to improve lives and provide solutions to problems in business, medicine, social services and utilities. However, retention of students in engineering remains a significant issue.
The primary focus of this study was to investigate the importance of mathematics to academic performance and completion in engineering. From this study, we conclude that mathematics is a barrier for completion of the engineering degree. Further, students who perform better in mathematics also perform better in engineering. An additional finding is that older students perform worse than younger ones and are less likely to complete engineering. It is very likely that these students fail to succeed because their mathematical knowledge is ‘rusty’. Such students require more support and assistance, and should perhaps undertake a diagnostic test that may direct them to an appropriate bridging unit.
A final relevant finding teaching mathematics and engineering separately and with a delay of up to 2 years makes it difficult for students to make the connection. A further issue is the difference in notation and methods used by lecturers in mathematics and engineering. A unified approach between the mathematics and engineering departments is ideal. This will require a rethinking on the part of curriculum designers and university administration.
Disclosure statement
No potential conflict of interest was reported by the authors.
References
- Bell, M., Briggs, P., Romanis, J., & MacMaster, J. (2022). Strengthening the engineering workforce in Australia: Solutions to address the skills shortage in the short, medium, and long term (Tech. Rep.). Engineers Australia.
- Department of Education, Australian Government (2022, September 15). Student data. (Accessed: 15-09-2022). https://www.education.gov.au/higher-education-statistics/student-data.
- De Winter, J. C. F., & Dodou, D. (2011). Predicting academic performance in engineering using high school exam scores. International Journal of Engineering Education, 27(6), 1343.
- Faraway, J. J. (2014). Linear models with R (2nd ed.). Chapman and Hall.
- Faraway, J. J. (2016). Extending the linear model with R (2nd ed.). Chapman and Hall.
- Finkel, A., Brown, T., Wright, J., & Wienk, M. (2020). Mapping university prerequisites in Australia (Tech. Rep.). Australian Mathematical Sciences Institute.
- Flegg, J., Mallet, D., & Lupton, M. (2012). Students' perceptions of the relevance of mathematics in engineering. International Journal of Mathematical Education in Science and Technology, 43(6), 717–732. https://doi.org/10.1080/0020739X.2011.644333
- French, B. F., Immekus, J. C., & Oakes, W. C. (2005). An examination of indicators of engineering students' success and persistence. Journal of Engineering Education, 94(4), 419–425. https://doi.org/10.1002/jee.2005.94.issue-4
- Godfrey, E., Aubrey, T., & King, R. (2010). Who leaves and who stays? Retention and attrition in engineering education. Engineering Education, 5(2), 26–40. https://doi.org/10.11120/ened.2010.05020026
- Hine, G. (2019). Reasons why I didn't enrol in a higher-level mathematics course: Listening to the voice of Australian senior secondary students. Research in Mathematics Education, 21(3), 295–313. https://doi.org/10.1080/14794802.2019.1599998
- Barry, S.I., & Chapman, J. (2007). Predicting university performance. ANZIAM Journal, 49, C36–C50. https://doi.org/10.21914/anziamj.v49i0.304
- International Engineering Alliance (2021, June 21). Graduate attributes and professional competences (Version 4 Accessed: 15-09-2022). https://www.ieagreements.org/assets/Uploads/IEA-Graduate-Attributes-and-Professional-Competencies-2021.1-Sept-2021.pdf.
- Kauffmann, P., Abdel-Salam, T., & Garner, J. (2007, June). Predictors of success in the first two years: A tool for retention. In Annual conference of American Society for Engineering Education. Pacific Southeast.
- Lee, S., Harrison, M. C., Pell, G., & Robinson, C. L. (2008). Predicting performance of first year engineering students and the importance of assessment tools therein. Engineering Education, 3(1), 44–51. https://doi.org/10.11120/ened.2008.03010044
- Li, Y. G., & Wu, H. Y. (2012). A clustering method based on k-means algorithm. Physics Procedia, 25, 1104–1109. https://doi.org/10.1016/j.phpro.2012.03.206
- Morán-Soto, G., & Benson, L. (2018). Relationship of mathematics self-efficacy and competence with behaviors and attitudes of engineering students with poor mathematics. International Journal of Education in Mathematics, Science and Technology, 6(3), 200–220. https://doi.org/10.18404/ijemst.428165
- R Core Team (2020). R: A language and environment for statistical computing. R Foundation for Statistical Computing, Vienna, Austria.
- Seymour, E., & Hewitt, N. M. (1997). Talking about leaving. Westview Press.
- Shaw, C. T., & Shaw, V. F. (1997). Attitudes of first-year engineering students to mathematics–a case study. International Journal of Mathematical Education in Science and Technology, 28(2), 289–301. https://doi.org/10.1080/0020739970280210
- Suresh, R. (2006). The relationship between barrier courses and persistence in engineering. Journal of College Student Retention: Research, Theory & Practice, 8(2), 215–239. https://doi.org/10.2190/3QTU-6EEL-HQHF-XYF0
- Wienk, M. (2022). Year 12 mathematics participation report card (Tech. Rep.). AMSI. https://amsi.org.au/wp-content/uploads/2022/04/year-12-participation-2022.pdf.
- Wold, S., Esbensen, K., & Geladi, P. (1987). Principal component analysis. Chemometrics and Intelligent Laboratory Systems, 2(1–3), 37–52. https://doi.org/10.1016/0169-7439(87)80084-9
- Wu, J. J. (2012). Advances in K-means clustering: A data mining thinking. Springer Science & Business Media.
- Zhang, G., Anderson, T. J., Ohland, M. W., & Thorndyke, B. R. (2004). Identifying factors influencing engineering student graduation: A longitudinal and cross-institutional study. Journal of Engineering Education, 93(4), 313–320. https://doi.org/10.1002/jee.2004.93.issue-4