
Abstract
Background
Diabetes-associated cognitive dysfunction (DACD) is a chronic ailment that exerts a substantial influence on the overall well-being of individuals. The hippocampus assumes a pivotal role in the progression and sustenance of cognitive impairment. The identification of differentially expressed proteins (DEPs) in the hippocampus is crucial for understanding the mechanisms of DACD.
Methods
A rat model of DACD was established by a high-fat diet combined with streptozotocin intraperitoneal injection. The Morris water maze (MWM), hematoxylin and eosin (H&E) staining, Nissl staining, and transmission electron microscope (TEM) were performed on the rats. The proteins expressed in the hippocampus were detected using 4D label-free quantitative proteomics. Four DEPs, namely Nptx1, Ptpmt1, Slc25a11, and Cpt1c, were validated using parallel reaction monitoring (PRM).
Result
Our study found that hippocampal lesions were present in the DACD rat models. There were 59 up-regulated and 98 down-regulated DEPs in the Model group compared to the Control group. We found that the levels of Nptx1, Ptpmt1, Slc25a11, and Cpt1c were elevated in the Model group, which are important for cell mitochondrial function. It should be noted that in our study, we only used PRM to validate the expression of these proteins. However, more evidence is needed to establish the relationship between these protein changes and DACD.
Conclusion
Our research results may provide further insight into the molecular pathology of hippocampal injury in DACD. In addition, further studies and clinical trials are required to confirm our findings and establish a more conclusive molecular mechanism for DACD.
1. Introduction
Diabetes mellitus (DM), a chronic metabolic disease, is characterized by high levels of blood glucose and impaired responsiveness to insulin [Citation1]. According to the International Diabetes Federation, there were 425 million patients with DM globally in 2017, and it is projected to reach 700 million by 2045, with 90% of them having type 2 diabetes mellitus (T2DM) [Citation2]. DM and its complications have a severe impact on individual health and impose a significant burden on healthcare systems. Cognition is the mix of consciousness, attention, familiarity, memory, decision-making, and judgments [Citation3]. Cognitive impairment is a pathological state that is linked to a variety of neurodegenerative conditions, including Alzheimer’s disease (AD), Parkinson’s disease (PD), depression, and schizophrenia [Citation3]. In 2021, the American Diabetes Association guidelines explicitly identified diabetes-associated cognitive dysfunction (DACD) as a common complication of T2DM and indicated that the severity of cognitive impairment worsens significantly with the progression of DM [Citation4]. The hallmark features of DACD include cognitive impairment, delayed executive function, and hindered information processing speed [Citation5]. Nowadays, due to limited research on DACD, its pathogenesis remains incompletely understood. The hippocampus, as the most primitive cortical structure, is widely recognized to play a crucial role in memory function [Citation6]. Damage to the hippocampus primarily results in memory impairments, particularly affecting short-term memory and spatial memory [Citation7]. Studies have reported the presence of hippocampal lesions in DACD [Citation8]. Research has shown that individuals with DM are 1.44 times more likely to experience cognitive dysfunction compared to individuals without DM [Citation9], and approximately 60–70% of patients with DM exhibit cognitive impairments, such as slowed learning and memory, decreased reasoning ability, and a lack of concentration [Citation10,Citation11]. Epidemiological evidence has indicated a robust association between DM and an elevated risk of dementia and AD, with DM leading to a 2–3 times higher relative risk of developing AD [Citation12].
Proteomics is employed for large-scale studies of protein expression changes. Currently, liquid chromatography (LC) has emerged as a powerful technique capable of continuously separating thousands of proteins. It can be coupled with mass spectrometry (MS) online to achieve higher throughput [Citation13]. Recently, label-free quantitative proteomics has been widely applied to identify disease-associated proteins [Citation14,Citation15]. To elucidate protein expression changes involved in DACD pathogenesis, the 4D label-free LC-MS/MS was applied to detect differentially expressed proteins (DEPs) in the hippocampus of DACD rats. Bioinformatic analyses were conducted based on DEPs, including Gene Ontology (GO) and Kyoto Encyclopedia of Genes and Genomes (KEGG) pathways. In our study, we selected four DEPs associated with mitochondrial function for parallel reaction monitoring (PRM) analysis, including Nptx1, Ptpmt1, Slc25a11, and Cpt1c. The findings will enable us to better understand hippocampal lesions at the DACD molecular level, and they may provide a foundation for understanding the mechanisms and targeting treatments for DACD, which in turn helps reduce the incidence of DACD.
2. Methods
2.1. Establishment of the T2DM rat models
Male Sprague-Dawley (SD) rats (180–200 g) were purchased from the Animal Center of Kunming Medical University (Kunming, China) and housed under controlled conditions (24–26 °C, 12-h alternating light/dark cycle) with ad libitum access to water and food. All animal care procedures were conducted in accordance with local and international guidelines for the care and use of laboratory animals and were approved by the Ethics Committee of Kunming Medical University (Approval No. kmmu20220850). The rats were randomly divided into the Control group (n = 8; fed a regular diet) and the Model group (n = 8; fed a high-fat diet). Following 6 weeks of being on a regular or high-fat diet, the Model group received streptozotocin (Sigma-Aldrich, USA) injections (35 mg/kg, intraperitoneal injection) once. The Control group received the same amount of citrate buffer. Three days after the STZ injection, rats with fasting blood glucose levels greater than 16.7 mmol/L were diagnosed with T2DM. After successful modeling, the rat models were maintained for an additional 8 weeks, with fasting blood glucose measured once a week.
2.2. Morris water maze (MWM)
The Morris water maze (MWM) test was conducted to assess the spatial learning and memory abilities of the rats (n = 16, 8 in each group). The water maze area was divided into four equal quadrants, with a hidden platform located at the center of one of the quadrants and about 2 cm below the water surface. The test consisted of place navigation and spatial probe test. (1) Place navigation test was conducted to evaluate the rats’ spatial learning. Rats were trained for five consecutive days, during which they were placed facing the pool wall and released from each of the four quadrants sequentially. Each rat was allowed to freely swim to find the hidden platform within 90 s. If a rat found the platform and stayed on it for more than 5 s, the test was terminated, and the time taken to find the platform (escape latency) was recorded. If a rat failed to find the platform within 90 s, it was guided to the platform and allowed to stay on it for 15 s, and the escape latency was recorded as 90 s. (2) The spatial probe test was conducted on the sixth day. The hidden platform was removed, and the time spent by each rat in the target quadrant within 90 s and the number of times the rats crossed the platform location were recorded.
2.3. Sample collection
Pentobarbital was used as an intraperitoneal injection (1%, 10 mL/100 g) to anesthetize all of the animals. Following the administration of anesthesia, the animals’ cerebral cavities were opened, their brains were promptly removed, and they were sacrificed by cervical dislocation. Conventional saline was used to rinse the brains concurrently. Following this, the hippocampal tissues were quickly isolated (the entire procedure was done on ice), two hippocampal samples from each group were fixed for later histopathological investigations to evaluate hippocampal morphology, and the six hippocampal samples in each group were stored at −80 °C for future protein extraction.
2.4. Hematoxylin and eosin (H&E) and Nissl staining
The hippocampuses were fixed in 4% paraformaldehyde for 24 h and then embedded in paraffin (n = 4, 2 in each group). Subsequently, the hippocampal CA1 region tissue sections of 4 μm thickness were prepared for both Hematoxylin and Eosin (H&E) staining and Nissl staining. Images were observed and analyzed under a microscope (Eclipse E100, Nikon, Japan).
2.5. Sample preparation for transmission electron microscope (TEM)
Briefly, the hippocampal CA1 region measuring 1 mm × 1 mm × 1 mm was placed in 2.5% glutaraldehyde phosphate buffer (4 °C, pH = 7.4) for fixation for 4 h (n = 4, 2 in each group). Subsequently, ethanol and acetone were used to perform dehydration. Next, embed and cut into thin sections of 60 nm thickness, and then stained with lead citrate for 5–6 min and uranyl acetate for 20 min, respectively. Finally, the TEM (JEM1230) was applied for microscopic imaging.
2.6. Protein extraction and trypsin digestion
Proteomic analysis was performed on hippocampal tissue samples from each group of rats (n = 6, 3 in each group). Hippocampal tissue samples were ground into cellular powder using liquid nitrogen and transferred to centrifuge tubes. A four-volume lysis buffer mixture containing 8 M urea and a 1% protease inhibitor cocktail was added to the tubes. The mixture was then subjected to three rounds of treatment using a high-intensity ultrasonicator (Scientz). Subsequently, centrifugation was carried out at 12,000 × g for 10 min at 4 °C. Any remaining debris was removed, and the supernatant was collected. The protein concentration of the three samples was then determined using a BCA kit (Abcam; Abcam PLC, Cambridge, UK). For trypsin digestion, 5 mM dithiothreitol (Sigma, USA) was added to the protein solution, and the mixture was incubated at 56 °C. After a 30-min reduction reaction, 11 mM iodoacetamide (Sigma, USA) was added in the dark, and alkylation was continued at room temperature for 15 min. Upon completion of the reaction, the protein samples were diluted with 100 mM TEAB (Sigma, USA) to achieve a urea concentration of less than 2 M in the protein solution. Finally, trypsin (Promega, Madison, WI, USA) was added to the solution at a 1:50 ratio (trypsin-to-protein mass ratio) for the first overnight enzyme digestion, followed by a second digestion at a 4:1 ratio (trypsin-to-protein mass ratio) for 100 h.
2.7. Liquid chromatography-tandem mass spectrometry analysis-4D mass spectrometer
Each sample was subjected to separation using a nanoflow high-performance liquid chromatography (HPLC) system, Easy nLC. Buffer A was a 0.1% formic acid aqueous solution, and Buffer B was a 0.1% formic acid acetonitrile aqueous solution (84% acetonitrile). The chromatographic column was balanced with 95% buffer A. Samples were loaded onto a precolumn (Thermo Scientific Acclaim PepMap100, 100 μm × 2 cm, nanofiber C18) through an autosampler and then separated through an analytical column (Thermo Scientific EASY column, 10 cm, ID 75 μm, 3 μm, C18-A2) at a flow rate of 300 nL/min. Following chromatographic separation, the samples were analyzed using the Pro mass spectrometer. The detection mode was positive ion, with an ion source voltage set at 1.5 kV. Both MS and MS/MS analyses were performed using TOF detection. The mass scan range was set from 100 to 1700 m/z. Data acquisition was carried out in Parallel Accumulation Serial Fragmentation (PASEF) mode, with 10 PASEF windows collected after each 1st-level mass spectrum and a cycle time of 1.17 s per window. MS/MS spectra for charge states between 0 and 5 were acquired, and a dynamic exclusion time of 24 s was set for tandem mass spectrometry scans to avoid redundant ion scans. MaxQuant software (version 1.6.14) was employed for database identification and quantitative analysis.
2.8. Bioinformatics analysis
A comparison was made between the relative protein expression levels of the Model group and the Control group, and the fold change (FC) was calculated for both groups. DEPs were identified based on the criteria of FC ≥ 1.2 or FC ≤ 0.83 and Q ≤ 0.05 [Citation16]. The Complexheatmap R package (R Version 3.4) was utilized to conduct hierarchical clustering analysis of DEPs. Volcano plots and heat maps were employed as visual aids in the study. The subcellular localization and domain features of DEPs were examined by utilizing the CELLO database, accessible at http://cello.life.nctu.edu.tw/. The analysis of protein domains was performed utilizing the Pfam database. DEPs underwent Gene Ontology (GO) annotation and Kyoto Encyclopaedia of Genes and Genomes (KEGG) pathway enrichment analysis using the DAVID tool. A bubble chart was generated utilizing the bioinformatics online platform (www.bioinformatics.com.cn), which is freely available for the analysis of bioinformatics data.
2.9. Parallel reaction monitoring (PRM) for target protein validation
To further validate the expression of DEPs, we quantified the expression levels of the four selected proteins by PRM analysis using the remaining cryopreserved hippocampus samples (n = 6, 3 in each group). The protein extraction and trypsin digestion methods were consistent with those employed in the proteomic analysis experiment. Subsequently, peptide samples were subjected to analysis using the TripleTOF 5600+ mass spectrometer in conjunction with the Eksigent microLC system (AB SCIEX, Framingham, MA, USA). The resulting MS/MS data were processed using the ProteinpilotTM V4.5 search engine, followed by further analysis using the Skyline software. This comprehensive approach allowed us to obtain PRM spectrum files and quantitative information about the proteins.
2.10. Statistical analysis
The mean ± standard deviation was used to express all the data in this study. Plot creation and statistical analysis were performed using GraphPad Prism, version 9.0 (GraphPad Software, La Jolla, CA, United States). The t-test was employed to compare groups. The following values were regarded as statistically significant: *p < 0.05, **p < 0.01.
3. Results
3.1. Hippocampus undergoes functional abnormalities in T2DM rats
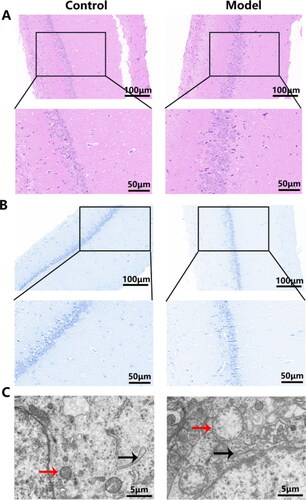
The MWM test was employed to assess spatial learning and memory functions in rats. The swimming trajectory on the day 5 of the place navigation test was depicted in . The swimming path during the spatial probe test was illustrated in . In comparison to the Control group, the Model group exhibited significantly increased escape latency during the place navigation trials from day 3 to day 5 (). In the spatial probe, T2DM rats spent less time in the platform quadrant and had fewer platform crossings compared with the Control group (). This result indicated that cognitive dysfunction exists in T2DM rats. Simultaneously, we noted that fasting blood glucose levels in the Model group of rats remained high throughout the experimental period, in contrast to the Control group (). Compared to the Control group, the hippocampal CA1 region in T2DM rats revealed cellular edema and disordered cell arrangement (). Furthermore, Nissl bodies were abundant in the CA1 region of the Control group hippocampus, whereas T2DM rats exhibited a reduction in Nissl bodies (). TEM displayed mild cellular swelling in hippocampal neurons of T2DM rats compared to normal rats, accompanied by a decrease in neuron count, blurry, fractured, and dissolved mitochondrial cristae, as well as localized disruption of the rough endoplasmic reticulum (RER) in certain areas (). These histological examinations revealed the existence of structural damage in the hippocampus of DACD rats.
Figure 1. MWM test and fasting blood glucose level of rats. (A) Swimming track of rats on day 5 of the place navigation test; (B) Swimming track of rats during the spatial probe test; (C) The escape latency of rats during the place navigation test; (D) Time spent in the platform quadrant of rats during the spatial probe test; (E) Platform crossing times of rats during the spatial probe test. (F) Fasting blood glucose level of rats. All data are expressed as means ± standard error. n = 8 rats per group. *p < 0.05, **p < 0.01, versus Control group.
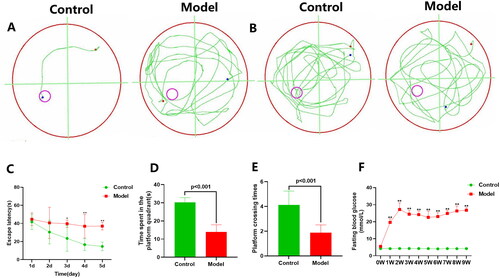
Figure 2. Morphological changes in the hippocampal CA1 area. (A) H and E staining of the hippocampal CA1 area. Upper lane, Scale bar = 100 μm, magnification × 200. (the inside area of the black rectangle. Scale bar = 50 μm, magnification × 400); (B) Nissl staining of the hippocampal CA1 neurons. Upper lane, Scale bar = 100 μm, magnification × 200. (the inside area of the black rectangle. Scale bar = 50 μm, magnification × 400); (C) TEM of the hippocampal CA1 neurons. Scale bar = 5 μm, magnification × 6000, mitochondria (red arrow), rough endoplasmic reticulum (black arrow). n = 2 rats per group.
3.2. Proteomic changes in the hippocampus of diabetic cognitive dysfunction rats
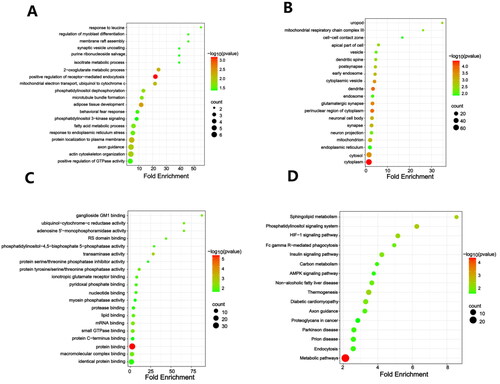
A total of 157 proteins were identified as statistically DEPs between the hippocampus of control and model rats, including 59 up-regulated proteins and 98 down-regulated proteins (). WoLF PSORT was employed to accurately predict the subcellular localization of the DEPs. It was observed that the DEPs were predominantly localized in the nucleus, followed by the cytoplasmic, extracellular, mitochondrial domains, and then the plasma membrane (). Further hierarchical clustering analysis demonstrated that the DEPs could effectively distinguish model rats from control rats (). In enrichment analysis, the SPFH domain/Band 7 family was the most significantly enriched domain among the DEPs (). Functional enrichment analysis performed by DAVID unveiled 35 significant biological processes (BP) in which DACD might be involved. Notably enriched BP included positive regulation of receptor-mediated endocytosis, adipose tissue development, the 2-oxoglutarate metabolic process, protein localization to the plasma membrane, and mitochondrial electron transport, ubiquinol to cytochrome c (). In terms of cellular components (CC), the results revealed that DACD potentially impacted 43 different cellular regions, with the cytoplasm, dendrite, and perinuclear region of cytoplasm being the most significant (). Lastly, the analysis identified 22 enriched molecular functions (MF) associated with DACD, including protein binding, transaminase activity, mRNA binding, and ganglioside GM1 binding (). Further KEGG pathway enrichment analysis, employing Fisher’s exact test, unveiled the involvement of DEPs in crucial pathways, such as metabolic pathways, phosphatidylinositol signaling system, sphingolipid metabolism, thermogenesis, HIF-1 signaling pathway, and insulin signaling pathway (), which are predominantly associated with metabolic processes. The detailed data were provided in the supplementary material.
Figure 3. Identification of DEPs in hippocampal tissues. (A) a volcano plot of quantified proteins when FC > 1.2; (B) Subcellular location; (C) Hierarchical clustering analysis of DEPs; (D) Bubble chart of the top 20 enriched domains. The abscissa represented rich factor, rich factor was defined as the number of DEPs annotated in the domain name divided by the total number of all identified proteins in the corresponding domain name. The color of bubble indicated the significance of enriched domain name and the color closer to red indicated greater significance. n = 3 rats per group.
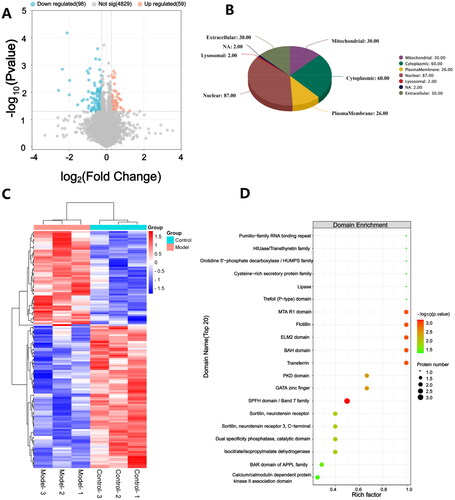
Figure 4. GO and KEGG analysis of DEPs. The figure includes bubble chart of (A) biological processes, (B) cellular components, (C) molecular functions, and (D) KEGG pathways. n = 3 rats per group.
3.3. Expression validation of proteins
We selected four DEPs for PRM analysis, including Nptx1, Ptpmt1, Slc25a11, and Cpt1c, which are important for cell mitochondrial function. The results showed that in the Model group, Nptx1, Ptpmt1, Slc25a11, and Cpt1c levels were up-regulated, which was consistent with the results of proteomics (, ). We hypothesize that mitochondrial dysfunction may exist in DACD rats.
Figure 5. Comparison of protein expression by 4D label-free quantitative proteomics and PRM. n = 3 rats per group.
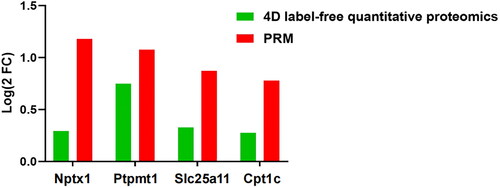
Table 1. Relative expression levels of selected proteins measured via PRM.
4. Discussion
DM is a complex condition that can lead to severe health complications and, in extreme cases, death if left untreated and uncontrolled [Citation17]. DACD has been recognized as a common complication of DM [Citation18]. With the ongoing trend of population aging and the increasing prevalence of DM, the number of DACD patients is expected to rise. Understanding the pathogenesis of DACD is crucial for clinical treatment. In this study, we established a T2DM rat model and conducted MWM tests, HE staining, and Nissl staining to confirm cognitive dysfunction in T2DM rats. TEM revealed mitochondrial structural damage in the hippocampus of DACD rats. Subsequently, hippocampal tissue was extracted from each group of rats for proteomic analysis, followed by validation using the PRM.
The hippocampus is in charge of conducting and storing spatial memory. It also collaborates with working memory and reference to form a spatial representation of the surroundings. Additionally, it controls both short-term and long-term memory to carry out the tasks [Citation19]. The MWM test was used to measure hippocampus-dependent cognitive function, as previously described [Citation20]. Methods for protein analysis in the field of proteomics include chemical labeling techniques such as iTRAQ [Citation21], ICAT [Citation22], and mTRAQ [Citation23]. Nonetheless, these labeling quantification approaches have certain limitations [Citation21–23]. As an alternative strategy, label-free quantification can circumvent these drawbacks. Label-free quantification proteomics typically offers a substantial depth of analysis and dynamic range, providing an advantage in scenarios involving extensive global protein changes across different treatments [Citation24]. In this study, 4D label-free quantitative proteomics was employed directly in the DACD rat models for protein profiling, aiming to identify DEPs in the hippocampal tissue. The results revealed a total of 157 DEPs in the hippocampus between the Control and Model groups. Notably, a substantial proportion of DEPs was localized within the mitochondria, which may suggest a significant role of mitochondrial dysfunction in DACD. Enrichment analysis highlighted the SPFH domain/Band 7 family as the most significantly enriched domain among the DEPs. To explore potential clinical intervention targets for this condition, further bioinformatics analysis of the DEPs was conducted. BP analysis showed positive regulation of receptor-mediated endocytosis, adipose tissue development, 2-oxoglutarate metabolic process, protein localization to plasma membrane, and mitochondrial electron transport. In terms of CC, enrichment was observed in the cytoplasm, dendrite, and perinuclear region of the cytoplasm. Regarding MF, enrichment was found in protein binding, transaminase activity, mRNA binding, and ganglioside GM1 binding. KEGG pathway enrichment analysis using Fisher’s exact test revealed the involvement of DEPs in crucial pathways, primarily associated with metabolism. All findings indicated that metabolic disruption emerges as a distinctive feature of DACD.
The mitochondrion is an organelle characterized by its dynamic nature, undergoing continuous multiplication through the processes of fission (division) and fusion (merging). The processes of mitochondrial fusion and fission are fundamental to the physiological functioning of cells, as well as being implicated in various pathological states affecting cells and tissues [Citation25]. The maintenance of mitochondrial homeostasis has a crucial role in the preservation of synaptic plasticity, which in turn contributes to the processes of learning and memory. The involvement of mitochondrial dysfunction is crucial in the etiology of AD [Citation25]. Both AD and DACD are classified as neurodegenerative disorders. In our study, it was shown that the structural integrity of DACD rats hippocampus mitochondria was compromised, and a significant number of DEPs were identified to be localized within the mitochondrial compartment. Based on the above findings, we wondered if mitochondrial dysfunction also exists in DACD. So in our next study, we selected four proteins associated with DACD for PRM analysis, including Nptx1, Ptpmt1, Slc25a11, and Cpt1c. These proteins are closely related to mitochondrial function. The findings demonstrated that in the Model group, the levels of Nptx1, Ptpmt1, Slc25a11, and Cpt1c were elevated, providing support for the credibility and dependability of the 4D label-free data. Our study primarily focused on exploring the roles of Nptx1, Ptpmt1, Slc25a11, and Cpt1c within the context of DACD.
Nptx1, also known as NP1, is a secreted glycoprotein with a molecular weight of 4,750 kDa [Citation26]. Nptx1 plays a crucial role in synaptic plasticity and neuronal synaptic growth [Citation27]. Elevated levels of Nptx1 can lead to mitochondrial damage and neuronal death [Citation28]. Nptx1 impacts mitochondria-mediated cell death by facilitating the translocation of apoptosis-promoting proteins Bad and Bax to the mitochondria, playing a key role in hypoxic-ischemic neuronal injury mediated by mitochondria [Citation29]. In a mouse model of Sandhoff disease (a lysosomal storage disorder characterized by cognitive impairment and ataxia), Nptx1 gene deficiency can protect mice from neuronal loss caused by brain hypoxia-ischemia, delaying neurodegeneration and extending lifespan [Citation30]. Nptx1 is associated with AD, being present around the amyloid plaques in the brains of AD patients, affecting glutamatergic transmission postsynaptically, and mediating the role of amyloid beta [Citation31]. Clayton et al. found an increase of Nptx1 in damaged neuronal synapses in AD brains, promoting the accumulation of Bax in mitochondrial membranes and regulating mitochondrial dynamics during granule neuron apoptosis. Reduced neuronal activity increases Nptx1 protein levels in mitochondria and promotes mitochondrial fragmentation in a Bax-dependent manner. Furthermore, Nptx1 is involved in mitochondrial transport in healthy neurons [Citation32]. These findings indicate that Nptx1 targets mitochondria upstream of Bax, revealing a novel role for Nptx1 in regulating mitochondrial dynamics and transport in apoptotic neurodegeneration. Additionally, there is a significant increase in Nptx1 in the brain tissue of late-onset AD patients [Citation33]. Similarly, our study found elevated levels of Nptx1 in the hippocampal tissue of DACD rats. This may promote the accumulation of Bax in the mitochondrial membrane, thereby promoting mitochondrial fracture. These current results may be crucial for understanding the mechanisms of neuronal dysfunction in chronic neurodegenerative diseases associated with mitochondrial functional changes.
Ptpmt1 is a discovered PTEN-like protein tyrosine phosphatase exclusively localized within mitochondria, primarily on the inner mitochondrial membrane in most tissues [Citation34]. Previous research has demonstrated that Ptpmt1 regulates proliferation, survival, and glucose metabolism in leukemia cells by inducing HIF2a expression, and it has been shown to play a significant role in mitochondrial function [Citation35]. A recent study revealed that Ptpmt1 knockout completely blocked the development of the cerebellum after birth, which may be that the loss of Ptpmt1 reduces mitochondrial aerobic metabolism by limiting the utilization of pyruvate [Citation36]. Notably, our study observed an elevation in the levels of Ptpmt1 in DACD rats, indicating it could potentially be an indication of mitochondrial metabolic disruption.
Slc25a is a key protein responsible for providing energy to cellular mitochondria, and this pivotal protein could be utilized to explore novel approaches for treating neurodegenerative diseases, cancer, and other disorders [Citation37]. Slc25a11 is found on the inner mitochondrial membrane and helps move α-ketoglutarate around by moving electrons [Citation38,Citation39]. Quantitative clinical proteomic studies on human brains that had a stroke after death have shown that Slc25a11 is downregulated [Citation40]. Slc25a11 has also been found to be a new late-onset AD locus [Citation41]. No previous studies on Slc25a11 in DACD have been reported. Our study is the first report on the expression of Slc25a11 in the hippocampus of DACD. In this study, upregulation of Slc25a11 was observed in DACD rats, which might contribute to metabolic discord between the cytoplasm and mitochondria, leading to energy metabolism dysfunction.
Cpt1c is a key enzyme involved in mitochondrial energy metabolism and fatty acid oxidation. It is widely distributed throughout the central nervous system and highly expressed in discrete brain regions, including the hypothalamus, hippocampus, amygdala, and various motor areas. Cpt1c is not only crucial for motor function, coordination, and energy homeostasis but also plays a vital role in maintaining cognitive functions related to learning and memory [Citation42]. Dozens of studies have suggested that Cpt1c may play a role in neural oxidative metabolism [Citation43]. The expression of Cpt1c in the hippocampus affects neural lipid levels, endocannabinoids, and oxidative processes, contributing significantly to various brain functions such as learning [Citation44]. Previous studies have shown that Cpt1cC may mitigate oxidative stress, apoptosis, and deposition of AD hallmark proteins in hippocampal neurons induced by Aβ25–35, indicating a potential beneficial role of Cpt1c in alleviating AD [Citation45]. However, our study revealed an upregulation of Cpt1c in DACD rats; this may be due to neural oxidative metabolism disruption in DACD.
As a signaling organelle, mitochondria have the ability to alter a variety of molecular processes to improve cellular bioenergetics and support neuronal survival. While it has been demonstrated that mitochondria can affect a variety of cellular processes, their ability to produce energy and withstand stress (known as mitochondrial fitness) is what ultimately determines whether brain cells survive, underscoring the crucial role mitochondria play in both health and sickness [Citation46]. Based on our findings, we hypothesize that mitochondrial dysfunction may be considered a driving force behind DACD, one of the prominent hallmarks of DACD.
In this study, some limitations still exist. It should be noted that in our study, we only verified the expression of Nptx1, Ptpmt1, Slc25a11, and Cpt1c using PRM. Due to limited funds and time, some validation was not additionally performed. The relationship between these molecular changes and DACD needs more evidence. The specific mechanism by which these four DEPs are involved in the transduction of signaling pathways to regulate DACD deserves further investigation. In addition, further studies and clinical trials are needed to confirm our findings and establish a more definitive molecular mechanism for DACD.
5. Conclusion
Our study employed proteomic methods to screen for DEPs in the hippocampal tissues of DACD rats. Our results confirmed differences in protein expression between DACD and normal hippocampal tissues, providing initial explanations for the molecular functions and actions of DEPs. The changes in the expression of Nptx1, Ptpmt1, Slc25a11, and Cpt1c expression in DACD rats may be the result of abnormal mitochondrial function. We hypothesize that mitochondrial dysfunction may play a significant role in DACD. Overall, these findings not only provide valuable information to better understand the mechanisms of DACD but also might help develop medical countermeasures against the cognitive decline of DACD.
Acknowledgments
We would like to thank the researchers and study participants for their contributions.
Author contributions
YY and TK designed the research study. YY and YW performed the research. YW analyzed the data. YY wrote the manuscript, YW and TK supervised the conception, analysis, design of the work, and manuscript drafting. All authors contributed to editorial changes in the manuscript. All authors read and approved the final manuscript.
Ethics approval and consent to participate
All animal procedures for this study were performed in accordance with the Guide for the Care and Use of Laboratory Animals and approved by the Ethics Committee of Kunming Medical University (Approval No. kmmu20220850).
Supplemental Material
Download MS Excel (59.8 KB)Disclosure statement
No potential conflict of interest was reported by the author(s).
Availability of data and materials
All the data associated with this article can be found in the article and Supplementary material.
Additional information
Funding
References
- Galicia-Garcia U, Benito-Vicente A, Jebari S, et al. Pathophysiology of type 2 diabetes mellitus. Int J Mol Sci. 2020;21(17):6275.
- Cho NH, Shaw JE, Karuranga S, et al. IDF diabetes atlas: global estimates of diabetes prevalence for 2017 and projections for 2045. Diabetes Res Clin Pract. 2018;138:271–281. doi: 10.1016/j.diabres.2018.02.023.
- Tripathi PN, Srivastava P, Sharma P, et al. Biphenyl-3-oxo-1,2,4-triazine linked piperazine derivatives as potential cholinesterase inhibitors with anti-oxidant property to improve the learning and memory. Bioorg Chem. 2019;85:82–96. doi: 10.1016/j.bioorg.2018.12.017.
- American Diabetes A. 12. Older adults: standards of medical care in diabetes-2021. Diabetes Care. 2021;44(Suppl 1):S168–S79.
- Biessels GJ, Nobili F, Teunissen CE, et al. Understanding multifactorial brain changes in type 2 diabetes: a biomarker perspective. Lancet Neurol. 2020;19(8):699–710. doi: 10.1016/S1474-4422(20)30139-3.
- Hayman LA, Fuller GN, Cavazos JE, et al. The hippocampus: normal anatomy and pathology. AJR Am J Roentgenol. 1998;171(4):1139–1146. doi: 10.2214/ajr.171.4.9763010.
- Rocca MA, Barkhof F, De Luca J, et al. The hippocampus in multiple sclerosis. Lancet Neurol. 2018;17(10):918–926. doi: 10.1016/S1474-4422(18)30309-0.
- Tang W, Li Y, He S, et al. Caveolin-1 alleviates diabetes-associated cognitive dysfunction through modulating neuronal Ferroptosis-Mediated mitochondrial homeostasis. Antioxid Redox Signal. 2022;37(13-15):867–886. doi: 10.1089/ars.2021.0233.
- Jia L, Du Y, Chu L, et al. Prevalence, risk factors, and management of dementia and mild cognitive impairment in adults aged 60 years or older in China: a cross-sectional study. Lancet Public Health. 2020;5(12):e661–e71. doi: 10.1016/S2468-2667(20)30185-7.
- Biessels GJ. Sweet memories: 20 years of progress in research on cognitive functioning in diabetes. Eur J Pharmacol. 2013;719(1-3):153–160. doi: 10.1016/j.ejphar.2013.04.055.
- Biessels GJ, Despa F. Cognitive decline and dementia in diabetes mellitus: mechanisms and clinical implications. Nat Rev Endocrinol. 2018;14(10):591–604. doi: 10.1038/s41574-018-0048-7.
- Schmidt R, Launer LJ, Nilsson LG, et al. Magnetic resonance imaging of the brain in diabetes: the cardiovascular determinants of dementia (Cascade) study. Diabetes. 2004;53(3):687–692. doi: 10.2337/diabetes.53.3.687.
- Wang T, Cai X, Li J, et al. Proteomics analysis in myocardium of spontaneously hypertensive rats. Sci Rep. 2023;13(1):276. doi: 10.1038/s41598-023-27590-8.
- Aly KA, Moutaoufik MT, Phanse S, et al. From fuzziness to precision medicine: on the rapidly evolving proteomics with implications in mitochondrial connectivity to rare human disease. iScience. 2021;24(2):102030. doi: 10.1016/j.isci.2020.102030.
- Long FQ, Kou CX, Li K, et al. MiR-223-3p inhibits rTp17-induced inflammasome activation and pyroptosis by targeting NLRP3. J Cell Mol Med. 2020;24(24):14405–14414. doi: 10.1111/jcmm.16061.
- Zhao C, Zheng Z, Zhu S, et al. iTRAQ and PRM-Based comparative proteomic profiling of the hippocampus in rat models of epilepsy. J Integr Neurosci. 2023;22(1):21. doi: 10.31083/j.jin2201021.
- Dubey SK, Rai SN, Singh VK, et al. Evaluation of pleurotus mushroom effects on histopathological changes in organs of diabetic rats. Dis Markers. 2023;2023:1520132–1520138. doi: 10.1155/2023/1520132.
- Luo A, Xie Z, Wang Y, et al. Type 2 diabetes mellitus-associated cognitive dysfunction: advances in potential mechanisms and therapies. Neurosci Biobehav Rev. 2022;137:104642. doi: 10.1016/j.neubiorev.2022.104642.
- Srivastava P, Tripathi PN, Sharma P, et al. Design and development of some phenyl benzoxazole derivatives as a potent acetylcholinesterase inhibitor with antioxidant property to enhance learning and memory. Eur J Med Chem. 2019;163:116–135. doi: 10.1016/j.ejmech.2018.11.049.
- Ozkan A, Aslan MA, Sinen O, et al. Effects of adropin on learning and memory in rats tested in the morris water maze. Hippocampus. 2022;32(4):253–263. doi: 10.1002/hipo.23403.
- Ross PL, Huang YN, Marchese JN, et al. Multiplexed protein quantitation in Saccharomyces cerevisiae using amine-reactive isobaric tagging reagents. Mol Cell Proteomics. 2004;3(12):1154–1169. doi: 10.1074/mcp.M400129-MCP200.
- Gygi SP, Rist B, Gerber SA, et al. Quantitative analysis of complex protein mixtures using isotope-coded affinity tags. Nat Biotechnol. 1999;17(10):994–999. doi: 10.1038/13690.
- Kang UB, Yeom J, Kim H, et al. Quantitative analysis of mTRAQ-labeled proteome using full MS scans. J Proteome Res. 2010;9(7):3750–3758. doi: 10.1021/pr9011014.
- Schulze WX, Usadel B. Quantitation in mass-spectrometry-based proteomics. Annu Rev Plant Biol. 2010;61(1):491–516. doi: 10.1146/annurev-arplant-042809-112132.
- Rai SN, Singh C, Singh A, et al. Mitochondrial dysfunction: a potential therapeutic target to treat alzheimer’s disease. Mol Neurobiol. 2020;57(7):3075–3088. doi: 10.1007/s12035-020-01945-y.
- Omeis IA, Hsu YC, Perin MS. Mouse and human neuronal pentraxin 1 (NPTX1): conservation, genomic structure, and chromosomal localization. Genomics. 1996;36(3):543–545. doi: 10.1006/geno.1996.0503.
- Schaukowitch K, Reese AL, Kim SK, et al. An intrinsic transcriptional program underlying synaptic scaling during activity suppression. Cell Rep. 2017;18(6):1512–1526. doi: 10.1016/j.celrep.2017.01.033.
- Al Rahim M, Thatipamula S, Pasinetti GM, et al. Neuronal pentraxin 1 promotes Hypoxic-Ischemic neuronal injury by impairing mitochondrial biogenesis via interactions with active bax[6A7] and mitochondrial hexokinase II. ASN Neuro. 2021;13:17590914211012888. doi: 10.1177/17590914211012888.
- Al Rahim M, Thatipamula S, Hossain MA. Critical role of neuronal pentraxin 1 in mitochondria-mediated hypoxic-ischemic neuronal injury. Neurobiol Dis. 2013;50:59–68. doi: 10.1016/j.nbd.2012.10.003.
- Hooper AWM, Alamilla JF, Venier RE, et al. Neuronal pentraxin 1 depletion delays neurodegeneration and extends life in sandhoff disease mice. Hum Mol Genet. 2017;26(4):661–673. doi: 10.1093/hmg/ddw422.
- Cummings DM, Benway TA, Ho H, et al. Neuronal and peripheral pentraxins modify glutamate release and may interact in blood-brain barrier failure. Cereb Cortex. 2017;27(6):3437–3448. doi: 10.1093/cercor/bhx046.
- Clayton KB, Podlesniy P, Figueiro-Silva J, et al. NP1 regulates neuronal activity-dependent accumulation of BAX in mitochondria and mitochondrial dynamics. J Neurosci. 2012;32(4):1453–1466. doi: 10.1523/JNEUROSCI.4604-11.2012.
- Abad MA, Enguita M, DeGregorio-Rocasolano N, et al. Neuronal pentraxin 1 contributes to the neuronal damage evoked by amyloid-beta and is overexpressed in dystrophic neurites in alzheimer’s brain. J Neurosci. 2006;26(49):12735–12747. doi: 10.1523/JNEUROSCI.0575-06.2006.
- Zhang J, Guan Z, Murphy AN, et al. Mitochondrial phosphatase PTPMT1 is essential for cardiolipin biosynthesis. Cell Metab. 2011;13(6):690–700. doi: 10.1016/j.cmet.2011.04.007.
- Xu QQ, Xiao FJ, Sun HY, et al. Ptpmt1 induced by HIF-2alpha regulates the proliferation and glucose metabolism in erythroleukemia cells. Biochem Biophys Res Commun. 2016;471(4):459–465. doi: 10.1016/j.bbrc.2016.02.053.
- Zheng H, Yu WM, Shen J, et al. Mitochondrial oxidation of the carbohydrate fuel is required for neural precursor/stem cell function and postnatal cerebellar development. Sci Adv. 2018;4(10):eaat2681. doi: 10.1126/sciadv.aat2681.
- Luongo TS, Eller JM, Lu MJ, et al. SLC25A51 is a mammalian mitochondrial NAD(+) transporter. Nature. 2020;588(7836):174–179. doi: 10.1038/s41586-020-2741-7.
- Baulies A, Montero J, Matías N, et al. The 2-oxoglutarate carrier promotes liver cancer by sustaining mitochondrial GSH despite cholesterol loading. Redox Biol. 2018;14:164–177. doi: 10.1016/j.redox.2017.08.022.
- Robinson AJ, Overy C, Kunji ER. The mechanism of transport by mitochondrial carriers based on analysis of symmetry. Proc Natl Acad Sci U S A. 2008;105(46):17766–17771. doi: 10.1073/pnas.0809580105.
- Datta A, Akatsu H, Heese K, et al. Quantitative clinical proteomic study of autopsied human infarcted brain specimens to elucidate the deregulated pathways in ischemic stroke pathology. J Proteomics. 2013;91:556–568. doi: 10.1016/j.jprot.2013.08.017.
- Mukherjee S, Russell JC, Carr DT, et al. Systems biology approach to late-onset alzheimer’s disease genome-wide association study identifies novel candidate genes validated using brain expression data and Caenorhabditis elegans experiments. Alzheimers Dement. 2017;13(10):1133–1142. doi: 10.1016/j.jalz.2017.01.016.
- Iborra-Lázaro G, Djebari S, Sánchez-Rodríguez I, et al. CPT1C is required for synaptic plasticity and oscillatory activity that supports motor, associative and non-associative learning. J Physiol. 2023;601(16):3533–3556. doi: 10.1113/JP284248.
- Lee J, Wolfgang MJ. Metabolomic profiling reveals a role for CPT1c in neuronal oxidative metabolism. BMC Biochem. 2012;13(1):23. doi: 10.1186/1471-2091-13-23.
- Virmani A, Pinto L, Bauermann O, et al. The carnitine palmitoyl transferase (CPT) system and possible relevance for neuropsychiatric and neurological conditions. Mol Neurobiol. 2015;52(2):826–836. doi: 10.1007/s12035-015-9238-7.
- Ding Y, Zhang H, Liu Z, et al. Carnitine palmitoyltransferase 1 (CPT1) alleviates oxidative stress and apoptosis of hippocampal neuron in response to beta-Amyloid peptide fragment abeta(25-35). Bioengineered. 2021;12(1):5440–5449. doi: 10.1080/21655979.2021.1967032.
- Trushina E, Nguyen TKO, Trushin S. Modulation of mitochondrial function as a therapeutic strategy for neurodegenerative diseases. J Prev Alzheimers Dis. 2023;10(4):675–685.