
 ?Mathematical formulae have been encoded as MathML and are displayed in this HTML version using MathJax in order to improve their display. Uncheck the box to turn MathJax off. This feature requires Javascript. Click on a formula to zoom.
ABSTRACT
The use of holding and inspection fixtures is common across many sectors of manufacturing. The concept of a fixture for holding a component, for the purposes of assembly or inspection, is straightforward. The fixture design and the associated clamping strategy can have a significant impact on the process. This paper presents a methodology for investigating the effects of clamping sequence for a production inspection fixture, on the dimensional variability of an automotive production-representative sheet metal sub-assembly, along with experimental findings and analysis of measurement data. The study utilises both a coordinate measuring machine and laser tracker to capture a range of features and surface points, and compares four different clamping sequences, including the manufacturer’s defined sequence, to evaluate their effect on the dimensional results from a predetermined measurement plan. The results from the study show that there was significant variation in measurements taken from the four different clamping sequences, and these variations can show the same points and/or features being within tolerance for one clamping sequence and out of tolerance for another. This clearly has major implications for product development and subsequent volume manufacture, so needs to be considered and optimised in the measurement planning process.
1. Introduction
Currently, holding fixtures are used to locate, position and secure manufactured components and sub-assemblies during the inspection and assembly processes within a manufacturing system. If a component or system variation cannot reliably be identified during an inspection, errors will propagate into the final assembly. There are digital simulation tools available to aid with robust fixture design and, more specifically, to predict potential component distortion, but as with any form of simulation, a certain amount of physical validation is needed before simulation results can be relied upon, and this is where a gap in current research studies has been identified.
The locator and clamp layout of a fixture are critical factors in its design. They must hold the component securely, locate it with high positional accuracy, and achieve good positional reproducibility in repeated use. A fixture will typically have a set of datum locators, which determine the position and orientation of the part, and clamps, which exert a load perpendicular to the locator surfaces to hold the part in place, for either the purpose of part inspection or to create the final assembly condition (Qin, Zhang, and Wan Citation2006). On this basis, a fixture can be classified into one of two categories:
Machining and assembly (M&A) fixture (Zheng and Chew Citation2010; Wan and Zhang Citation2013; Phoomboplab and Ceglarek Citation2008),
Inspection fixture (Cai-qi, Zhong-qin, and Xin-min Citation2006; Jiang, Zhou, and Li Citation2013)
Whilst the primary purpose of both fixture types is to provide accurate, repeatable and optimal positioning, the work-holding load of the M&A fixture designed to withstand is generally significantly greater in comparison to the inspection fixture and is hence a more substantial structure, but they could be also used for inspection fixture.
There are two fundamentally different approaches to fixturing and clamping for inspection that can be taken (Tuominen Citation2011). One approach is to support the component in a free state (i.e. with no clamping applied), hence, in theory, removing any external influences which could affect the geometry. In reality, large components can often distort under their own weight if not adequately supported, and the alignment of the measurement system will have to be performed from the component itself, which is not ideal if multiple components are being inspected and compared (Turley et al. Citation2014). The second approach is to ‘hold’ the component in the orientation in which it will be assembled on the car and using a location strategy that replicates the assembly process. This requires an accurate fixture and well-thought-out clamping strategy but creates a repeatable inspection environment for the measurement of multiple parts. In practice, there are benefits and limitations to both methodologies, and the organisation’s over-arching inspection strategy will likely dictate which approach should be taken. The more ‘controlled’ approach of holding the component in a dedicated fixture is by far the most common approach taken in automotive manufacturing, and hence the need to understand the effect of the location strategy and clamping sequence is of critical importance to the accuracy and reliability of inspection data generated, particularly using different measurement sensors (Kiraci et al. Citation2017).
The forces imparted to the component at the contact points between it and the clamps, together with the sequence in which those clamps are applied, considerably influence the final distribution of the contact forces in the inspected component (Qin, Zhang, and Wan Citation2006). As a result, for even an optimised and repeatable fixture layout, geometric variation can still be induced by the clamping sequence, as supported by previous studies (Matuszyk, Cardew-Hall, and Rolfe Citation2007; Qin, Zhang, and Wan Citation2006; Raghu and Melkote Citation2004). These documented studies, however, only considered M&A fixtures and were predominantly simulation-based (Table ). For those studies where experimental data were collected, these focused on machining fixtures, and whilst they considered clamping sequences, there were relatively few clamps acting on rigid workpieces (C. Cogun Citation1992; Raghu and Melkote Citation2004). Whilst these publications provide useful background information, the authors have been unable to find any documentation of studies based on inspection fixtures (as opposed to M&A fixtures), or any studies relating to sheet metal components (such as those in automotive body structure assemblies). The National Physical Laboratory (NPL) measurement best practice guide states that clamping can be a source of error (Flack and Hannaford Citation2005) but does not provide details of the potential effect.
Table 1. A brief overview of the existing literature on clamping sequence studies with research gap identification.
Measurement System Analysis (MSA Citation2010) studies help manufacturers and their suppliers to decide whether the measurement system is capable, conditionally capable, or not capable of the respective measurement task (Hocken and Pereira Citation2012). The effect of clamping layout and sequencing should, therefore, be a consideration within future Gauge Repeatability and Reproducibility (GR&R) studies, and the associated guidelines published in this area.
The aim of this study was, therefore, to investigate and show the effect of inspection fixture clamping sequence on the dimensional measurement variability of a non-ideal, compliant automotive sub-assembly and to investigate whether altering the clamping sequence would create quantifiable variation in the inspection results.
The novel aspects of this particular study were
Use of a representative, non-ideal, compliant automotive sheet metal assembly and the manufacturer’s industrial inspection fixture (using two locators and eleven clamps)
Use of two different measurement systems to investigate different aspects of part variation – a large, horizontal arm Coordinate Measuring Machine (CMM) was used to inspect the position of critical features such as holes and slots, and a Laser Tracker (LT) was used to measure the deviation of surface points.
The following sections describe the experimental procedure, the measurement analysis performed, the results of the study and a discussion of the outcomes.
2. Materials and methods
In this study, two measurement systems were used: (a) a laser tracker (LT) system and (b) a horizontal arm CMM with a touch-trigger probe. Horizontal arms are commonly used for the inspection of larger automotive sub-assemblies or other similar-sized and toleranced parts, as they tend to enable good accessibility to all sides of the part (Kiraci et al. Citation2016). The inspection fixtures are typically designed with the consideration that a horizontal arm CMM will be used for measurement in the automotive industry. In this study, a horizontal arm CMM was used to measure the position of critical features such as holes and slots while an LT measured the deviation of surface points.
The subsequent sections describe the following aspects of the study – (A) description of sub-assembly, (B) specification of the inspection fixture, (C) specification of LT, (D) specification of CMM touch probe, (E) measurement procedure using LT (E1) and CMM (E2).
Description of the sub-assembly
The sub-assembly, used in this study, was a rear quarter of an automobile (Figure ). It is one of the largest panels in the vehicle with a number of matching surfaces; hence, can greatly contribute to automotive dimensional integrity and quality. A representative part was randomly selected from the production line. All sub-components were assembled from parts conforming to the Production Part Approval Process (PPAP) (AIAG Citation2006). The expected variability of the measured assembly is, therefore, considered to be within assembly specifications as defined by the Manufacturer. This sub-assembly contains various measurement features including surface points, holes and slots which were measured during the experiments.
Figure 1. (a) A representative non-ideal complaint sheet-metal sub-assembled part used in the study along with four classified zones (b) the location of the clamps, the locator pins (XYZ1 and Z2) and RPS alignment.
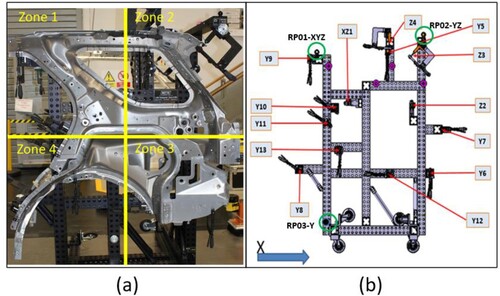
For the analysis of the measurements, the sub-assembly was broadly classified into four zones as shown in Figure a, to simplify analysis and allow a better visual representation of the results. Each zone consisted of at least three surface points and three features. To define the alignment of the sub-assembly, three reference spheres (RP01-XYZ, RP02-YZ and RP03-Y) were measured and aligned using the Reference Point System (RPS), as seen in Figure b. It should be noted that these reference spheres are a design feature of the fixture – they were not added for the purpose of this study.
The datum strategy of the sub-assembly was provided by the OEM and defined in the operation manual and GIS (Gauge Instruction Sheet). This datum scheme followed a typical hole (XZ1) and slot (Z2) configuration and was used as standard in the automotive industry. The fixture used in this study, as shown in Figure , was designed and manufactured to these requirements.
Specification of the inspection fixture
The fixture was manufactured in accordance with the OEM’s holding fixture design documentation, including datum, locator and clamp positions and specifications. There are 2 pin locators, 11 clamps – 2 in ‘Z’ and 9 in ‘Y’, closing against net pads, as shown in Figure b. The fixture was assembled to a general tolerance of ±0.2 mm as per the manufacturing tolerance. The tolerances of the pins were as follows – (a) Size - 0.02 mm/−0.03 mm of nominal, and (b) Positional ±0.1 mm of nominal. The datum faces were ±0.05 mm/1000 Flat and Parallel. Four different clamping sequences were used in this study as follows: (a) clamping sequence specified by the OEM (b) SEQ 1 followed a clockwise clamping sequence starting from Z3 and ending at Y9; (c) SEQ 2 followed an anti-clockwise clamping sequence starting from Z3 and stopping at Y7; (d) SEQ3 used the concept of union jack initialising from Y10 and final closing at Y11. It should be noted that there were numerous potential clamping sequences could have been used to locate this part. In addition, changing the starting clamping location of the sequence could change the effect of a given sequence and the resulting measurements. The objective of the study was not to find the best sequence but to investigate how the above-mentioned four sequences affected the resulting measurement data.
Specification of the LT
A Leica Absolute Tracker AT960- LT providing dynamic six degrees of freedom (6DoF) measurement up to 100 Hz (HEX) was used in this study as shown in Figure b, along with SpatialAnalyzer software (SA 2019.09.10 Version). For measurements, retroreflectors were used and the maximum permissible error (MPE) was specified as 15 μm + 6 μm/m, which means that the overall accuracy of the Laser Tracker (LT) diminishes over distance as per ASME B89.4.19 (Citation2006) and ISO10360-10 (Citation2016). Consequently, it is important to set up the tracker as close as possible to the fixture to minimise further uncertainties and errors. With this system, two different types of Spherically Mounted Retroreflectors (SMR) were used: 1.5’ SMR and 0.5’ SMR. In this study, the 1.5’ SMRs were used for reference system calibration, whereas the 0.5’ SMRs were used for the experimental measurements.
Specification of the CMM
Figure 2. The measurement systems used in this study (a) A horizontal arm CMM, (b) a Laser Tracker.
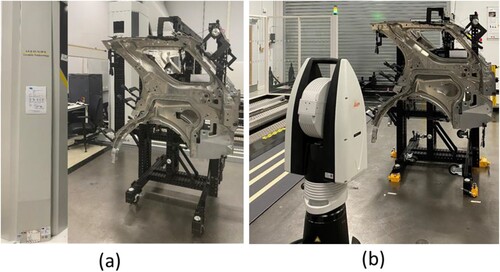
An LK HC90 Horizontal Arm CMM was used in this study, as shown in Figure a. The CMM was equipped with a TP20 5-way kinematic standard force touch trigger probe, in combination with a 140 mm extension and a 2 mm tip diameter. Camio 8.5 measurement software was used. The CMM measuring arm accuracy was verified in accordance with ISO10360-2 (Citation2009) with an expanded measurement uncertainty (k = 2) of 18 µm + 0.87 L/M µm as stated by the manufacturer.
Measurement procedure
In this study, the following sequences of operation were performed to measure the effect of the clamping sequence: (a) loading and locating the sub-assembly to the fixture, (b) clamping using a specified sequence, (c) performing measurements (either with CMM or LT), (d) releasing the clamps, (e) unloading the sub-assembly (taking out of the fixture entirely). This sequence (a) to (e) was repeated 30 times consecutively to create a full set of measurements for a selected clamping sequence. The dataset was then used to calculate the variation of the measurement for a given clamping sequence.
For each clamping sequence, the workpiece was released from the clamps, unloaded from the fixture, reloaded on to fixture and re-clamped prior to each of the 30 measurements. The different clamping sequences were not mixed between measurements, so 30 consecutive measurements for each clamping sequence were taken.
An additional measurement process was performed to calculate the repeatability of the measurement system (for both the CMM and LT). In this case, the part was loaded and the OEM sequence was selected to clamp the part to the fixture. The part was not released and 30 consecutive measurements were performed to produce a set of measurement data that were used to calculate the repeatability of the CMM and LT.
Measurement procedure using LT
There were 10 reference points (nests) on the fixture and they were verified using the 1.5″ SMR tooling with the single-point measurement mode. Subsequently, the LT located the reference points in order to establish a common reference system on the fixture. The alignment method used was the best fit alignment using 10 reference points. This establishes a repeatable coordinate system that can be used for the comparison of one part at multiple stages. The amount of drift was measured at the start of measurement, and repeated intervals throughout the job by re-measuring the set of reference points using a 1.5″ SMR. If the measured drift of any of the reference points was below 3 µm, it was assumed that the instrument had not moved relative to the workpiece being measured, and therefore, was ready to take further measurements.
Sixteen surface measurement points were identified and 0.5″ SMRs bonded to the workpiece for each measurement point. Measurement points were selected that corresponded with component matching surfaces identified from the CAD data and CMM programme supplied by the OEM. These points were then measured using the LT. The measured part geometry was divided into four ‘zones’, as described in Section 2A, and therefore, the points were also categorised into four groups, based on their locations within these four zones. SpatialAnalyser software was used to automate the measurement process of the 16 surface points.
Measurement procedure using CMM
For the CMM measurements, the measurement programme was written based on the automotive manufacturer’s measurement plans, covering the standard measurement expectations of a production environment. The alignment programme was created using the nominated reference spheres on the fixture and a ‘pad and pin verification’ measurement programme was run to confirm the positional checks against the supplier’s measurement data before any part measurements were carried out. Based on the measurement results which met the fixture design specifications as described above, the RPS alignment was used to manually align an initial local coordinate system with the CMM coordinate system, and this was followed by two iterations in the autonomous mode. Eighteen features were measured in accordance with the clamping sequence. Similar to the LT measurements, each virtual zone consisted of at least three features. 18 features (10 holes, 5 slots and 3 planes) were measured using the CMM. As the surface measurement points were already measured using the LT, the additional features were measured using the CMM. This minimised duplication and significantly reduced the cycle time of the experiment.
3. Measurement analysis
As mentioned in the previous section, 16 points were measured using the Laser Tracker system. However, these selected points did not have any nominal or reference position. Therefore, only the repeatability (random error) using standard deviation (SD) was calculated to evaluate the effect of different clamping sequences on LT measurements.
On the other hand, 18 features (10 holes, 5 slots and 3 planes) were measured using the CMM. As these features had reference/nominal positions, both (a) bias (i.e. mean position) and (b) repeatability (random error) using SD were calculated to compare the effect of the clamping sequence on feature measurements.
The measured part geometry was virtually divided into four regions (Figure a), and therefore, the points and features were also categorised into four groups, based on their locations in these four regions where each group consisted of at least three points and three features. Each feature was measured 30 times using each measurement system for a particular clamping sequence. The X, Y and Z axes of the position of each feature were captured and were then used to calculate the aforementioned statistics. Bias for each axis (BX, BY and BZ) was calculated using Equation (1) where the reference value (CR) is considered as the nominal value, and thereafter, the total bias was calculated using Equation (2)
(1)
(1)
(2)
(2) The standard deviation (SD) was calculated for each axis using Equation (3) and subsequently, the total SD was calculated using Equation (4).
(3)
(3)
(4)
(4) In addition, the minimum tolerance (Tmin) (Equation (5)) associated with each feature was calculated using the limit value of Cg as 1.33 considering 8σ process capability.
(5)
(5) K is the percent of tolerance which was considered as 20%. Tmin was used to explore how changing the clamping sequence changed the decision of finding a feature within a tolerance limit of 3 mm (±1.5 mm) which is a typical value used for the automotive assembly process.
One-way ANOVA test was performed for each of the LTP (for LT measurement) or features (CMM measurement) to check whether the mean position of the LTP or feature was significantly changed due to the change in a clamping sequence. The mean position was defined by three axes, and therefore, three one-way ANOVA tests were performed for each LTP or feature.
4. Results
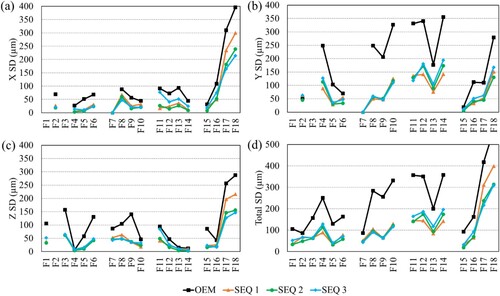
The measurement deviation (random error) between measurements using LT and CMM was 2σ repeatability of 25 and 13 µm, respectively. Figure shows the effect of the clamping sequence on the repeatability of the measurement for 16 points which were measured using the Laser Tracker. The points were categorised into four groups based on their locations in the four regions as follows: (a) Zone 1: PT1 to PT3, (b) Zone 2: PT4 to PT6, (c) Zone 3: PT7 to PT11 and (d) Zone 4: PT12 to PT16 (Figure ). It was observed that X and Y position axes of the points varied considerably in Zone 3 compared to other clamping sequences. The repeatability of PT 15 was larger for the X and Z axes, for all the sequences. However, when comparing the total SD (Figure d), all the points were affected by clamping sequences. The highest variability was observed for the OEM sequence, and the least variable sequence was identified as SEQ 2 for all zones. Different axes (X, Y and Z) were affected differently by a change in clamping sequences. In addition, due to the complex geometrical shape of the measured part, no variation pattern was detected from the measurement results, obtained for different clamping sequences.
Figure 3. Effect of the clamping sequence on measurement repeatability for 16 points measured using a Laser Tracker.
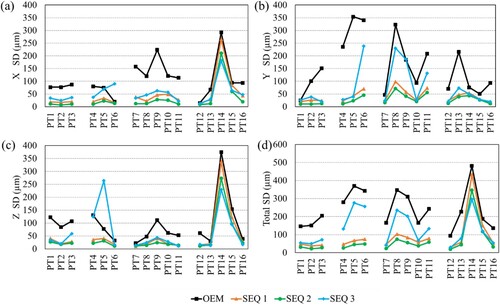
The one-way ANOVA test showed that the mean X, Y and Z axis positions were significantly changed at p < 0.05% level due to the change in clamping sequence, with the exception of the mean x-position of 5 points.
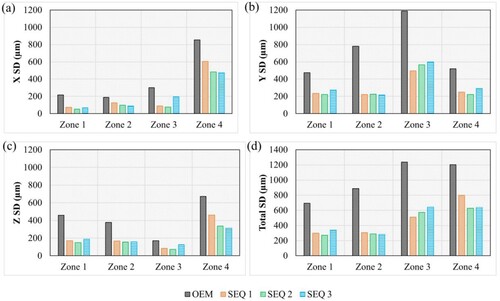
The SD of the points, which were in the same zone, was added up for each position axis to explore the effect of the clamping sequence on the four regions of the measured part (Figure ). It was recognised that Zones 1, 3 and 4 were majorly affected by the OEM clamping sequence for the X and Z axes, whereas all the zones were mostly affected by OEM for the Y axis. On the other hand, Zone 2 was affected mostly by SEQ 3 for the X and Z axes. The SEQ 2 sequence had the least effect for all zones and all axes. For total SD, the OEM sequence is the worst for all regions, whereas SEQ 2 was the best. The data show that the regions responded differently due to the change in the clamping sequence. Also, the variability was different for different position axes.
Figure 4. Effect of the clamping sequence on region-specific measurement repeatability, calculated by adding up SD of the points located within the same region. These are obtained from the Laser Tracker measurement results.
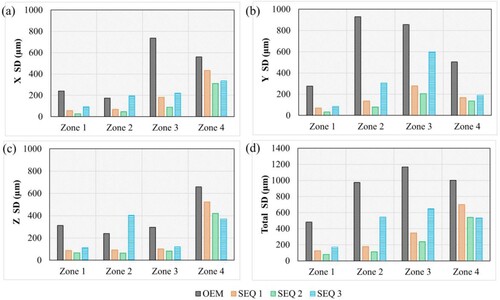
Figure represents the effect of the clamping sequence on the feature measurement using the CMM touch probe. There were a total of 18 features and they were categorised into four groups based on their location on the measured part, as carried out for the Laser Tracker measurement points as follows: (a) Zone 1: F1 to F6, (b) Zone 2: F7 to F10, (c) Zone 3: F11 to F14, and (d) Zone 4: F15 to F18 (Figure ). It was observed that the features in any zone were most affected by the OEM sequence for all axes, which was similar to the Laser Tracker point measurement results. However, SEQ 2 was no longer the best sequence as was observed for the Laser Tracker point measurements. For example, SEQ 1 was better for the Y axis and features in Zone 3, whereas SEQ 3 outperformed others for the Z axis and features in Zone 4. Also, the variation patterns were more random in the feature measurements compared to the point measurements taken with the Laser Tracker.
Figure 5. Effect of the clamping sequence on measurement repeatability for 18 features measured using a CMM touch probe.
When comparing the measurement variation with respect to regions, by adding the SD of the features within the same zone, as performed for the Laser Tracker results, it was observed that the variability in every zone and each axis was largest for the OEM sequence, as shown in Figure . For Zones 1 and 3, SEQ 2 produced less variability for all axes compared to others (except zone 3 of the Y axis). On the other hand, SEQ 3 generated less variability in Zone 4 for Z and Zone 2 for X and Y. Overall, Zones 1, 2, 3 and 4 were seldom affected by SEQ 2, 3, 1 and 2, respectively which were completely random as opposed to Laser Tracker results.
Figure 6. Effect of the clamping sequence on region-specific measurement repeatability, which was calculated by adding up the SD of the feature located within the same region. These are obtained from the CMM touch probe measurement results.
Three one-way ANOVA tests were performed for each feature. It was observed that the mean X, Y and Z axis positions were significantly changed at p < 0.05% level due to the change in clamping sequence except for all features.
The effect of the clamping sequence on measurement bias was explored only for CMM measurement data (Figure ) as the nominal data for LTP was not available. It was observed that the bias for the Y axis was quite high and not acceptable. This might be due to the assembled part being used for measurement. Similar to the SD analysis, the features were classified into four groups based on their locations in the four zones. SEQ 2 produced less bias for all the features in Zones 2, 3 and 4 for the Y axis compared to other sequences. However, OEM and SEQ 1 were better for Zone 3 features. Overall, the bias was affected less by SEQ 3 for Zone 2–4 whereas the OEM sequence was better for Zone 1.
Figure 7. Effect of the clamping sequence on measurement bias for the 18 features measured using a CMM touch probe.
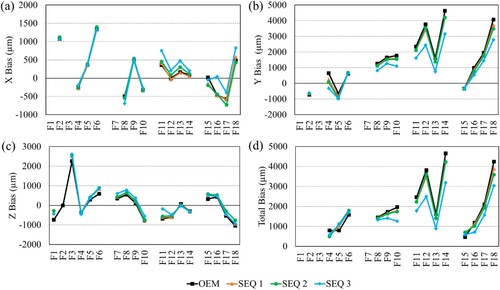
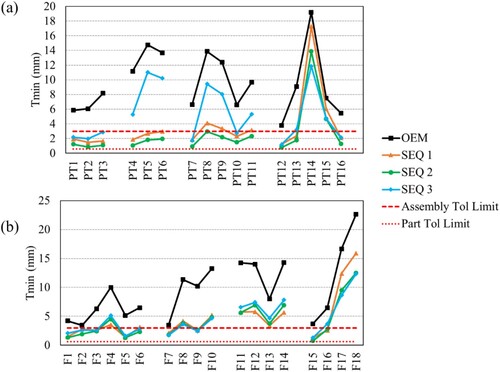
Figure compares the minimum tolerances (Tmin) that the measurement system would be capable of measuring for a certain clamping sequence when the limit of Cg value was considered as 1.33, i.e. to maintain 8SD (±4SD) measurement repeatability. The upper and lower red dotted lines, which are parallel to the horizontal axis of each subplot of Figure , depict the tolerance limit of 3 mm (±1.5 mm) and 0.6 (±0.3 mm) respectively, which are typical values used in automotive manufacturing for assembly and part geometries, respectively (Kiraci et al. Citation2020). It was observed that 13 points out of 16 were within the assembly tolerance limit whereas it was drastically reduced to 10, 6 and 0 points when the clamping sequence was changed to SEQ 1, 3 and OEM, respectively. This means that the final decision from the measurement will strongly depend on the clamping sequence. For example, if the SEQ2 sequence was used, it was informed that only 13 points were within tolerance. This decision would drastically change if SEQ 3 was used instead, and it was then concluded that only 6 points were within tolerance. In the case of features, 8, 6, 8 and 0 features were within assembly tolerance out of 18 features for SEQ 3, 1, 2 and OEM, respectively. There was no point or feature which was below part tolerance for any of the sequences.
Figure 8. Effect of clamping sequences on the minimum tolerances (Tmin) that the measurements system would be capable of measuring when the limit of Cgk value was considered as 1.33 i.e. to maintain 8 SD (±4 SD) measurement repeatability.
5. Discussion
In this paper, an experimental study was performed to examine the effect of clamping sequence for an inspection fixture, on the dimensional variability of an automotive bodyshell sub-assembly, using two separate measurement systems. The novel and particularly interesting aspects of this study were as follows:
A detailed experimental study of the clamping sequence was undertaken on a non-deal compliant automotive sub-assembly and inspection fixture, as opposed to performing a simulation-based study using an idealised or nominal part.
The experimental study was performed using two accurate and calibrated measurement systems; a laser tracker (LT) and a horizontal arm Coordinate Measuring Machine (CMM) with a touch probe, to explore the effect of the clamping sequence and demonstrate their effect on different features of the sub-assembly.
The CMM measurements were performed to capture the position of critical features such as holes and slots, whilst the LT was used to measure the deviation of surface points. The use of different measurement systems allowed a more comprehensive investigation of the effect of clamping sequence on dimensional variably of different points and features. This also enabled the elimination of measurement system-related bias.
From the measurement results, the following observations were made:
The clamping sequence had a significant effect on the dimensional variability of the part, and the variability existed in each of the X, Y and Z axes. The size of variation for Zone 4 in this specific sub-assembly was higher in the X and Z axes regardless of the measurement systems used. Similarly, variation for Zone 3 in the Y axis was greater for all different clamping sequences trialled. Both surface points and features (holes and slots) varied in measurement by up to 500 µm across the different clamping sequences.
The was no obvious correlation between the changes to the clamping sequence, and the variation measured for the hole and slot features of the part. Surface points did, however, show some correlation with the clamping sequence, as might be expected, given the proximity of the clamping points to the edges of the part, around which many of the surface points were defined. As a result of the clamping sequence, the measurement/inspection decisions can be changed when considering typical tolerance values in automotive manufacturing.
The variation in part geometry observed between different clamping sequences was significant – up to approx. 500 µm, or 1/3 of the tolerance assigned to the majority of features. It is clear, therefore, that the clamping sequence could quite easily be a key factor in the measurement of a point of a feature being considered within specification, or outside of specification, for automotive bodyshell applications.
The vehicle manufacturer in question specified a generic tolerance of ±1.5 mm for this particular sub-assembly. By considering the variation observed in this study, the effect of the clamping sequence, in terms of the dimensional variation of the sub-assembly, is significant in terms of its influence on the measurement results, and in particular for the bias of the Y axis (primary datum) which had a higher variation than the other two axes. Furthermore, the effect of the clamping sequence on the position of the holes and slots (measured by CMM) was greater than that of the surface points (measured by LT). Inspection results will alter based on the clamping sequence but there is no clear pattern identified. This is due to the complex interaction amongst various clamping forces, and their propagation through the intricate geometrical structure of the measured sub-assembly. This study has, however, highlighted that the measurement results for the same workpiece could be considerably different depending on the clamping sequence selected, and as a direct result, certain features might be reported as within tolerance for one clamping sequence, but outside of tolerance for a different clamping sequence. Consequently, these errors induced by the clamping process, and their repeatability (or lack-of) could significantly contribute to the build-up of dimensional errors in the overall assembly, and poor fit and function of the final part. This paper highlights the potential influence of the inspection fixture clamping sequence on measurement results for a typical automotive sheet metal sub-assembly. It demonstrated that even though the clamps exert less force than would be the case for an assembly fixture, they can still influence the measurement results to a level that cannot be considered insignificant. In the sample workpiece used in this study, dimensional variation due to clamping effects was up to 1/3 of the allowable tolerance.
The experimental results showed features being ‘within tolerance’ for certain clamping sequences and ‘out of tolerance’ for others. ISO 14253-Citation1 (Citation2017) requires that uncertainty must be taken into account when proving conformance. There are two options here: (i) using the stringent acceptance zone to reduce the risk. The expanded measurement uncertainty (U) must be deducted from the specifications as defined by the stringent acceptance zone (ii) having a relaxed acceptance zone where all measurements falling within the uncertainty added to the tolerance limits are considered acceptable. Obviously, the first option increases the manufacturer’s costs as the rejection rate increases, whereas option (ii) decreases the cost to the manufacturer but increases the risk to the customer. The study clearly demonstrated that the measurement uncertainty increased due to the variation in the clamping sequences. Therefore, it would further decrease the ‘stringent conformance zone’ that would increase the manufacturers’ cost, whereas the ‘relaxed conformance zone’ would be expanded to increase the risk to the customer. It is, therefore, critical to investigate further the effect of the clamping sequence, and how to mitigate the problems by introducing guidelines for MSA or developing simulation tools for optimal layout selection.
This paper also provides a quantitative understanding of the complex nature of fixture clamping sequence, part deformation and dimensional variability. Although simulation techniques are playing a growing role in exploiting the potential of a new fixture design, the effect of clamping and its sequence of application can, to a certain extent, be predicted and improved through the use of simulation tools, but not eliminated. With all simulation work requiring some form of verification, it is important that physical studies, such as this one, are carried out to both improve engineers’ understanding of the potentially significant effect of fixture clamps and the sequence in which they are applied, and to further improve the accuracy and validity of the simulation of these effects.
Finally, it is important that the outcomes of such studies are communicated back into not only the manufacturing functions of a business (where mitigating actions can be taken), but also into the design, so that lessons can be learnt and improvements made for future products and their associated fixturing solutions. It is now evident from this study that not only the clamping layout but also the clamping sequence can influence measurement decisions. Therefore, the clamping sequence should be an integral part of any measurement capability assessment. However, additional research should be carried out to develop guidelines for including clamping sequences in an MSA study.
The aim of this study was to identify and compare variations in deviation resulting from different clamping sequences. At the time of writing, simulation studies in the literature that investigate the effect of inspection clamping sequence on real-world parts are limited. The study showed the importance of clamping sequence on measurement decision-making, but there are still a number of unanswered questions that the authors will seek to investigate in future research. The combination of physical experiments and simulations to improve understanding of the entire process, and subsequently predict an optimal fixturing strategy for any given part or assembly, is a long-term goal. Clearly carrying out a study such as this one, for every automotive sub-assembly is not viable, so reliable, verified simulation tools will be critical for OEMs to optimise their inspection processes.
The consideration of different, multi-material parts and assemblies will also be important in a growing number of applications (automotive and beyond). As composites and different grades of steel and aluminium are used and combined, the effects of clamp position and sequence will vary, and will again need further physical verification.
6. Conclusion
In this paper, the effects of the clamping sequence on measurement results were investigated for a particular clamping layout of a given industrial inspection fixture and a representative manufactured automotive sub-assembly. It was identified that the clamping sequence had a significant effect on the measurement results and these variations were not consistent across the sub-assembly due to the complex interaction of clamping forces with intricate part geometry. Consequently, the decision of whether a feature or surface point is within tolerance is affected by the clamping sequence, and designing the clamping layout alone is, therefore, not sufficient in terms of the level of design detail needed. A clamping layout with part-specific clamping sequence should be designed, even for inspection fixtures.
Acknowledgements
This work was carried out as part of the CiMAT Team, WMG, University of Warwick, with partial funding from the High Value Manufacturing Catapult. The authors would also like to acknowledge the support of Barry Dimelow, Tim Gears and David Brown at Hexagon UK for providing the laser tracker and technical support.
Data availability statement
Data is available on request from the authors.
Disclosure statement
No potential conflict of interest was reported by the author(s).
Additional information
Funding
Notes on contributors

Ercihan Kiraci
Ercihan Kiraci is Lead Engineer of the Centre for Imaging, Metrology and Additive Technologies (CIMAT) Lab as one of eight Catapult High Value Manufacturing Centre in the UK, at WMG. He is an experienced engineer and researcher with expertise in smart metrology, product evaluation technologies and continuous improvement. He is responsible for the metrology work stream and running the lab, including all metrology activities and projects, from automotive BIW measurement applications (including in-line inspection) to electric batteries. He works closely with the industry to develop processes to evaluate new measurement technologies for manufacturing and quality through all parts of the supply chain and works closely with multiple stakeholders. He specialises on how to collect data and use it in new product development and maturation.

Arnab Palit
Arnab Palit is Assistant Professor (Research Focused) in the Centre for Imaging, Metrology and Additive Technologies (CiMAT), at Warwick Manufacturing Group (WMG), The University of Warwick. Dr. Palit received his Ph.D. in Engineering from the University of Warwick, UK in 2016 and obtained his M.Tech degree in Industrial Engineering and Management from IIT Kharagpur, India in 2011 where he was awarded the ‘Institute Silver Medal’. He is actively involved in various industrial and academic projects in multi-disciplinary fields encompassing manufacturing, biomedical and healthcare engineering sectors that include metrology experiment, X-Ray CT image analysis, physics and data-driven computational modelling.

Alex Attridge
Alex Attridge is Project Manager in the Centre for Imaging, Metrology and Additive Technologies, at WMG, The University of Warwick. He was awarded an M.Eng (Hons) degree in 1999 and a Ph.D. in 2003, both from the University of Birmingham, in the subject of Mechanical Engineering. He currently manages a number of metrology projects within WMG, and the Metrology Group’s input into larger projects with a range of funding bodies and industry partners from the automotive and aerospace sectors. He represents WMG on the High Value Manufacturing Catapult (HVMC) Assurance Community of Practice and is actively involved in undergraduate and postgraduate teaching.

Mark A. Williams
Mark A. Williams is head of the Centre for Imaging, Metrology & Additive Technologies (CiMAT), at Warwick Manufacturing Group (WMG), The University of Warwick. Prof Williams received his Ph.D. in Engineering and Master’s in Manufacturing both from the University of Manchester. His research interests include Metrology, 3D visualisation and image processing working within the Automotive, Aerospace, Law Enforcement, Healthcare and Defence sectors.
References
- AIAG. 2006. Production Part Approval Process – Reference Manual, 4th ed.
- ASME. 2006. ASME B89. 4.19 Performance Evaluation of Laser-Based Spherical Coordinate Measurement Systems. New York, NY: ASME.
- Automotive Industry Action Group (AIAG). 2010. Measurement System Analysis – Reference Manual, 4th ed.
- Bazrov, B. M., and A. I. Sorokin. 1982. “The Effect of Clamping Sequence on Workpiece Mounting Accuracy.” Soviet Engineering Research 2 (10): 92–95.
- Cai-qi, H., L. Zhong-qin, and L. Xin-min. 2006. “Concept Design of Checking Fixture for Auto-Body Parts Based on Neural Networks.” The International Journal of Advanced Manufacturing Technology 30 (5): 574–577.
- Cogun, C. 1992. “The Importance of the Application Sequence of Clamping Forces on Workpiece Accuracy.”
- Flack, D., and J. Hannaford. 2005. Good Practice Guide No. 80: Fundamental Good Practice in Dimensional Metrology. Teddington: NPL.
- Hocken, R. J., and P. H. Pereira. 2012. Coordinate Measuring Machines and Systems (Vol. 2). Boca Raton: CRC press.
- ISO 14253-1:2017. 2017. Geometrical Product Specifications (GPS) – Inspection by Measurement of Workpieces and Measuring Equipment – Part 1: Decision Rules for Proving Conformance or non-Conformance with Specifications. Switzerland, Geneva: International Organization for Standardization (ISO).
- ISO. 2009. ISO10360-2. Geometrical Product Specifications (GPS) – Acceptance and Reverification Tests for CMM- Part2: CMMs Used for Measuring Size. Geneva, Switzerland: International Organization for Standardization. Geneva: ISO.
- ISO. 2016. ISO 10360-10 Geometrical Product Specifications (GPS) — Acceptance and Reverification Tests for Coordinate Measuring Systems (CMS) — Part 10: Laser Trackers for Measuring Point-to-Point Distances. Geneva: ISO.
- Jiang, K., X. Zhou, and M. Li. 2013. “Computer-aided Checking Fixture Design System for Automobile Parts.” International Journal of Production Research 51 (20): 6045–6069.
- Kiraci, E., P. Franciosa, G. A. Turley, A. Olifent, A. Attridge, and M. A. Williams. 2017. “Moving Towards in-Line Metrology: Evaluation of a Laser Radar System for in-Line Dimensional Inspection for Automotive Assembly Systems.” The International Journal of Advanced Manufacturing Technology 91 (1): 69–78.
- Kiraci, E., A. Palit, M. Donnelly, A. Attridge, and M. A. Williams. 2020. “Comparison of in-Line and off-Line Measurement Systems Using a Calibrated Industry Representative Artefact for Automotive Dimensional Inspection.” Measurement 163: 108027.
- Kiraci, E., G. A. Turley, A. Attridge, A. Olifent, and M. A. Williams. 2016. “Evaluating the Capability of Laser Scanning to Measure an Automotive Artefact: A Comparison Study of Touch Trigger Probe and Laser-Scanning.” International Journal of Productivity and Quality Management 18 (4): 440–455.
- Matuszyk, T. I., M. Cardew-Hall, and B. F. Rolfe. 2007. “The Effect of Clamping Sequence on Dimensional Variability in Sheet Metal Assembly.” Virtual and Physical Prototyping 2 (3): 161–171.
- Phoomboplab, T., and D. Ceglarek. 2008. “Process Yield Improvement Through Optimum Design of Fixture Layouts in 3D Multistation Assembly Systems.” Journal of Manufacturing Science and Engineering 130 (6).
- Qin, G., W. Zhang, and M. Wan. 2006. “Analysis and Optimal Design of Fixture Clamping Sequence.”
- Raghu, A., and S. N. Melkote. 2004. “Analysis of the Effects of Fixture Clamping Sequence on Part Location Errors.” International Journal of Machine Tools and Manufacture 44 (4): 373–382.
- Tuominen, V. 2011. “Virtual Clamping in Automotive Production Line Measurement.” Expert Systems with Applications 38 (12): 15065–15074.
- Turley, G. A., E. Kiraci, A. Olifent, A. Attridge, M. K. Tiwari, and M. A. Williams. 2014. “Evaluation of a Multi-Sensor Horizontal Dual arm Coordinate Measuring Machine for Automotive Dimensional Inspection.” The International Journal of Advanced Manufacturing Technology 72 (9): 1665–1675.
- Wan, X. J., and Y. Zhang. 2013. “A Novel Approach to Fixture Layout Optimization on Maximizing Dynamic Machinability.” International Journal of Machine Tools and Manufacture 70: 32–44.
- Zheng, Y., and C. M. Chew. 2010. “A Geometric Approach to Automated Fixture Layout Design.” Computer-Aided Design 42 (3): 202–212.