
 ?Mathematical formulae have been encoded as MathML and are displayed in this HTML version using MathJax in order to improve their display. Uncheck the box to turn MathJax off. This feature requires Javascript. Click on a formula to zoom.
ABSTRACT
Nowadays, adhesive joints are largely applied in the automotive, aircraft and aerospace, civil, and naval industries. Although several applications involve flat (plane) adherends, curved joints play an important role in many engineering applications like civil and aircraft construction. This work aims to investigate three structural adhesives, ranging from brittle to ductile, applied in curved joggle-lap joints between carbon fibre reinforced polymer adherends and subjected to internal pressure, to validate a robust design procedure and provide project guidelines for this complex structural, geometrical, and loading system, which constitute the main novelty of the proposed work. A numerical cohesive zone model parametric analysis was undertaken by varying the overlap length, thickness of the adherends, and adherends’ curvature, including the evaluation of peel and shear stresses in the adhesive, failure mode comparison, maximum load, and energy dissipated after failure. Validation of the cohesive zone model technique was initially performed using flat single-lap joint under tensile loads. A significant effect of the overlap length and thickness of the adherends on the maximum load was found, while the adherends’ curvature effect on the maximum load was negligible. Ductile adhesives, although less strong, generally performed better in terms of maximum load and dissipated energy.
1. Introduction
Adhesive bonding is a versatile joining technique and shows interesting characteristics and performance with respect to mechanical fastening or even welding. Nowadays, adhesive joints are largely applied in the automotive,[Citation1] aircraft and aerospace,[Citation2] civil,[Citation3] and naval industries.[Citation4] Like in other joining processes, adhesive bonding must be tailored according to the load solicitations, being the adhesive joints stronger in shear. The single-lap joint (SLJ) is one of the most employed because of its simplicity.[Citation5] In this type of joint, the adhesive is mainly loaded in shear.[Citation6] However, its geometry induces peel (σy) stresses, reducing the joint’s performance.[Citation7] Other joint configurations exist, whose application depends on the load solicitation. The most common joint configurations were described by Adams and Wake.[Citation8] Even though tensile loadings are most common, other loadings for specific applications are addressed in the literature, such as compression.[Citation9]
Although several applications involve flat (plane) adherends, curved joints play an important role in many engineering applications like civil and aircraft construction.[Citation10] In civil construction, curved joints can be used for reinforcement of existing masonry and concrete structures and to fabricate new structures of composite materials like fibreglass.[Citation11] In aircraft construction, curved joints are employed in the manufacture of fuselages,[Citation12] often between carbon fibre reinforced polymer (CFRP) structures. Furthermore, repairs on pipelines sometimes are performed using adhesive joints, providing advantages over traditional methods.[Citation13] Studies are available on the behaviour of these repairs on pressurised pipelines, indicating that the repairs can sustain higher pressures than the pipeline’s working pressure.[Citation13,Citation14]
The joggle-lap joint (JLJ) is a variation of the SLJ that, although geometrically similar, has the advantage of aligned adherends, reducing transverse deflection. JLJ is used in aircraft construction because it allows joining curved segments of the fuselage whilst keeping the aerodynamic profile,[Citation15] and joining the fuselage to the half-wing.[Citation16] Taib et al.[Citation15] performed a study comparing JLJ to SLJ, both in their flat configurations, aiming to study the addition of a spew fillet on the JLJ performance. The study was numerical and performed using commercial software. The models were load-driven, enabling to identify differences in the bond line stresses, but not to calculate the maximum load (Pm). The stress distributions in JLJ were more uniform than those of SLJ, but the peak stresses at the knee side were higher, whilst those at the other free end were slightly lower, consequently reducing Pm. Nevertheless, leaving the spew between the knee and the upper adherend significantly reduced the peak stresses in the bond line, increasing them in the opposite free-end.[Citation15] On the other hand, the geometry of JLJ caused σy stresses to increase at the knee vicinities, increasing the chances of adherend damage when composite adherends are involved.[Citation16] Therefore, stress analyses should be performed while designing these joints. Although joints with curved adherends show similarities to standard or flat joints, there are a few challenges due to the curvature, being mostly related to fibre orientations on composite adherends, and loading conditions.
Stresses in adhesive joints, mainly in the bond line, can be obtained using analytical[Citation17] or numerical (finite element method or FEM) approaches,[Citation18] whilst joint strength can be determined through continuum mechanics, fracture mechanics, or cohesive zone model (CZM) techniques. Amongst these techniques, the latter delivers strength predictions closer to experimental values provided that the cohesive law is properly selected. The triangular cohesive law is one of the most used since it requires fewer parameters than the other cohesive laws and it gives accurate results for brittle and slightly ductile adhesives.[Citation19] However, it underpredicts Pm in joints with highly ductile adhesives. The different cohesive laws were described in detail by Alfano.[Citation20] A detailed description of the method was reported by Campilho et al.[Citation21] Although CZM is widely adopted in the literature, inconveniently, the failure path should be predefined beforehand, which in some cases is not adequate. Moreover, the required parameters for the cohesive laws must be determined from experimental tests. A comprehensive description of the process to characterise an adhesive is provided by Faneco et al.[Citation22] The double cantilever beam (DCB) for mode-I and the end-notched flexure test (ENF) for mode-II are frequently used for fracture characterization. More recently, Monsef et al.[Citation23] studied mode-II experimental tests in adhesive joints. The ENF and the end-loaded split (ELS) were the chosen tests. In addition, an analytical methodology to obtain the cohesive law was developed, which took advantage of the experimental load-displacement (P-δ) data. The results indicated that the cohesive law is independent of the test type, and the results also agreed with the J-integral method, validating the proposed methodology.
The damage models used for CZM are also applicable to the eXtended Finite Element Method (XFEM).[Citation24] The XFEM is based on the concept of partition-of-unity proposed by Belytschko.[Citation24] Although the initial proposal was not suitable for long cracks nor 3D cases, the method was expanded to such cases by Moes et al.[Citation25] Unlike the CZM, the XFEM allows to simulate crack initiation and growth without the need of a predefined path, resulting on successful implementations for crack propagation, as described by Rabczuk et al.[Citation26] Whereas the theory and formulations needed to implement the XFEM are out of the scope of this work, they are available in references.[Citation25,Citation26] Furthermore, the ability to predict crack propagation through the XFEM has been employed to study adhesive joints. For example, Machado et al.[Citation27] recently validated the XFEM as a means to estimate Pm in SLJ. Three adhesive systems were used, and several damage initiation criteria and damage propagation laws were tested. The results indicated that this numerical methodology provides acceptable strength predictions. However, the accuracy of the prediction depends on the damage initiation criterion, being those stress-based the ones yielding the best results. Later, Sadeghi et al.[Citation24] performed a parametric study to SLJ using FEM-based techniques like FEM, CZM, and XFEM, among others. The results were compared against experimental data acquired during the study. Although all the cases tested presented differences with the experimental values, the cases corresponding to XFEM for an adhesive layer thickness of 0.2 mm were similar. The XFEM estimated joint strength close to experimental values, indicating its suitability to study adhesive joints.
Analytical and numerical modelling of curved bonded joints is scarce in the literature. Liu et al.[Citation28] addressed the effect of adherends’ curvature (R), size, and free ends of composite curved lap joints such as those employed in aircraft fuselages under circumferential tension. The proposed methodology used numerical models of flat joints (validated with experimental data) as a base for further analyses of other joint configurations, as curved joints, thus reducing the number of required experiments and allowing to analyse larger and more complex components. The numerical models were based on CZM. Three R values were used: 1000 mm, 2000 mm, and 3000 mm. The analysed R are relevant to study aircraft cylindrical surfaces, but no relevant effect on Pm was observed. Conversely, the joints’ compliance increased with R. Later, the performance of three adhesive systems (Araldite® AV138, Araldite® 2015, and Sikaforce® 7888) on curved SLJ with CFRP adherends was evaluated by Correia et al.[Citation29] for identical loading conditions. overlap length (LO), thickness of the adherends (tP), and R effects were evaluated by CZM. The numerical technique was validated with experimental data from flat SLJ. The results indicate that the energy dissipated after failure (U) is proportional to LO when using ductile adhesives, whilst tP has the opposite effect. Conversely, in the presence of a brittle adhesive, these parameters had no significant effect on Pm. On the other hand, R higher than 2000 mm had no effect on Pm as the geometry further approaches a flat SLJ. Curved bonded joints, either in the overlap or joggle configurations, find application in aircraft fuselages, where they are subjected to internal pressure while in service. The internal pressure inside a commercial aircraft (airliner) is around 0.75 bar whilst the pressure at cruising altitude (40,000 ft) is 0.2 bar. Thus, the associated differential is 0.55 bar.[Citation30] Although internal pressure is important, it is not considered in the available studies. It is thus considered that the described numerical methodologies, mainly CZM, are good candidates to evaluate the added effect that the internal pressure has on material and geometrical variables related to curved joints.
This work aims to investigate three structural adhesives, ranging from brittle to ductile, applied in curved JLJ between CFRP adherends and subjected to internal pressure, to validate a robust design procedure and provide project guidelines for this complex structural, geometrical, and loading system, which constitute the main novelty of the proposed work. A numerical CZM parametric analysis was undertaken by varying LO, tP, and R, including the evaluation of σy and shear (τxy) stresses in the adhesive, failure mode comparison, Pm, and U. Validation of the CZM technique was initially performed using flat SLJ under tensile loads.
2. Experimental work
The curved joints to analyse in this work are subjected to mixed-mode loading, making it possible to experimentally validate the numerical technique using a slightly simpler joint geometry also loaded in mixed-mode, in this case the SLJ. The latter joint possesses similar geometry and loading conditions to the curved joints, but it is simpler to manufacture and test. In addition, this joint configuration is more readily available in the literature, and so more data exist for comparison.
2.1. Joint materials
In this work, curved joints with CFRP adherends bonded with three different adhesives are analysed. Consequently, the tested SLJ were made with the same type of materials. The adherends are composed by CFRP sheets (SEAL Texipreg HS 160 RM, Legnano, Italy) having a unit thickness of 0.15 mm, to produce a [0]16 configuration. The adherends’ manufacture consisted of stacking the composite sheets using the desired configuration and pressing the laminate in a press with 130°C and 4 bar for 1 hour, following the procedure described by Campilho et al.[Citation31] The elastic properties of the composite were also reported by Campilho et al.,[Citation31] while tP for the SLJs was 2.4 mm.
The Araldite® AV138 and Araldite® 2015 adhesives were used in the CZM validation process, while the adhesive Sikaforce® 7752 was added for comparison in the numerical curved joint analysis. All relevant properties were experimentally acquired in former works,[Citation21,Citation22,Citation32] and are listed in . A comprehensive description of the testing processes for all the parameters, including the respective standards, is provided by Faneco et al.[Citation22]
Table 1. Mechanical and fracture properties of the adhesives Araldite® AV138,[Citation32] Araldite® 2015,[Citation21] and Sikaforce® 7752.[Citation22].
2.2. CZM validation and curved geometries
reports the flat SLJ (a) and curved JLJ (b) used for CZM validation and numerical evaluation, respectively. The base dimensions of both joints are as follows: joint length LT = 200 mm, joint width B = 15 mm (flat SLJ) or B = 25 mm (curved JLJ), adhesive thickness tA = 0.2 mm, tP = 2.4 mm, and LO such that 10≤ LO≤80 mm with 10 mm increments. The numerical analysis to the curved joints involved the same LO range, tP = 1.2, 2.4 and 3.6 mm, and R = 1000, 2000 and 3000 mm. The R parametric analysis aims to check the influence of the joint curvature (arising from different structure geometries to bond) on the joint response. While the CZM approach was validated with flat SLJ subjected to a tensile load, the curved JLJ were subjected to an internal pressure of 1 MPa.
Figure 1. Geometries of the flat SLJ for the CZM validation process (a) and curved JLJ for the CZM parametric analysis (b).
2.3. Specimen fabrication and tests
The adherends for the flat SLJ used in the CZM validation process were cut to size to allow LT = 200 mm (). Therefore, the adherend length is specific for each LO. The adherends were cut into strips with B = 15 mm. Subsequently, the areas where the adhesive was to be applied were sanded, and then the whole adherend was thoroughly cleaned and degreased with acetone. The adherends were aligned on a flat surface, and calibrated shims were used to ensure a uniform tA of 0.2 mm. The adhesive then was applied and the adherends bonded together. The joint was aligned using slight pressure. Then, the alignment was kept using spring clamps during the whole curing process. The joints were cured for a week at room temperature. After this procedure, the excess of adhesive was mechanically removed from the joint by milling with mounted points.
Five specimens were manufactured per joint configuration, thus leading to 80 fabricated and tested specimens and 16 different configurations, due to using two adhesives (Araldite® AV138 and Araldite® 2015) and eight LO (between 10 and 80 mm). The SLJ were tested to failure using a Universal Testing Machine (UTM) Shimadzu AG-X 100 equipped with a load cell of 100 kN. The testing speed was 1 mm/min. P and δ were recorded during the tests, providing the P-δ curves for all the specimens. Pm was considered as the maximum load sustained by each joint. Finally, the Pm per configuration was calculated as the average of the corresponding samples.
3. Numerical work
3.1. Pre-processing
The flat SLJ for CZM validation and the curved JLJ for the CZM parametric analysis were developed using the same numerical principles in Abaqus® using two-dimensional (2D) models and plane-strain assumptions for all joint components. In the first case, the models were used to assess the failure mode and Pm, while in the second case these aimed to obtain the stress distributions in the adhesive layer (during elastic loading), followed by the failure modes, Pm, and U.
For the stress distributions required for the CZM parametric analysis, quadrilateral elements (CPE4) were considered in the adherends and adhesive layer, while σy and τxy stresses were evaluated at the middle of tA. For all the other SLJ and JLJ analyses, the CPE4 elements were only equated for the adherends, while for the adhesive layer, a single row of CZM elements (COH2D4) with tA = 0.2 mm was inserted between the adherends. Triangular, i.e., bilinear traction-separation laws were considered for the CZM elements. Moreover, thin (0.02 mm) CZM layers with CFRP interlaminar properties were placed in the adherends, between the two plies closest to the adhesive, to make possible this type of failure in the numerical modelling, following experimental occurrence in some joint configurations.
The mesh refinement was also different between models: stresses were evaluated with a highly refined mesh in the adhesive layer and neighbouring regions, to assure a high accuracy, while all other analyses were run with a coarser mesh, due to the insensitivity of this technique to peak stresses, if the models assure a minimum refinement.[Citation33] In the first scenario, the adhesive was modelled with ten solid elements through-thickness (element side dimensions of 0.02 mm), compared to the use of one element for the other analyses (thus, side dimensions of 0.2 mm). Element size grading was also applied to provide a higher refinement at the overlap edges (along the adhesive’s length), and close to the adhesive layer (in the transverse direction). In the unbonded regions, the element size was bigger to save computational resources.
To correctly describe the internal pressure event and respective restraints in a circular component, firstly a polar coordinate system was created, as shown in . Then, both joint ends were constrained in the tangential direction whilst left free in the radial direction; thus, allowing the expansion of the joint due to the internal pressure (). Subsequently, a pressure of 1 MPa was assigned, capable of causing failure in all models. This pressure was applied perpendicularly to all internal faces of the joint, including the butt portion of the inside adherend (). In all cases, the models were solved considering geometrical non-linearities, i.e., large deformations solution, which is necessary to consider the expansion of the joint due to the internal pressure, otherwise, the result would be underpredicted. Further description of geometrical non-linearities is provided by de Sousa Neto et al.[Citation34]
Figure 2. Boundary conditions and loads applied to the joints, with details at the model supports (a) and overlap (b).
3.2. CZM formulation
Although cohesive formulations can represent pure or mixed modes, the latter is typically required for most adhesive joint applications. Between the several available cohesive laws, the triangular law provides a good representation of the actual behaviour of adhesives in bonded joints.[Citation35] This law requires fewer parameters than other cohesive laws, reducing the complexity of their experimental estimation, and consequently simplifying the CZM implementation in the computational software.
Under pure mode, the triangular cohesive law relates the cohesive stresses in traction (tn) or shear (ts) with the relative displacements (δn or δs, respectively). The first segment corresponds to the elastic loading. Then, a second line connecting that point to the corresponding failure displacement (δnf or δsf for traction or shear, respectively) represents the material degradation until fracture. The area beneath the whole curve corresponds to the tensile fracture toughness (GIC) or shear fracture toughness (GIIC). The elastic loading is defined by the stiffness matrix KCOH established between the current stresses and strains in tension and shear (subscripts n and s, respectively) as
εn and εs are the tensile and shear strain, respectively. For thin adhesive layers it can be stated that Knn = E, Kss = G, Kns = 0 (E is the Young’s modulus and G is the shear modulus). Under mixed mode, both mode I (tension) and mode II (shear) contribute to material degradation until fracture. Finally, damage initiation is defined by a quadratic criterion combining the proportions of tn and ts with the respective cohesive strengths (tn0 and ts0) within an elliptic envelope, noting that compression does not contribute to damage initiation. Damage propagation is assessed by a linear power-law expression relating the tensile fracture energy (GI) and shear fracture energy (GII) with the respective limit values. This formulation is described with more detail in the literature.[Citation36] Whilst the adhesives’ CZM properties were taken from , considering E and G as the initial stiffness of the CZM laws, the CFRP interlaminar CZM properties were previously determined[Citation37] for the same material. In this case, the initial stiffness in both loading modes was assumed as 103 GPa, using the penalty function method to avoid affecting the structural response of the specimens. summarizes the CZM data used in the numerical models.
Table 2. CFRP interlaminar and adhesive layer CZM properties.
4. Results
4.1. CZM validation
To enable the purely CZM analysis to the JLJ under internal pressure, initial CZM validation is carried out considering flat SLJ under tensile loads, bonded with the adhesives Araldite® AV138 and Araldite® 2015, representing examples of brittle and ductile adhesives, respectively.
4.1.1. Failure mode comparison
The first step in validating the CZM technique for the intended purpose consists of failure mode comparison between the simulations and experiments. The failure modes were identical and as follows:
Adhesive Araldite® AV138 – experimental cohesive failure of the adhesive for LO = 10 and 20 mm, and interlaminar failure in the entire overlap for 30≤ LO≤80 mm, in some cases with small cohesive failure spots. The change in failure mode is linked to increasing gradients of both σy and τxy stresses taking place for bigger LO. shows an example of cohesive failure in the adhesive layer for LO = 10 mm and of interlaminar failure for LO = 40 mm (emphasizing a cohesive failure spot of the adhesive at the leftmost overlap edge). In the simulations, it was possible to replicate this change in failure mode. shows the obtained numerical interlaminar failure for the conditions of ;
Figure 3. Experimental cohesive failure in the adhesive layer for the adhesive Araldite® AV138 and LO = 10 mm (a), experimental interlaminar failure in the CFRP for the adhesive Araldite® AV138 and LO = 40 mm (b) and respective CZM prediction (c), experimental cohesive failure in the adhesive layer for the adhesive Araldite® 2015 and LO = 20 mm (d) and respective CZM prediction (e).
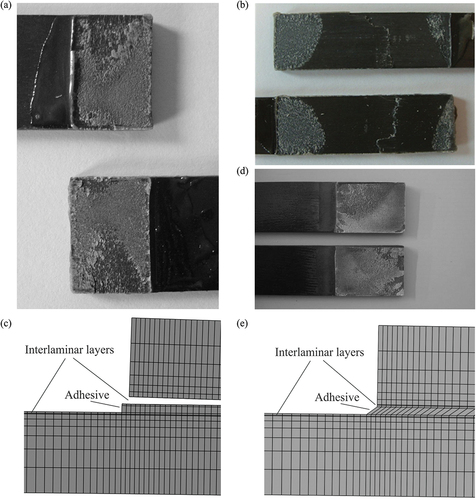
Adhesive Araldite® 2015 – experimental cohesive failure of the adhesive for all LO, with a visible layer of adhesive layer in both failed adherends and absence of composite damage. relates to LO = 20 mm. The CZM results confirmed the cohesive failure mode for all LO ( shows the CZM failure for the same LO = 20 mm condition).
4.1.2. Maximum load comparison
CZM validation also involves evaluation of the CZM capacity to predict Pm. Initially, the numerical and experimental P-δ curves were compared. shows a sample comparison for the joints bonded with the adhesive Araldite® 2015 and LO = 10 mm. The degree of correspondence of Pm between the experimental curves and numerical prediction is representative of all tested conditions. The initial stiffness of the joints shows a good match, although the experimental curves tend to lose stiffness near to Pm. After careful analysis to the failed specimens, namely at the grips region, it was found that the loss of stiffness was caused by minor slip in the testing grips, due to the high values of P attained in the tests. Due to the reduced hardness of the composite adherends, which is governed by the matrix, slipping marks could be seen in the adherends, induced by the serrated surface of the grips. A similar effect was reported by Kang et al.[Citation38] In the present work, it was found that the numerical Pm values are close to the experimental average. compares the experimental/numerical Pm data obtained from the P-δ curves for the two evaluated adhesives and all LO, including the standard deviation associated to the test data.
Figure 4. Experimental/numerical P-δ curve comparison: example for the joints bonded with the adhesive Araldite® 2015 and LO = 10 mm.
Figure 5. Experimental/numerical Pm vs. LO evolution for the joints bonded with the adhesive Araldite® AV138 (a) and 2015 (b), including the standard deviation of the experimental data.
Pm has a monotonic evolution with LO for both adhesives, although higher for the adhesive Araldite® 2015. The obtained absolute Pm increments were 13.1 and 16.6 kN for the adhesives Araldite® AV138 and Araldite® 2015, respectively. The adhesive Araldite® 2015 provided the worst result for LO = 10 mm (Pm = 2.5 kN), while the adhesive Araldite® AV138 was higher by 18.3%. For an intermediate LO (e.g., 40 mm), the adhesive Araldite® AV138 turns into the lowest performing adhesive (Pm = 8.8 kN), while the adhesive Araldite® 2015 exceeds this Pm by 5.9%. This difference increases by considering the highest LO (80 mm), since the adhesive Araldite® AV138 gives Pm = 16.0 kN, while the adhesive Araldite® 2015 Pm is higher by 19.3%. The increasing offset with LO is justified by the ductility of the adhesive Araldite® 2015, which promotes adhesive plasticization at the sites of stress concentrations instead of sudden failure, and thus Pm becomes higher because the average shear stress (τavg) at the time of failure is also higher.
The experimental and numerical data comparison for the adhesive Araldite® AV138 () showed marginal deviations, particularly for the smaller LO. The highest difference was −9.1% (LO = 80 mm). The highest offset for the adhesive Araldite® 2015 () was −7.0%, obtained for the joint with LO = 70 mm. Thus, the main objective of this CZM validation process, consisting of assessing the technique’s capacity for predictive effects, was accomplished.
4.2. Numerical curved joint analysis
After the CZM validation concerning flat SLJ presented in section 4.1, a numerical study is performed to evaluate the effects of different geometrical parameters, such as LO, tP and R, on curved JLJ.
4.2.1. Elastic stresses
The relevant stress components (σy and τxy) are both normalized by τavg along the adhesive layer, for the respective LO. The analysis graphically focuses on one of the three adhesives, since the stress distributions’ generic shape is identical between selected adhesives for the different parameters (LO, tP and R), peaking at the overlap edges. However, differences arise in the absolute values of peak stresses at the overlap ends due to the different stiffness, as shown in .[Citation39] For this section, only the adhesive Araldite® 2015 is considered, due to having an intermediate behaviour. reports σy (a) and τxy (b) stresses for the adhesive Araldite® 2015 considering fixed R = 2000 m and varying LO (10 and 80 mm) and tP (1.2 and 3.6 mm).
Figure 6. σy/τavg (a) and τxy/τavg (b) stresses for the 2015 considering fixed R = 1000 m and varying LO (10 and 80 mm) and tP (1.2 and 3.6 mm).
Normalized σy stresses () are mostly negligible along x/LO, except at the overlap edges. However, stresses peak at x/LO = 0 (joggle curvature) and a smaller peak exists at x/LO = 1. The locations of σy peak stresses were expected for lap joints.[Citation15] For LO = 10 mm, σy/τavg peak stresses attained 19.1 and 10.3 for tP = 1.2 mm and 3.6 mm, respectively (46% reduction between tP). For LO = 80 mm, peak stresses attain 147.0 for tP = 1.2 mm and 70.1 for tP = 3.6 mm (52% reduction). Higher LO significantly increase σy stresses (up to ≈670% for tP = 1.2 mm), which agrees with flat SLJ behaviour.[Citation40] Higher tP also benefit σy stresses (reductions of ≈50%). Between adhesives, the adhesive Araldite® AV138 significantly increased peak σy/τavg stresses, up to 49.1% for the joint with LO = 80 mm and tP = 1.2 mm, while the adhesive Sikaforce® 7752 managed to highly reduce peak stresses up to 47.6% for the same joint configuration.
Similarly to σy stresses, τxy stresses () have a smaller magnitude at the overlap centre, while peaking at the overlap edges.[Citation40] However, the variation is smoother and, especially for smaller LO, the inner overlap is also loaded with less significant τxy stresses. The peak τxy/τavg stress asymmetry was also found. For LO = 10 mm, peak τxy/τavg stresses are 12.7 and 7.2, respectively, for tP = 1.2 mm and 3.6 mm, which corresponds to a drop of 43.3%. For LO = 80 mm, these values increase to 92.5 for tP = 1.2 mm and 48.9 for tP = 3.6 mm (drop of 47.1%). Increasing LO leads to major peak stresses (maximum difference to LO = 10 mm of ≈630% for tP = 1.2 mm), and increasing tP reduces peak τxy/τavg stresses up to almost 50%. Peak stresses increased up to 96.5% for the adhesive Araldite® AV138 (LO = 80 mm and tP = 3.6 mm), and diminished up to 59.9% for the adhesive Sikaforce® 7752 (same geometry).
The R influence on σy and τxy stresses between joint conditions is compared in bar plots since the differences between curves are small and restricted to the peak values, which prevents the clear visualization in stress plots. Thus, the adhesive Araldite® 2015, LO = 10 mm and tP = 1.2 mm absolute peak data at x/LO = 0 and x/LO = 1 is summarized in for σy/τavg and (b) for τxy/τavg stresses. Note that the vertical axes are truncated to focus on the region of interest.
Figure 7. Peak σy/τavg (a) and τxy/τavg (b) stresses for the 2015 at x/LO = 0 and x/LO = 1 considering fixed LO = 10 mm, tP = 1.2 mm and R = 1000 m, and varying R (1000, 2000 and 3000 mm).
shows that peak σy/τavg stresses at x/LO = 0 (tensile) are always higher than those at x/LO = 1 (which are compressive), with a relative difference of ≈20 times. Increasing R leads to a reduction of peak σy/τavg stresses at x/LO = 0 from 19.1 (R = 1000 mm) to 18.6 (R = 3000 mm), or 2.3% reduction. Higher R approach the flat SLJ condition without curve asymmetry. The same effect is found at x/LO = 1. Consistency was found with the adhesives Araldite® AV138 and Sikaforce® 7752, equally with small peak σy/τavg stress reductions by increasing R. The adhesive Araldite® AV138 increased peak σy/τavg up to ≈49% and the adhesive Sikaforce® 7752 reduced up to 47%.
Peak τxy/τavg stresses () also reveal to be critical at x/LO = 0, with a ≈ 20-fold relation to the peak values x/LO = 1. At x/LO = 0, a reduction is found from 12.7 (R = 1000 mm) to 12.5 (R = 3000 mm), i.e., reduction of 1.4%. However, a marked increase takes place at x/LO = 1: from 0.67 (R = 1000 mm) to 0.75 (R = 3000 mm), i.e., difference of 11.9%. Nonetheless, the absolute peak values are not significant compared to x/LO = 0. Between adhesives, peak τxy/τavg stresses increased up to ≈87% (adhesive Araldite® AV138) and reduced up to 57% (adhesive Sikaforce® 7752).
4.2.2. Failure modes
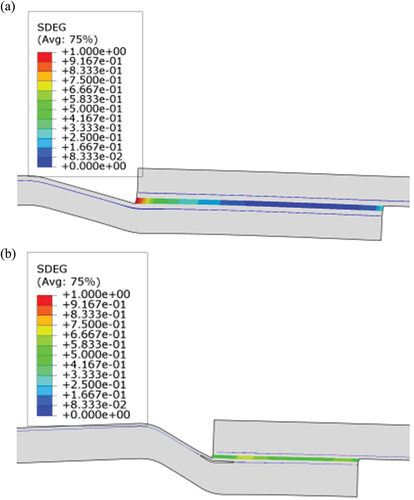
The numerical failure modes were analysed using the stiffness degradation (SDEG) variable associated to the cohesive elements representative of the adhesive layer and interlaminar fracture plane within the composite. This variable measures the stiffness loss of the cohesive elements, and it varies between 0 and 1, with the first representing an undamaged cohesive element, and the last representing a failed cohesive element. During the numerical analysis, two types of failure were registered, i.e., cohesive failure of the adhesive layer () and interlaminar failure of the composite close to the adhesive layer ().
Figure 8. Numerical predictions of cohesive failure in the adhesive layer of a joint bonded with the adhesive Araldite® 2015, R = 1000 mm, LO = 10 mm and tp = 1.2 mm (a) and interlaminar failure in the CFRP of a joint bonded with the adhesive Araldite® 2015, R = 1000 mm, LO = 10 mm and tp = 2.4 mm (b).
The failure mode analysis involves four input variables: tP, R, LO, and adhesive, all with three levels except LO containing eight. The discussion also includes the approximate length of the process zone at the overlap edges of the adhesive layer at the beginning of overlap edge crack propagation, taken from the models using the CZM elements satisfying 0< SDEG<1. The following conclusions were taken:
Upon analysing all the models, it was found that R has no effect on the failure mode, considering the two possibilities of failure: cohesive in the adhesive layer and interlaminar. All failures were cohesive in the adhesive layer;
tP has some degree of influence on the failure mode. In brittle to moderately ductile adhesives (Araldite® AV138 and Araldite® 2015), for each tP the failure mode kept unchanged throughout the entire LO spectrum. For the adhesive Araldite® AV138, all joints with tP = 1.2 mm and 2.4 mm presented cohesive failure in the adhesive layer, whilst those with tP = 3.6 mm showed interlaminar failure. Due to the brittleness of this adhesive, the process zone length was approximately 0.2 mm for all models, i.e., close to tA, for both cohesive and interlaminar failures (in which the adhesive also showed damage before interlaminar crack propagation). For the adhesive Araldite® 2015, all joints with tP = 1.2 mm failed cohesively in the adhesive layer, while all joints with tP = 2.4 mm and 3.6 mm showed interlaminar failure. In the joints with tP = 1.2 mm, the process zone length reduced from a maximum of 4.5 mm (LO = 10 mm) to a minimum of 1.5 mm (LO = 80 mm), thus showing that the increase of peak stresses with LO tends to further concentrate damage at the overlap edges. Nonetheless, the process zone is significantly bigger than tA for all LO, since this adhesive is moderately ductile. In the joints with higher tP, showing interlaminar failure, adhesive damage between 0.2 and 0.4 mm was also found;
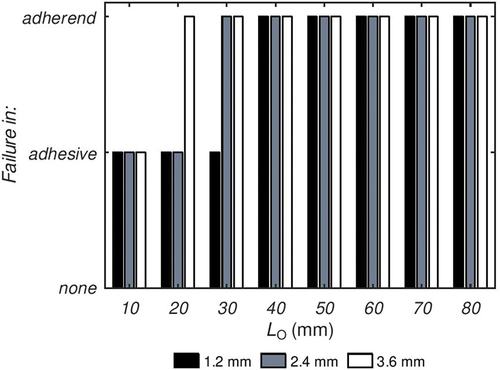
An interaction between LO and tP was found for the joints bonded with the adhesive Sikaforce® 7752, as shown in the failure plot of . Although the shorter LO present a failure in the adhesive layer whilst the longer LO show interlaminar failure, the amount of LO cases showing the former reduces as tP increases. In consequence, for tP = 3.6 mm, only the joint with the shortest LO shows cohesive failure in the adhesive layer. In the cohesive failures of the adhesive, typically damage extended through the entire LO, which is related to the high ductility of the adhesive. In the interlaminar failures, before composite failure the adhesive layer showed damage in a length between 2.5 and 5.5 mm.
Figure 9. Failure plot of the joints bonded with the adhesive Sikaforce® 7752 per tP and LO (dimensions in mm).
4.2.3. Maximum load
represents Pm as a function of LO for all adhesives considering tP = 1.2 mm (a), 2.4 mm (b) and 3.6 mm (c), and a fixed R = 1000 mm. The analysis of the presented data shows that Pm increases with LO, although it tends to stabilize once a certain value is reached. This result agrees with common knowledge regarding flat SLJ, and is mostly related to the increase of shear-resistant area of the adhesive, although peak stresses tend to increase as well with LO.[Citation40] The smaller Pm variation for tP = 2.4 and 3.6 mm ( relates to the predominantly interlaminar failure for higher tP, leading to joint failure before the full adhesive strength can be developed, since peak stresses reduced, as reported in section 4.2.1. On the other hand, for the adhesives Araldite® 2015 and Sikaforce® 7752, tP = 1.2 mm mostly leads to cohesive failures and improved Pm compared to higher tP, since these adhesives can better absorb peak stresses due to their ductility. Between adhesives, the analysis is divided into tP = 1.2 mm, and tP = 2.4 and 3.6 mm, due to the similar results.
Figure 10. Pm vs. LO comparison between the three adhesives for tP = 1.2 mm (a), 2.4 mm (b), and 3.6 mm (c), considering fixed R = 1000 mm.
For tP = 1.2 mm, the Pm improvements between LO = 10 and 80 mm correspond to 219.1%, 170.6% and 295.6% for the adhesives Araldite® AV138, Araldite® 2015 and Sikaforce® 7752, respectively. Thus, despite the increase of peak stresses depicted in section 4.2.1 for higher LO, the increase of bonding area superimposes to this effect and enables a higher absolute performance. The best results were found for the adhesive Araldite® 2015, followed by the adhesive Sikaforce® 7752, while the adhesive Araldite® AV138 results in the lowest Pm for most LO. The failure modes were cohesive, although for the adhesive Araldite® 2015 and LO≥50 mm interlaminar damage was also found, which limited Pm. In this particular adhesive, minor reductions in Pm were found for higher LO, due to the observed effect of increasing peak σy and τxy stresses acting on the interlaminar layers, for which this adhesive revealed to be particularly sensitive to due to the interlaminar layer/adhesive vicinity. The same happened for the adhesive Sikaforce® 7752 for LO≥40 mm, although always with a minor Pm improvement. Thus, for the adhesive Araldite® 2015 and tP = 1.2 mm, the peak Pm at LO = 40 mm is related to the modification of the failure mode. Since most failures are cohesive, the adhesive characteristics has the most effect on Pm: the adhesive Araldite® 2015 combines acceptable strength with moderate ductility, thus giving the best results. The adhesive Araldite® AV138 is strong but brittle, being highly affected by the peak stresses described in section 4.2.1. The highest Pm was thus found for the adhesive Araldite® 2015 and LO = 40 mm, and for this LO the difference between adhesives is highest. For these conditions, the other adhesives showed a Pm percentile difference of 22.3% (adhesive Sikaforce® 7752) and 49.7% (adhesive Araldite® AV138). However, these differences clearly diminish for smaller and higher LO, reaching a minimum for LO = 10 and 80 mm.
For tP = 2.4 mm and 3.6 mm, the Pm tendencies with LO and absolute magnitudes are similar. The Pm improvements with LO using the adhesives Araldite® AV138 and Araldite® 2015 are reduced and identical, and the relative differences between limit LO are only ≈35%. This similarity happens for two reasons. The first is related to the failure mode and explains the behaviour of the adhesive Araldite® 2015. Since the mode of failure in these joints is exclusively interlaminar, the full capabilities of this adhesive are not taken advantage of. The second reason relates to the inherent properties of the adhesive. Since the adhesive Araldite® AV138 is brittle, as soon as the elastic limit is reached, the adhesive fails. The adhesive Sikaforce® 7752 is less strong and, thus, due to the cohesive failure, for the smallest LO it falls short of the other two adhesives (by ≈39%). However, despite the change to interlaminar failure for LO = 30 mm (tP = 2.4 mm) or LO = 20 mm (tP = 3.6 mm), it manages to attain higher Pm for 30≤ LO≤80 mm (relative difference of ≈16%). This difference is related to the higher compliance of this adhesive, leading to a larger extent of interlaminar damage than for the other two adhesives. Between limit LO, the relative improvement for this adhesive was nearly 210% for both tP addressed. Thus, in the event of interlaminar failures, a compliant adhesive is recommended.
presents the Pm vs. LO curves for the adhesive Araldite® 2015 and tP = 1.2 mm as a function of R. Apart from the aforementioned behaviour related to interlaminar damage for LO≥50 mm, added to the cohesive failure, the R effect is negligible for this adhesive. Between limit LO, the percentile Pm improvement was between ≈160 and 170%. This ratio increased for the other two adhesives, whose failure mode was always the same for all LO (≈210-225% for the adhesive Araldite® AV138 and 280–295% for the adhesive Sikaforce® 7752, disregarding R). Thus, it can be concluded that this geometric variable does not provide noticeable differences for the tested design values, despite small differences in the peak stresses (section 4.2.1).
Figure 11. Pm vs. LO comparison for different R, considering fixed adhesive (2015) and tP = 1.2 mm.
4.2.4. Dissipated energy
presents U as a function of LO the three adhesives studied, with a fixed R = 1000 mm and tP = 1.2 mm (a), 2.4 mm (b) and 3.6 mm (c). The magnitude of U depends on both Pm and failure displacement, since it is measured by the absorbed energy up to failure, thus being calculated by the area beneath the P-δ curve. Measurement of U was accomplished by the P-δ data, considering the division of the area beneath the curves into bars, defined by the product of P with difference of consecutive δ points, and respective summation to estimate U. Since all P-δ curves were built with at least 100 data points up to Pm, it is considered that this technique provides accurate U estimations. Similarly to the Pm analysis, U has a marked tendency to increase with LO, but it tends to stabilize at a certain value. This behaviour suggests that increasing LO has a decreasing influence on the gain of U, and the interlaminar failures failure or partial damage found for higher LO and some adhesives also affected U. The shape of the U vs. LO curve of the adhesive Araldite® 2015 for tP = 1.2 mm, similarly to the Pm vs. LO curve, is explained by interlaminar damage for LO≥50 mm. The detailed analysis is divided into tP = 1.2 mm, and combined discussion of tP = 2.4 and 3.6 mm, whose results are very similar.
Figure 12. U vs. LO comparison between the three adhesives for tP = 1.2 mm (a), 2.4 mm (b), and 3.6 mm (c), considering fixed R = 1000 mm.
For tP = 1.2 mm, there are considerable differences with LO. The adhesive Araldite® AV138 steadily increases U between limit LO, with a respective difference of 659.7%. The joints bonded with the adhesive Araldite® 2015 peak for LO = 40 mm. The U reductions for bigger LO are related to the onset of interlaminar damage accompanying the cohesive failure responsible for joint fracture, which limits the failure displacement of the joints. The U improvements between LO = 10 and 40 mm, and between limit LO, were 533.4% and 389.7%, respectively. The adhesive Sikaforce® 7752 failed cohesively in the adhesive layer up to LO = 30 mm, while bigger LO led to interlaminar failure. Thus, U was kept approximately constant for LO≥40 mm. The U relative variation between LO = 10 and 40 mm was ≈792.3%, and it was kept nearly equal up to the biggest LO. Compared to the adhesive with the best overall performance (adhesive Araldite® 2015), the other adhesives presented an offset of ≈60% for LO = 10 mm, 74.6% (adhesive Araldite® AV138) and 42.1% (adhesive Sikaforce® 7752) for LO = 40 mm, corresponding to the peak U, and finally ≈25% for LO = 80 mm.
For tP = 2.4 and 3.6 mm, the U behaviour is essentially similar as a function of LO and between adhesives. The adhesives Araldite® AV138 and Araldite® 2015 show a similar and better behaviour for LO = 10 mm (≈110% higher than the adhesive Sikaforce® 7752), which is related to the higher Pm (). However, due to the ductility of the adhesive Sikaforce® 7752, Pm quickly surpasses the other two adhesives, which then reflects on U. For LO = 20 mm, the three adhesives have a comparable performance, while for LO≥30 mm the adhesive Sikaforce® 7752 clearly behaves better and surpasses the adhesives Araldite® AV138 and Araldite® 2015. Considering LO = 30 mm, the adhesive Sikaforce® 7752 improves U of the other two adhesives by ≈54%, and this difference does not significantly vary up to LO = 80 mm. Thus, for higher tP, a compliant although less strong adhesive is recommended for high energy absorption.
shows U vs. LO for the adhesive Araldite® 2015 and different R. Typically, U increases with LO up to 40 mm and then slightly reduces, due to the harmful effect of interlaminar damage, and it increases with R. The U variation with R variation is marginally related to Pm (), which is little affected by R. Actually, it is mostly affected by the failure displacement of the joints, showing a marked increase with the adhesive’s ductility. Between R, the best U results are always found with R = 3000 mm. The relative improvements for LO = 10 mm are 199.9% (R = 1000 mm) and 52.3% (R = 2000 mm), for LO = 40 mm are 164.9% (R = 1000 mm) and 40.8% (R = 2000 mm), and for LO = 80 mm are 174.2% (R = 1000 mm) and 49.6% (R = 1000 mm). Thus, in relative terms, no significant differences were found. For the other adhesives, the same quantitative differences exist between different R. However, the adhesive Araldite® AV138 shows a steady increase of U with LO for all R, while the adhesive Sikaforce® 7752 shows a stabilization for LO≥40 mm.
Figure 13. U vs. LO comparison for different R, considering fixed adhesive (2015) and tP = 1.2 mm.
4.2.5. Discussion
The specific set of joint configurations/loading type analysed in this work finds no match in the literature, namely regarding the combination of composite material, including possibility of interlaminar failures, joggle geometry, and parametric study on the geometry and adhesive type, modelled by CZM. Nonetheless, few works can be found on the topic of curved bonded joints, in which few results can be compared. In the work of Taib et al,[Citation15] a FEM stress analysis was conducted on bonded joints between glass composites. The curved JLJ was one of the evaluated types of joint under tensile pulling, and the same stress asymmetry between the two overlap edges, with corresponding higher magnitude near the joggle. Additionally, the R effect was also tested, and it was found to have a negligible effect on Pm. Liu et al.[Citation28] addressed curved SLJ and JLJ CFRP joints under tensile loads, using the CZM technique to simulate cohesive failure of the adhesive. R showed a negligible effect on Pm, especially for R > 2000 mm, which agrees with the findings of the present work. The JLJ geometry led to smaller σy peak stresses and lower strain energy release rate at the joggle region. The more recent work of Correia et al.[Citation29] evaluated, by CZM, the tensile behaviour of curved overlap joints in CFRP structures, considering the adhesives Araldite® AV138 and Araldite® 2015 studied in this work, and also a high-strength and elongation polyurethane. Failure possibilities included cohesive failure of the adhesive layer and interlaminar failure close to the adhesive. The stress distributions were found to be asymmetric, with higher stresses at the adhesive edge corresponding to the end of the inner adherend. A strong LO dependency was found, especially for ductile adhesives, in agreement with the findings of this work. Moreover, tP reduced Pm and R improved strength, but for R > 2000 mm the different was not relevant. Thus, despite the different loading type, some qualitative tendencies obtained by varying the geometry and adhesive are consistent to the inner pressure loading case studied in this work.
5. Conclusions
This work presented a numerical parametric study of curved JLJ in CFRP structures and subjected to internal pressure. Adhesives with distinct ductility were evaluated and their performance assessed under different geometric configurations, including variation of LO, tP and R. A CZM validation process with experiments was initially undertaken for flat SLJ and varying LO. The failure mode depended on both adhesive and LO. Additionally, Pm was highly dependent on LO. The triangular CZM approach revealed accurate for brittle and not too ductile adhesives. The parametric study was divided into four features, leading to geometrical and material guidelines for the design of curved joints:
Elastic stresses – Major peak σy and τxy stresses were found, mostly at x/LO = 0 (at the joggle curvature). Both σy and τxy stresses are negligible in magnitude at the inner overlap. The adhesives’ stiffness had a major effect on peak stresses, since stiffer adhesives such as the adhesive Araldite® AV138 led to higher peak values. In all cases, peak stresses highly increased with LO (linearly), moderately diminished with tP, and little diminished with R;
Failure modes – Joint failures were either cohesive in the adhesive layer or interlaminar, depending on the selected adhesive, LO and tP. For the adhesives Araldite® AV138 and Araldite® 2015, the LO effect was negligible, and failures were divided by tP: small tP led to cohesive failures and high tP to interlaminar failures. For the adhesive Sikaforce® 7752, a joint LO/tP effect was found: higher tP increase the preponderance of joints with interlaminar failure, but small LO had topical cohesive failures in the adhesive;
Joint strength – LO showed a significant effect on Pm, especially for small tP. For tP = 1.2 mm, the adhesive Araldite® 2015 provided the highest Pm for all LO. However, Pm stabilized for LO≥50 mm due to concurrent interlaminar damage. Higher tP reduced Pm due to the appearance of interlaminar failures. For these conditions, the adhesive Sikaforce® 7752 is mostly recommended due to its ability to spread stresses. The R effect is minimal for the range of tested geometries;
Dissipated energy – The U output has large similarities with Pm, since it results from a combined effect of Pm and failure displacement. Thus, the general comments on the joint strength are applicable, although for high tP, the U difference between the adhesive Sikaforce® 7752 and the less performing adhesives is larger on account of the higher failure displacements, added to the higher observed Pm.
Disclosure statement
No potential conflict of interest was reported by the author(s).
Additional information
Funding
References
- Quini, J. G.; Marinucci, G. Polyurethane Structural Adhesives Applied in Automotive Composite Joints. Mater. Res. 2012, 15(3), 434–439. DOI: 10.1590/s1516-14392012005000042.
- Romano, M. G.; Guida, M.; Marulo, F.; Giugliano Auricchio, M.; Russo, S. Characterization of Adhesives Bonding in Aircraft Structures. Materials. 2020, 13(21), 4816. DOI: 10.3390/ma13214816.
- Machalická, K. V.; Vokáč, M.; Pokorný, P.; Pavlíková, M. Effect of Various Artificial Ageing Procedures on Adhesive Joints for Civil Engineering Applications. Int. J. Adhes. Adhes. 2020, 97(5), 102476. DOI: 10.1016/j.ijadhadh.2019.102476.
- Petrie, E. M. Adhesives in the Marine Industry. Metal Finishing. 2013, 1116, 47–49. DOI:10.1016/s0026-0576(13)70288-5.
- Zheng, G.; Wang, H.; Han, X.; Li, W. Mechanical Behavior of AL/CFRP single-lap Joint Subjected to Combined Thermal and Constant Loading. J. Adhes. 2021, 97(4), 361–379. DOI: 10.1080/00218464.2019.1667237.
- Martínez, M. A.; López de Armentia, S.; Abenojar, J. Influence of Sample Dimensions on Single Lap Joints: Effect of Interactions between Parameters. J. Adhes. 2021, 97(14), 1358–1369. DOI: 10.1080/00218464.2020.1771313.
- Mardani, H.; Stein, N.; Rosendahl, P. L.; Becker, W. An Efficient Stress and Deformation Model for Arbitrary elastic-perfectly Plastic Adhesive Lap Joints. Int. J. Adhes. Adhes. 2020, 103, 102679. DOI: 10.1016/j.ijadhadh.2020.102679.
- Adams, R. D.; Wake, W. D. Structural Adhesive Joints in Engineering; Elsevier Applied Science Publishers LTD: Essex, England, 1984.
- Kadioglu, F. Effects of Compressive Applied Load on the Adhesive Single Lap Joint with Different Parameters. J. Adhes. 2022, 98(4), 390–411. DOI: 10.1080/00218464.2020.1834390.
- Behera, R. K.; Parida, S. K.; Das, R. R. Effect of pre-embedded Adhesion Failures and Surface Ply Delaminations on the Structural Integrity of Adhesively Bonded Single Lap Joints Made with Curved Laminated FRP Composite Panels. Int. J. Adhes. Adhes. 2021, 108, 102887. DOI: 10.1016/j.ijadhadh.2021.102887.
- Ascione, F.; Mancusi, G. Curve Adhesive Joints. Compos. Struct. 2012, 94(8), 2657–2664. DOI: 10.1016/j.compstruct.2012.03.024.
- Kim, H.; Kedward, K. Stress Analysis of in-plane, shear-loaded, Adhesively Bonded Composite Joints and Assemblies; Office of Aviation Research: Washington, USA, 04January 2001, 36.
- Çitil, Ş.; Ayaz, Y.; Temiz, Ş.; Aydın, M. D. Mechanical Behaviour of Adhesively Repaired Pipes Subject to Internal Pressure. Int. J. Adhes. Adhes. 2017, 75, 88–95. DOI: 10.1016/j.ijadhadh.2017.02.015.
- Ayaz, Y.; Çitil, Ş.; Şahan, M. F. Repair of Small Damages in Steel Pipes with Composite Patches. Mater. Sci. Eng. Technol. 2016, 47(5–6), 503–511. DOI: 10.1002/mawe.201600526.
- Taib, A. A.; Boukhili, R.; Achiou, S.; Boukehili, H. Bonded Joints with Composite Adherends. Part II. Finite Element Analysis of Joggle Lap Joints. Int. J. Adhes. Adhes. 2006, 26(4), 237–248. DOI: 10.1016/j.ijadhadh.2005.03.014.
- Barile, C.; Casavola, C.; Moramarco, V.; Pappalettere, C.; Vimalathithan, P. K. Bonding Characteristics of Single- and Joggled-Lap CFRP Specimens: Mechanical and Acoustic Investigations. Applied Sciences. 2020, 10 5, 1782. DOI:10.3390/app10051782.
- Zimmermann, J.; Schalm, T.; Sadeghi, M. Z.; Gabener, A.; Schröder, K. U. Analytical Stiffness Analysis of Adhesively Bonded single-lap Joints Subjected to out-of-plane Deflection Due to Tensile Loading. J Adhes. 2022, 98(11), 1635–1662. DOI:10.1080/00218464.2021.1932483.
- Hassan Vand, M.; Abbaszadeh, H.; Shishesaz, M. Optimization of Adhesive single-lap Joints under Bending Moment. J Adhes. 2022, 9811, 1687–1712. DOI:10.1080/00218464.2021.1932485.
- Sun, L.; Tie, Y.; Hou, Y.; Lu, X.; Li, C. Prediction of Failure Behavior of Adhesively Bonded CFRP Scarf Joints Using a Cohesive Zone Model. Eng. Fract. Mech. 2020, 228, 106897. DOI: 10.1016/j.engfracmech.2020.106897.
- Alfano, G. On the Influence of the Shape of the Interface Law on the Application of cohesive-zone Models. Compos. Sci. Technol. 2006, 66(6), 723–730. DOI: 10.1016/j.compscitech.2004.12.024.
- Campilho, R. D. S. G.; Banea, M. D.; Neto, J. A. B. P.; da Silva, L. F. M. Modelling Adhesive Joints with Cohesive Zone Models: Effect of the Cohesive Law Shape of the Adhesive Layer. Int. J. Adhes. Adhes. 2013, 44, 48–56. DOI: 10.1016/j.ijadhadh.2013.02.006.
- Faneco, T. M. S.; Campilho, R. D. S. G.; Silva, F. J. G.; Lopes, R. M. Strength and Fracture Characterization of a Novel Polyurethane Adhesive for the Automotive Industry. J Testing Eval. 2017, 45(2), 398–407. DOI: 10.1520/JTE20150335.
- Monsef, S. A.; Pérez-Galmés, M.; Renart, J.; Turon, A.; Maimí, P. The Influence of Mode II Test Configuration on the Cohesive Law of Bonded Joints. Compos. Struct. 2020, 234, 111689. DOI: 10.1016/j.compstruct.2019.111689.
- Sadeghi, M. Z.; Gabener, A.; Zimmermann, J.; Saravana, K.; Weiland, J.; Reisgen, U.; Schroeder, K. U. Failure Load Prediction of Adhesively Bonded Single Lap Joints by Using Various FEM Techniques. Int. J. Adhes. Adhes. 2020, 97, 102493. DOI: 10.1016/j.ijadhadh.2019.102493.
- Moës, N.; Dolbow, J.; Belytschko, T. A Finite Element Method for Crack Growth without Remeshing. Int. J. Numer. Methods Eng. 1999, 46(1), 131–150. DOI: 10.1002/(SICI)1097-0207(19990910)46:1<131.
- Rabczuk, T.; Song, J.-H.; Zhuang, X.; Anitescu, C. Extended Finite Element and Meshfree Methods; Academic Press: London, UK, 2020.
- Machado, R. M. D.; Campilho, R. D. S. G.; Rocha, R. J. B. Extended Finite Element Modelling of Aluminium stepped-adhesive Joints. J. Adhes. 2019, 95(5–7), 450–473. DOI: 10.1080/00218464.2018.1548966.
- Liu, Y.; Lemanski, S.; Zhang, X. Parametric Study of Size, Curvature and Free Edge Effects on the Predicted Strength of Bonded Composite Joints. Compos. Struct. 2018, 202, 364–373. DOI: 10.1016/j.compstruct.2018.02.017.
- Correia, J. M. C.; Campilho, R. D. S. G.; Rocha, R. J. B.; Liu, Y.; Ramalho, L. D. C. Parametric Study of Composite Curved Adhesive Joints. Int. J. Adv. Manuf. Technol. 2020, 111(9–10), 2957–2970. DOI: 10.1007/s00170-020-06314-6.
- Ji, Y.; Li, Z.; Liu, L.; Wang, J.; Wu, J. A Deformation Detection Method for Aircraft Skin on Uniform Pressure by Using Speckle Image Correlation Technology. Measurement. 2020, 154, 107525. DOI: 10.1016/j.measurement.2020.107525.
- Campilho, R. D. S. G.; de Moura, M. F. S. F.; Domingues, J. J. M. S. Modelling Single and double-lap Repairs on Composite Materials. Composites Science and Technology 2005, 6513, 1948–1958 10.1016/j.compscitech.2005.04.007
- Neto, J. A. B. P.; Campilho, R. D. S. G.; da Silva, L. F. M. Parametric Study of Adhesive Joints with Composites. Int. J. Adhes. Adhes. 2012, 37, 96–101. DOI: 10.1016/j.ijadhadh.2012.01.019.
- Katsivalis, I.; Thomsen, O. T.; Feih, S.; Achintha, M. Development of Cohesive Zone Models for the Prediction of Damage and Failure of glass/steel Adhesive Joints. Int. J. Adhes. Adhes. 2020, 97, 102479. DOI: 10.1016/j.ijadhadh.2019.102479.
- de Souza Neto, E. A.; Perić, D.; Owen, D. R. J. Computational Methods for Plasticity, Theory and Applications; John Wiley and Sons Ltd: Sussex, UK, 2008; pp 816.
- Kim, K. Softening Behaviour Modelling of Aluminium Alloy 6082 Using a non-linear Cohesive Zone Law. Proc. Inst. Mech. Eng. Part L. 2015, 229(5), 431–435. DOI: 10.1177/1464420714525134.
- Campilho, R. D. S. G.; Banea, M. D.; Pinto, A. M. G.; da Silva, L. F. M.; de Jesus, A. M. P. Strength Prediction of Single- and double-lap Joints by Standard and Extended Finite Element Modelling. Int. J. Adhes. Adhes. 2011, 31(5), 363–372. DOI: 10.1016/j.ijadhadh.2010.09.008.
- Campilho, R. D. S. G.; de Moura, M. F. S. F.; Ramantani, D. A.; Morais, J. J. L.; Domingues, J. J. M. S. Buckling Behaviour of carbon–epoxy adhesively-bonded Scarf Repairs. J. Adhes. Sci. Technol. 2009, 23(10–11), 1493–1513. DOI: 10.1163/156856109X433045.
- Kang, S.-G.; Kim, M.-G.; Kim, C.-G. Evaluation of Cryogenic Performance of Adhesives Using composite–aluminum double-lap Joints. Compos. Struct. 2007,783, 440–446.DOI
- Lim, G.-H.; Heidari-Rarani, M.; Bodjona, K.; Raju, K. P.; Romanov, V.; Lessard, L. Mechanical Characterization of a Flexible Epoxy Adhesive for the Design of Hybrid bonded-bolted Joints. Polym. Test. 2019, 79, 106048. DOI: 10.1016/j.polymertesting.2019.106048.
- Nunes, S. L. S.; Campilho, R. D. S. G.; da Silva, F. J. G.; de Sousa, C. C. R. G.; Fernandes, T. A. B.; Banea, M. D.; da Silva, L. F. M. Comparative Failure Assessment of Single and double-lap Joints with Varying Adhesive Systems. J. Adhes. 2016, 92(7–9), 610–634. DOI: 10.1080/00218464.2015.1103227.