
 ?Mathematical formulae have been encoded as MathML and are displayed in this HTML version using MathJax in order to improve their display. Uncheck the box to turn MathJax off. This feature requires Javascript. Click on a formula to zoom.
ABSTRACT
The reliability of adhesive bond strength influences the applicability of structural adhesives in industries. The statistical probability distribution of the strength of adhesive joints is an essential indicator when designing and choosing adhesives. In this study, we experimentally studied the probability distribution of the strength of adhesive joints. The strength data were collected using a novel high-throughput technique consisting of a sample preparation method and shear testing device. Numerous cylindrical butt shear-joint specimens were prepared by mechanical machining and tested using a self-developed shear testing device. The effect of moisture absorption by the adhesive was specifically considered. The probability distribution of the shear strength of the epoxy adhesive joints was characterized using five probability distribution functions: Normal, Lognormal, Exponential, Weibull, and Gamma. Quantile – quantile plots were employed to determine the suitability of each distribution function. The results suggested that the Weibull and Normal distributions were best suited for describing the probability distribution of the strength of the epoxy adhesive joints. The Weibull distribution is particularly suitable for brittle epoxy adhesives. Moisture absorption reduced both the mean and variance of the shear strength, which might be attributed to the plasticization of the adhesives. The high-throughput method proposed in this study significantly improved the efficiency of testing adhesive joints. It not only contributes to the study of the strength distributions of adhesive joints but also helps to shorten the research and development cycle of new adhesives by facilitating rapid strength evaluation.
1. Introduction
Adhesively bonded joints have significant advantages over traditional joining techniques, such as welding and riveting, in terms of light weight, smooth stress distribution, low manufacturing cost, and ability to join dissimilar materials.[Citation1,Citation2] They are widely used in various industries,[Citation3–7] specifically in the automotive[Citation3,Citation4] and railway[Citation5] industries, because of their advantage of achieving a lower weight of the manufactured product over welding. As polymer composites such as CFRP are being increasingly used in aircraft, adhesive bonding has become one of the most suitable joining technologies for achieving both light weight and high mechanical performance in the aerospace sector.[Citation6] Composite materials and adhesive bonding are also being increasingly used in large vessels owing to their low weight and corrosion resistance.[Citation7]
The large variance in the mechanical strength of adhesive joints, particularly in terms of long-term durability and weatherability, hinders the use of adhesive technology.[Citation8] The uncertainty in the strength of adhesive joints can be attributed to many factors, such as water moisture,[Citation9] pre-treatment,[Citation10] and adhesive thickness.[Citation11] Therefore, although several theoretical models have been proposed,[Citation12–14] the strength and strength distribution of adhesive joints are difficult to predict. This often leads to adhesive bonding being considered less reliable than traditional mechanical joining. The statistical distribution of the strength of adhesive joints should be researched to realize the wide applicability of structural adhesives.
The strength of adhesive joints is usually assessed using the mean and standard deviation by assuming a normal distribution. However, some studies[Citation15,Citation16] have found that the Weibull distribution provides a good fit for the strength of adhesive joints. The Weibull distribution was originally developed to characterize the strength of brittle materials,[Citation17] which is critically influenced by the presence of cracks. Therefore, the Weibull distribution has been employed to describe the fracture strengths of ceramics,[Citation18] carbon fibers,[Citation19] glass/epoxy and carbon/epoxy composites,[Citation20] and adhesively bonded joints.[Citation21–23] Seo et al.[Citation15] employed the Weibull theory to evaluate the strength of adhesive butt joint specimens. Their results revealed that tensile and shear specimens with higher sectional areas had higher Weibull moduli, suggesting a lower variation in the strength. Weibull distribution has also been used to analyze the bond strengths of resin-based dental restorative materials to dentin[Citation24] and optimize the adhesive thickness in structural adhesive joints.[Citation25] Vallée et al.[Citation26] studied the statistical distribution of the strength of adhesive joints by using the Weibull distribution. To address the underestimation of the joint strength predicted by the Weibull distribution, Vallée et al.[Citation27,Citation28] attempted to find the most appropriate distribution function for predicting the joint strength by comparing several improved probabilistic distributions. They found that the generalized lambda distribution presented the best prediction for joint strength, especially the strength distribution at the upper tail.
Large datasets are required when determining the best distribution functions for modeling the joint strength. Preparing numerous testing samples and obtaining the measurements are usually time consuming, even for simple single-lap shear joints. Furthermore, small variations in the local geometry of the adhesive layers can significantly affect the strength measurement[Citation29] and make it difficult to understand the actual probability distribution of the strength. Considering the large scatter and uncertainties in the strength measurements of adhesive joints, a high-throughput method to efficiently prepare the specimens and obtain measurements needs to be developed to obtain large datasets for studying the probability distributions of the strength of adhesive joints.
A novel shear testing device was recently developed[Citation30] by the authors to achieve high-throughput measurements of the shear strength of adhesive joints under the CREST program of the Japan Science and Technology Agency. In this study, the testing device was improved to provide more reliable strength measurements for evaluating the probability distribution of the strength of adhesively bonded joints. Furthermore, a mechanical-machining-based high-throughput specimen preparation method was developed to prepare cylindrical adhesive joints. The specimen preparation method coupled with the novel testing device enabled the efficient provisioning of reliable strength datasets for adhesive joints. Five probability distribution functions were used to describe the shear strength to find the most appropriate distribution function for describing the strength of adhesive joints. The influence of aging on the strength and its statistical distribution was investigated.
2. High-throughput shear tests
2.1. High-throughput testing device
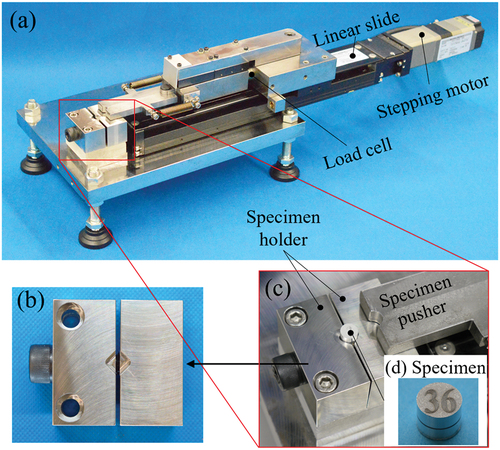
A novel testing device was developed for the high-throughput evaluation of the shear strength of adhesively bonded joints. shows the photographs of the device along with enlarged views of the (b) specimen holder, (c) loading part, and (d) butt joint specimen. The device is similar to that presented in[Citation30] except for the improved design of the specimen holder (see for more reliable fixing of the specimens. The specimen holder consisted of two stainless steel blocks; a 3 mm-deep 90° groove was introduced on the edge of each block to fix the testing specimen. The cylindrical butt shear-joint (BSJ) specimen consisted of two 3 mm-thick adherents and one adhesive layer. The bottom adherent was fixed in the grooves of the specimen holder using a fixing bolt. During the shear test, the pusher was powered by a stepping motor to remove the upper adherent of the joint specimen along the radial direction of the adhesive layer until fracture of the adhesive occurred. The applied force was monitored using a load cell, and the displacement of the upper adherent was recorded as the linear movement of the pusher.
Figure 1. (a) photographs of the high-throughput shear testing device with the enlarged (b) specimen holder, (c) loading part, and (d) butt joint specimen.
2.2. Testing specimens
2.2.1. Adhesive materials
Two types of thermoset epoxy adhesives were used to prepare the butt joint specimens: a one-component adhesive provided by Cemedine Co., Ltd. (Tokyo, Japan) and a two-component commercial adhesive, Denatite 2204, purchased from Nagase Chemtex Corp. (Osaka, Japan). The one-component adhesive mainly consisted of bisphenol A epoxy as the base resin and dicyandiamide (DICY) as the curing agent. Carboxyl-terminated butadiene (CTBN) acrylonitrile rubber was added to improve the fracture toughness. The properties of this epoxy have been previously reported.[Citation31–35] In this study, the one- and two-component adhesives were named Epoxy-1 and Epoxy-2, respectively. The curing conditions for Epoxy-1 and Epoxy-2 were 180°C for 60 min and 100°C for 30 min, respectively. The stress – strain curves () of the two adhesives were acquired by conducting tensile tests at a displacement rate of 1 mm/min.[Citation36] Significant plastic deformation of Epoxy-1 was observed when compared with the brittle Epoxy-2. The typical properties of the two adhesives are listed in .
Figure 2. Stress–strain curves of Epoxy-1 and Epoxy-2.
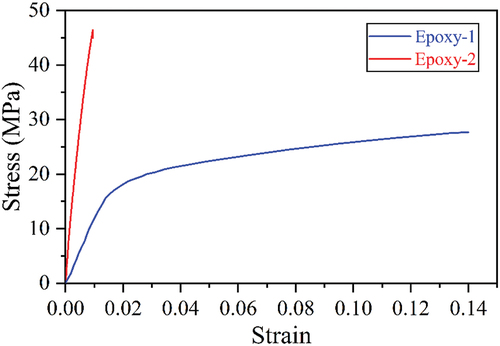
Table 1. Typical properties of two types of epoxy adhesives.
2.2.2. Specimen geometries
The cylindrical butt joint specimen consisted of two aluminum alloy (A2017) adherents and a 0.5 mm-thick adhesive layer. The adherent had a diameter of 8 mm and height of 3 mm. The cylindrical butt joint specimen was selected to conduct the shear tests mainly because it can be efficiently prepared using mechanical machining, as discussed in Section 3.1.
2.3. Moisture absorption of adhesive layers
2.3.1. Immersion conditions
Some of the butt joint specimens with an Epoxy-1 adhesive layer were immersed in 42°C pure water for 21 days to ensure moisture penetration into the center of the adhesive layer. The numerical simulation of the moisture distribution will be presented in the following section. In the shear tests, moist and dry specimens were examined individually and their results were compared to evaluate the effect of moisture absorption. Regarding the testing of moist specimens, the Epoxy-1 specimens were cooled in the pure water at room temperature for 24 h. Then, the specimens were tested immediately after removal from the pure water.
2.3.2. Finite element simulation for calculating the moisture absorption
During immersion in pure water, the water diffused into the adhesive layer from the edge to the center, following Fick’s second law:
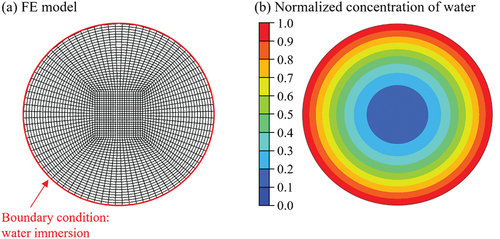
where C is the concentration of water and D is the diffusion coefficient. x and y denote the radial directions of the adhesive layer. In this simulation, the diffusion coefficient was assumed consistent along the thickness direction. The diffusion coefficient of Epoxy-1 immersed in 42°C water was 2.76 × 10⁻³ mm2/h, which was experimentally measured with a gravimetric method[Citation37] using Fick’s law of diffusion by fitting the early-stage data.[Citation31] Experiments and numerical simulations[Citation31] have shown that Fick’s diffusion law provides good predictions of the moisture distribution in the bulk Epoxy-1 specimens at 42°C. The commercial software ABAQUS/Standard (2021) was used to perform the moisture diffusion simulations. A two-dimensional model was used because the distribution of moisture along the direction of the adhesive thickness was not considered. The finite element (FE) model and simulation results of the normalized moisture distribution (42°C water for 21 days) are shown in . In the FE model, the water concentration at the edge of the adhesive was set as saturated during the simulation. The mesh size was 0.1 mm. shows the distribution of water concentration in the adhesive layer. It was normalized to 0–1, where 1.0 means the adhesive was saturated with water. The concentration of water was 0.1 at the center of the adhesive layer. This moisture level was high enough to influence the shear strength of adhesive joints according to the shear test results in Section 4.
Figure 3. (a) FE model of the moisture diffusion simulation with mesh distribution. The mesh size was 0.1 mm. (b) simulation results of the normalized concentration of water in the adhesive layer.
2.4. Conditions for shear tests
Three types of specimens with the following adhesive layers were tested: dry Epoxy-1, moist Epoxy-1, and dry Epoxy-2. All shear tests were conducted at a room temperature of 20 ± 2°C. The specimen pusher velocity was controlled at 0.05 mm/s in all the tests.
3. High-throughput preparation of testing specimens
3.1. Specimen preparation
The preparation of adhesive joint specimens, such as single-lap joints, is usually time consuming because each specimen requires special attention to align the adherents, remove the fillets, etc., to achieve high-quality joint specimens. Hence, a novel specimen preparation technique based on mechanical machining is proposed for improving the efficiency of preparing shear testing specimens.
The overall process of high-throughput preparation of butt joint specimens is illustrated in . First, three 160 mm × 160 mm × 3.0 mm A2017 aluminum alloy plates were pre-machined using a CNC machining center (ROBODRILL α-D14MiB5, Fanuc Co., Ltd., Yamanashi, Japan). Aluminum plates were cut to a depth of 2.5 mm to prepare 9 × 9 columns with a diameter of 9.0 mm (No. ① in ). This pre-machining aims to reduce the cutting force and the resulting cutting heat generated during the final machining after applying the adhesives, which may influence the strength of the joints. Three pre-machined aluminum plates were then bonded with two types of adhesives: Epoxy-1 (or Epoxy-2) between the top and middle aluminum alloy plates, and a removable two-component epoxy adhesive (Q-BOND, Nikka Seiko Co., Ltd., Tokyo, Japan) between the middle and base aluminum alloy plates (No. ②in ). Q-BOND was cured at room temperature for 20 h, and could be removed through hot water immersion. Epoxy-1 (or Epoxy-2) and Q-BOND adhesives were applied to the rear surfaces of the top and middle plates, respectively. Two 6 kg weights were placed on the top plate during adhesive curing to improve bonding. Four aluminum bars with diameters of 3.0 mm were inserted into the grooves of the middle and base aluminum alloy plates as spacers. The thickness of the adhesive layers was determined by the difference between the diameter of the bars and depth of the grooves of the aluminum plates, which was 0.5 mm. The top and middle aluminum layers were bonded first, and the reversible adhesive was applied and cured after Epoxy-1 (or Epoxy-2) was fully cured and cooled to room temperature. The top and middle adherents and the base layer were sandblasted with Al2O3 (SG-118-120 Grid #120, Hozan Tool Ind. Co., Ltd., Osaka, Japan) and wiped with acetone prior to bonding.
Figure 4. Overall process of high-throughput preparation of the butt shear-joint (BSJ) specimens. ① aluminum plate after pre-machining. ② 5-layered structures. ③ 5-layered structures after the final milling process. ④ removing specimens after hot water immersion. ⑤ a sample specimen.
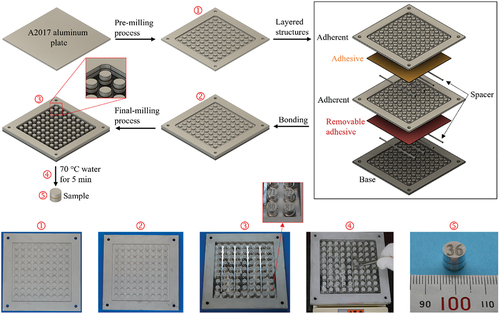
The five-layered structures were then machined from the top surface to the groove of the base layer using the CNC machining center to manufacture d = 8 mm cylindrical butt joints (No. ③in ). Finally, the structures were placed on a heater and injected with water. The water was carefully controlled to cover the removable adhesive but remain below the test adhesive (i.e., Epoxy-1 or Epoxy-2). The single specimens were removed from the structures after immersion in hot water at 70°C for 5 min (No. ④ in ). With this method, 81 samples could be prepared simultaneously. This study provides an alternative method for preparing numerous uniform joint samples with minimal labor, which is particularly beneficial in preparing large datasets for machine learning.
3.2. Comparison of characteristics between the current specimens and other adhesive joints
3.2.1. Uniform specimen geometry
The mechanical machining-based method of specimen preparation allows precise control of the dimensions of the specimen using the CNC machining center; therefore, uniform specimens can be prepared to eliminate the effect of the variability of specimen geometry on the experimental results. Furthermore, the edges of the adhesive layers sandwiched between the adherents were very smooth without any fillets (No. ⑤ in ) that simplified the stress distribution of the joints. It is believed that the current specimen can provide a more accurate evaluation of the strength of adhesive joints.
3.2.2. Low stress concentration at adhesive edges
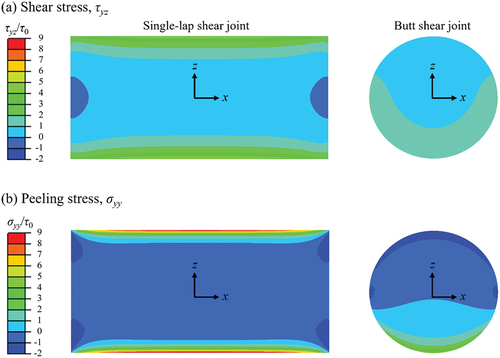
Owing to the relatively high-stiffness adherent and small bonding area, the current specimens exhibited rather low stress concentrations at the adhesive edges. An elastic FE simulation was performed using ABAQUS/Standard 2021 to verify the low stress concentration of the current specimen when compared with that of the single-lap joint specimen under static loading. The calculation results for the distribution of shear stress τyz and peeling stress σyy in the adhesive layer are compared in . The color bar denotes the normalized stresses, where τ0 = applied force/bonding area. Calculation results suggested that a much lower stress concentration was generated at the adhesive edges of the current specimens. The details of the simulation model can be found in a recent study.[Citation30] Although the joint specimens prepared in some studies had very low or even zero stress concentration,[Citation38–40] all of them required considerable time to prepare the specimens and complete the measurements, which makes it almost impossible to prepare large datasets efficiently.
Figure 5. Distributions of (a) shear stress and (b) peeling stress at the middle surface of the adhesive layer for single-lap shear joint and butt shear joint specimens. Color bar shows the normalized shear stress and peeling stress, where τ0 = applied force/bonding area. The applied force was along the z-axis.
4. Experimental results of shear tests
presents the (a) typical force – displacement curves of three types of butt joint specimens, (b) illustration of the fracture behaviors of the adhesive layers, (c) photographs of the fracture surfaces, (d) laser microscope images of the fracture surfaces, and (e) epi-fluorescence microscope images of the fracture surfaces. In , the highest failure force was measured for Epoxy-2. This might be due to the higher material strength of Epoxy-2 when compared with that of Epoxy-1 (see ). Epoxy-1 showed significant plastic deformation in the tensile tests owing to rubber modification; however, its deformability was suppressed in the shear tests owing to the different loading conditions. Under tensile loading, high triaxial stress induces cavitation or debonding of rubber particles, which increases the plastic deformation. Under shear loading, the relatively low triaxial stress suppresses the cavitation or debonding of rubber particles; therefore, brittle fracture was observed in our shear tests.
Figure 6. (a) force – displacement curves of three types of butt joint specimens. (b) illustration of the fracture behaviors of adhesive layers. (c) photographs of fracture surfaces. (d) laser microscope images of fracture surfaces. (e) epi-fluorescence microscope images of fracture surfaces.
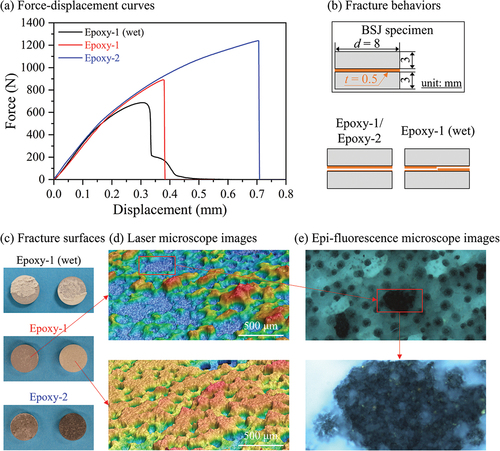
After moisture absorption, the maximum force of the Epoxy-1 specimen decreased by approximately 10%. This could be caused by plasticization and swelling of the adhesives.[Citation9] As shown in the curve in , obvious plastic deformation was observed in the Epoxy-1 specimen after moisture absorption. In Epoxy-1 after moisture absorption, as illustrated in , the cracks propagated from the two adhesive edges to the center, and finally, the adhesive broke at the center. This different fracture behavior from that of the other two types of specimens can be attributed to plasticization, which prevents rapid crack propagation along the adhesive layer. Therefore, cracks can initiate and propagate at two stress concentration points. Photographs of the fracture surfaces are presented in , where thin-layer cohesive failure with relatively flat fracture surfaces was observed in the Epoxy-1 and Epoxy-2 specimens. Images taken by a laser microscope (BX53, Olympus Corp., Tokyo, Japan) and an epi-fluorescence microscope (VK-X3000, Keyence Corp., Osaka, Japan) are provided in . The weak fluorescence observed in the enlarged image taken by the epi-fluorescence microscope revealed a thin-layer cohesive failure of the adhesive layers.
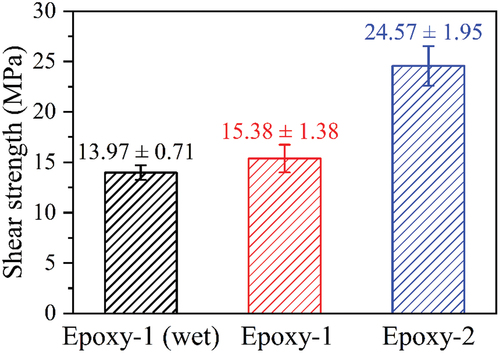
The shear strength of the adhesive joints was calculated as Fmax/(π∙r2), where Fmax is the maximum force and r = 4 mm is the radius of the adhesive layer. In this study, 48, 74, and 99 data points were collected for the adhesive joints of Epoxy-1, Epoxy-1 after moisture absorption, and Epoxy-2, respectively. The thickness of the adhesive layers was measured as 0.50 ± 0.07 mm. The averages and standard deviations of the shear strengths of the three specimen types are presented in . The highest shear strength was measured for Epoxy-2 owing to its higher material strength (). In Epoxy-1, moisture absorption not only reduced the shear strength but also lowered the magnitude of the standard deviation by approximately 50%. It can be speculated that the plasticization of Epoxy-1 owing to moisture absorption suppressed the effect of random defects in the adhesive layers (i.e., voids and microcracks) on the dispersion of the shear strength.
Figure 7. Averages and standard deviations of the shear strength of three types of specimens measured in high-throughput shear tests.
5. Probability distribution of strength of adhesive joints
5.1. Histogram plots and probability plots
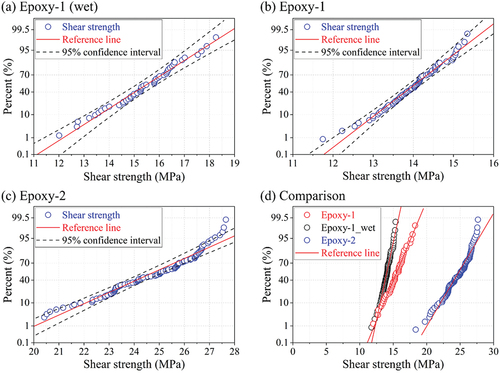
To investigate the probability distribution of the shear strength, histogram plots of the shear test results for the three types of specimens are plotted in . A normal distribution curve was estimated and overlaid on each graph. In the histogram plots, the normal distribution appeared to have a better fit for Epoxy-1 than for the other two types of specimens. presents the probability plots of the shear strength measurements for (a) Epoxy-1 after moisture absorption, (b) Epoxy-1, (c) Epoxy-2, and (d) a comparison of the three types of specimens. The red line represents the reference line and indicates a normal distribution. The black dashed lines in indicate the 95% confidence intervals for the normal distribution. The strength measurements of Epoxy-1 with moisture absorption presented the best fit with a normal distribution, where all data points were within the 95% confidence interval (). This result differs from the result of the histogram plots, where Epoxy-1 presented a higher normality. This might have been caused by the limitations of the histogram plots when determining the normality, as the dataset is not significantly large.
Figure 8. Histogram plots of the shear strength measurements for (a) Epoxy-1 after moisture absorption, (b) Epoxy-1, and (c) Epoxy-2. A normal distribution curve was estimated and overlaid in each graph.
Figure 9. Probability plots of shear strength measurements for (a) Epoxy-1 after moisture absorption, (b) Epoxy-1, (c) Epoxy-2, and (d) a comparison of the three types of specimens.
5.2. Quantile – quantile plots to find the best-fit distributions
A quantile – quantile (Q – Q) plot is a probability plot that graphically compares two probability distributions. It is typically used to compare a dataset with a theoretical distribution model to investigate its goodness of fit.[Citation41–43]
5.2.1. Five probability distributions
Five commonly used distributions (normal, lognormal, exponential, Weibull, and gamma) were considered to determine the best-fit theoretical distributions for the shear strength of the adhesive joints. Their probability density functions have the following forms:
where Г is the incomplete gamma function defined by
where μ is the shape factor (mean) and σ is the scale factor (standard deviation). The normal (Gaussian) distribution,[Citation44] which describes the symmetrical distribution of values about the mean, is an important tool for describing the random variation of data in various scientific disciplines. The lognormal distribution, which is a right-skewed curve, is widely used to describe the distribution of positive random data. In particular, its suitability for describing workplace exposure to contaminants[Citation45] and biological data[Citation46] has been validated. The Weibull distribution is the most popular distribution used in modern statistics. It can fit data from numerous fields and is the most widely used distribution for material reliability and lifetime data analysis.[Citation47] The Gamma distribution is commonly used to describe temporally averaged precipitation statistics.[Citation48] The exponential distribution is a special case of the Weibull and gamma distributions when the shape factor μ = 1.
5.2.2. Q – Q plots under various distributions
Q – Q plots of the shear strengths of the three types of specimens, i.e., Epoxy-1 after moisture absorption, Epoxy-1, and Epoxy-2, are depicted in considering the five distribution functions. The Q – Q plots were generated using the commercial data analysis and graphing software OriginPro (OriginLab Corp.). presents the scale and shape factors of each specimen for various distributions. In , the horizontal axis represents the theoretical quantiles of each distribution function and the vertical axis represents the experimentally measured shear strength. Five distributions were investigated: (a) normal, (b) lognormal, (c) exponential, (d) Weibull, and (e) gamma. Among the five theoretical distributions, the exponential distribution failed to describe the shear strength distribution. The other four distributions appeared to provide a good fit to the experimental data. Most of the data fell within the 95% confidence interval, except for several maximum or minimum values in some graphs.
Figure 10. Quantile–quantile (Q – Q) plots for Epoxy-1 after moisture absorption. Five distributions (a) normal, (b) Lognormal, (c) exponential, (d) Weibull, and (e) Gamma were investigated to assess the goodness of fit to experimental data.
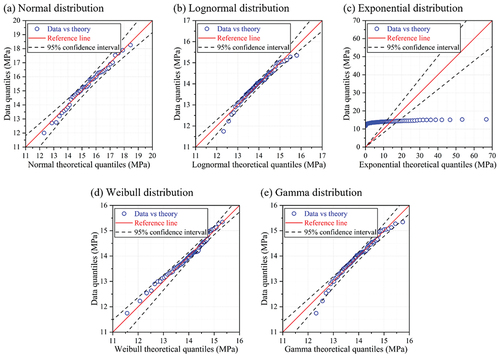
Figure 11. Q – Q plots for Epoxy-1.
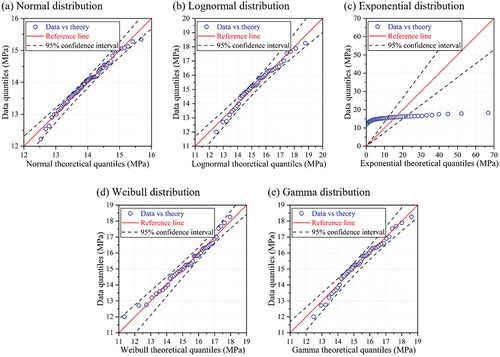
Figure 12. Q – Q plots for Epoxy-2.
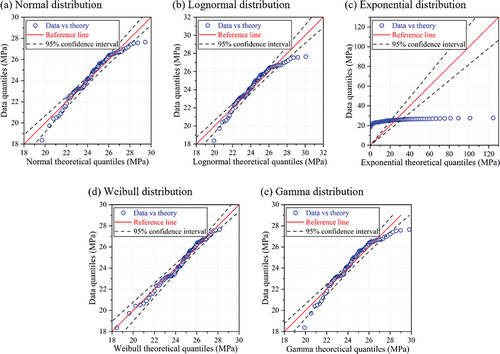
Table 2. Shape and scale factors of each specimen for various distributions.
To quantitatively evaluate the goodness of fit of the five distribution functions and find the most appropriate theoretical distribution to describe the shear strength of adhesive joints, the minimum chi-square criterion,[Citation49] Pearson correlation coefficient,[Citation50] and coefficient of determination[Citation51] were employed to test the five probability distribution models using the data of the Q – Q plots. The chi-square test is one of the oldest methods for testing the goodness of fit, and is described as follows:
where xi and yi are the experimental and theoretical shear strengths in the Q – Q plot, respectively. The Pearson correlation coefficient rxy is calculated as
where and
represent the means of xi and yi. The coefficient of determination R2 is calculated as
A smaller value of the chi-square test, χ2, or a larger Pearson correlation coefficient rxy and coefficient of determination R2 indicates a better fit.
The calculation results of the (a) chi-square test, (b) coefficient of determination, and (c) Pearson correlation coefficient are summarized in , respectively, for the three types of adhesive joints and five theoretical distributions. The exponential distribution presented the worst fit to the shear strength, as shown in . In , the lowest χ2 was calculated for the Weibull distributions for Epoxy-1 and Epoxy-2. Especially for the brittle Epoxy-2, the Weibull distribution had χ2 of 0.174, which was much lower than that of the other distributions. It suggested that the Weibull distribution was particularly appropriate for describing the strength of brittle adhesive joints. The normal distribution had the lowest χ2 for Epoxy-1 after moisture absorption, whereas χ2 of the Weibull distribution was the second lowest following that of the normal distribution. In , an unusual negative R2 was calculated for the exponential distribution owing to the large variance between the experimental results and the exponential theoretical strength. The magnitudes of rxy and R2 (see ) for the other four distributions were all above 0.93, suggesting a good fit to the shear strength. Among them, the Weibull distribution had the highest rxy and R2 for Epoxy-1 after moisture absorption and Epoxy-2. For dry Epoxy-1, the Weibull distribution had the second-highest rxy and R2, which were slightly lower than those of the normal distribution. Except for the exponential distribution, the magnitudes of rxy and R2 of each distribution surpassed 0.97 for the Epoxy-1 specimens regardless of the moisture absorption. Although moisture absorption contributes to the plasticization of Epoxy-1 and reduces the shear strength and its standard deviation, there were no significant differences in the magnitudes of rxy and R2. For brittle Epoxy-2, the Weibull distribution was clearly superior to the other distributions according to the calculation results of rxy and R2.
Table 3. Chi-square test values χ2 of the data in Q–Q plots for three types of specimens and various distribution functions.
Table 4. Coefficient of determination R2 of the data in the Q–Q plots for three types of specimens and various distribution functions.
Table 5. Pearson correlation coefficient rxy of the data in the Q–Q plots for three types of specimens and various distribution functions.
In conclusion, among the five theoretical distributions, the normal and Weibull distributions seemed to have the best fit for the Epoxy-1 specimens regardless of moisture absorption. For brittle Epoxy-2, the Weibull distribution revealed a much better fit than the other distributions. Previous studies[Citation15,Citation21–25] have attempted to predict the strength of adhesive joints using the Weibull distribution function because of the intrinsic fracture mechanisms of brittle epoxy adhesives, which share some similarities with other brittle materials. The results of this study provided experimental evidence and a comparative analysis of various theoretical distributions and suggested that the Weibull distribution function can be an appropriate theoretical distribution to characterize the strength of brittle epoxy adhesives.
6. Conclusions
In this study, a high-throughput technique was developed to determine the probability distribution of the shear strength of adhesively bonded joints. Cylindrical butt joint specimens were prepared using a novel mechanical machining method. The specimens were then tested using a self-developed testing machine to evaluate the probability distributions of the shear strength of the adhesive joints, with special consideration for moisture absorption. The main conclusions are as follows:
The proposed technique is promising for the efficient preparation and testing of adhesively bonded joints.
A larger variance (i.e., standard deviation) of the shear strength was measured for adhesive joints with greater brittleness. Both the mean and variance of the shear strength decreased after moisture absorption. This could have been caused by the plasticization of the epoxy adhesives.
The Weibull and normal distributions described the shear strength of the epoxy adhesive joints better than the lognormal, exponential, and gamma distributions. The Weibull distribution showed the best goodness of fit for brittle adhesives. This can be attributed to the similarities between the fracture mechanisms of brittle epoxy adhesives and other brittle materials such as ceramics.
The high-throughput method proposed in this study significantly improves the efficiency of testing adhesively bonded joints. It not only contributes to the study of the strength distributions of adhesive joints but also shortens the research and development cycle of new adhesives through rapid evaluation. The main limitation of the current method is that only one specimen type can be prepared at a time. Future work will address this limitation by preparing various types of specimens (i.e., adhesive type, thickness, curing condition) simultaneously. Additionally, the mechanical machining method will be expanded to prepare other specimens for evaluating different properties of adhesive joints.
Acknowledgments
The authors thank Mr. T. Sugihara at the Design and Manufacturing Division, Open Facility Center, Tokyo Institute of Technology, for preparing the test samples.
Disclosure statement
No potential conflict of interest was reported by the author(s).
Additional information
Funding
References
- Banea, M. D.; da Silva, L. F. M. Adhesively Bonded Joints in Composite Materials: An Overview. Proc. Inst. Mech. Eng. Part L J. Mater. Des. Appl. 2009, 223(1), 1–18. DOI: 10.1243/14644207JMDA219.
- Budhe, S.; Banea, M. D.; de Barros, S.; da Silva, L. F. M. An Updated Review of Adhesively Bonded Joints in Composite Materials. Int. J. Adhes. Adhes. 2017, 72, 30–42. DOI: 10.1016/j.ijadhadh.2016.10.010.
- Dilthey, U.; Stein, L. Multimaterial Car Body Design: Challenge for Welding and Joining. Sci. Technol. Weld. Joining. 2006, 11(2), 135–142. DOI: 10.1179/174329306X85967.
- Antelo, J.; Akhavan-Safar, A.; Carbas, R. J. C.; Marques, E. A. S.; Goyal, R.; da Silva, L. F. M. Replacing Welding with Adhesive Bonding: An Industrial Case Study. Int. J. Adhes. Adhes. 2022, 113, 103064. DOI: 10.1016/j.ijadhadh.2021.103064.
- Beber, V. C.; Brede, M. Multiaxial Static and Fatigue Behaviour of Elastic and Structural Adhesives for Railway Applications. Procedia Struct. Integr. 2020, 28, 1950–1962. DOI: 10.1016/j.prostr.2020.11.018.
- Kupski, J.; Teixeira de Freitas, S. Design of Adhesively Bonded Lap Joints with Laminated CFRP Adherends: Review, Challenges and New Opportunities for Aerospace Structures. Compos. Struct. 2021, 268, 113923. DOI: 10.1016/j.compstruct.2021.113923.
- Speth, D. R.; Yang, Y. P.; Ritter, G. W. Qualification of Adhesives for Marine Composite-To-Steel Applications. Int. J. Adhes. Adhes. 2010, 30(2), 55–62. DOI: 10.1016/j.ijadhadh.2009.08.004.
- Barnes, T. A.; Pashby, I. R. Joining Techniques for Aluminium Spaceframes Used in Automobiles: Part II - Adhesive Bonding and Mechanical Fasteners. J. Mater. Process. Technol. 2000, 99(1–3), 72–79. DOI: 10.1016/S0924-0136(99)00361-1.
- Viana, G.; Costa, M.; Banea, M. D.; Da Silva, L. F. M. A Review on the Temperature and Moisture Degradation of Adhesive Joints. Proc. Inst. Mech. Eng. Part L J. Mater. Des. Appl. 2017, 231(5), 488–501. DOI: 10.1177/1464420716671503.
- Lunder, O.; Olsen, B.; Nisancioglu, K. Pre-Treatment of AA6060 Aluminium Alloy for Adhesive Bonding. Int. J. Adhes. Adhes. 2002, 22(2), 143–150. DOI: 10.1016/S0143-7496(01)00049-5.
- da Silva, L. F. M.; Rodrigues, T. N. S. S.; Figueiredo, M. A. V.; de Moura, M. F. S. F.; Chousal, J. A. G. Effect of Adhesive Type and Thickness on the Lap Shear Strength. J. Adhes. 2006, 82(11), 1091–1115. DOI: 10.1080/00218460600948511.
- Volkersen, O. Die niektraftverteilung in zugbeanspruchten mit konstanten laschenquerschritten. Luftfahrtfor schung. 1938, 15, 41–47.
- Goland, M.; Reissner, E. The Stresses in Cemented Joints. J. Appl. Mech. 1944, 11(1), A17–A27. DOI: 10.1115/1.4009336.
- Delale, F.; Erdogan, F.; Aydinoglu, M. N. Stresses in Adhesively Bonded Joints: A Closed-Form Solution. J. Compos. Mater. 1981, 15(3), 249–271. DOI: 10.1177/002199838101500305.
- Seo, D. W.; Lim, J. K. Tensile, Bending and Shear Strength Distributions of Adhesive-Bonded Butt Joint Specimens. Compos. Sci. Technol. 2005, 65(9), 1421–1427. DOI: 10.1016/j.compscitech.2004.12.013.
- Jojibabu, P.; Jagannatham, M.; Haridoss, P.; Janaki Ram, G. D.; Deshpande, A. P.; Bakshi, S. R. Effect of Different Carbon Nano-Fillers on Rheological Properties and Lap Shear Strength of Epoxy Adhesive Joints. Compos. Part A Appl. Sci. Manuf. 2016, 82, 53–64. DOI: 10.1016/j.compositesa.2015.12.003.
- Weibull, W. A Statistical Distribution Function of Wide Applicability. J. Appl. Mech. 1951, 18(3), 293–297. DOI: 10.1115/1.4010337.
- Danzer, R.; Supancic, P.; Pascual, J.; Lube, T. Fracture Statistics of Ceramics - Weibull Statistics and Deviations from Weibull Statistics. Eng. Fract. Mech. 2007, 74(18), 2919–2932. DOI: 10.1016/j.engfracmech.2006.05.028.
- Loidl, D.; Paris, O.; Rennhofer, H.; Müller, M.; Peterlik, H. Skin-Core Structure and Bimodal Weibull Distribution of the Strength of Carbon Fibers. Carbon. 2007, 45(14), 2801–2805. DOI: 10.1016/j.carbon.2007.09.011.
- Naresh, K.; Shankar, K.; Velmurugan, R. Reliability Analysis of Tensile Strengths Using Weibull Distribution in Glass/Epoxy and Carbon/Epoxy Composites. Compos. B Eng. 2018, 133, 129–144. DOI: 10.1016/j.compositesb.2017.09.002.
- Afendi, M.; Abdul Majid, M. S.; Daud, R.; Abdul Rahman, A.; Teramoto, T. Strength Prediction and Reliability of Brittle Epoxy Adhesively Bonded Dissimilar Joint. Int. J. Adhes. Adhes. 2013, 45, 21–31. DOI: 10.1016/j.ijadhadh.2013.03.008.
- Fernandez, G.; Vandepitte, D.; Usabiaga, H.; Debruyne, S. Static and Cyclic Strength Properties of Brittle Adhesives with Porosity. Int. J. Fatigue. 2018, 117, 340–351. DOI: 10.1016/j.ijfatigue.2018.08.018.
- Freed, Y.; Zobeiry, N.; Salviato, M. Development of Aviation Industry-Oriented Methodology for Failure Predictions of Brittle Bonded Joints Using Probabilistic Machine Learning. Compos. Struct. 2022, 297, 115979. DOI: 10.1016/j.compstruct.2022.115979.
- Burrow, M. F.; Thomas, D.; Swain, M. V.; Tyas, M. J. Analysis of Tensile Bond Strengths Using Weibull Statistics. Biomater. 2004, 25(20), 5031–5035. DOI: 10.1016/j.biomaterials.2004.01.060.
- Arenas, J. M.; Narbón, J. J.; Alía, C. Optimum Adhesive Thickness in Structural Adhesives Joints Using Statistical Techniques Based on Weibull Distribution. Int. J. Adhes. Adhes. 2010, 30(3), 160–165. DOI: 10.1016/j.ijadhadh.2009.12.003.
- Vallée, T.; Correia, J. R.; Keller, T. Probabilistic Strength Prediction for Double Lap Joints Composed of Pultruded GFRP Profiles – Part II: Strength Prediction. Compos. Sci. Technol. 2006, 66(13), 1915–1930. DOI: 10.1016/j.compscitech.2006.04.001.
- Vallée, T.; Keller, T.; Fourestey, G.; Fournier, B.; Correia, J. R. Adhesively Bonded Joints Composed of Pultruded Adherends: Considerations at the Upper Tail of the Material Strength Statistical Distribution. Probab. Eng. Mech. 2009, 24(3), 358–366. DOI: 10.1016/j.probengmech.2008.10.001.
- Vallée, T.; Kaufmann, M.; Adams, R. D.; Albiez, M.; Correia, J. R.; Tannert, T. Are Probabilistic Methods a Way to Get Rid of Fudge Factors? Part II: Application and Examples. Int. J. Adhes. Adhes. 2023, 124, 103364. DOI: 10.1016/j.ijadhadh.2023.103364.
- Adams, R. D.; Harris, J. A. The Influence of Local Geometry on the Strength of Adhesive Joints. Int. J. Adhes. Adhes. 1987, 7(2), 69–80. DOI: 10.1016/0143-7496(87)90092-3.
- Kang, C.; Machado, J. J. M.; Sekiguchi, Y.; Ji, M.; Sato, C.; Naito, M. A Butt Shear Joint (BSJ) Specimen for High Throughput Testing of Adhesive Bonds. J. Adhes. 2023, 99(14), 2080–2096. DOI: 10.1080/00218464.2023.2170794.
- Han, J.-W.; Sekiguchi, Y.; Shimamoto, K.; Akiyama, H.; Sato, C. Experimental Measurement of Moisture Distribution in the Adhesive Layer Using Near-Infrared Spectroscopy. J. Appl. Polym. Sci. 2023, 140(25), e53982. DOI: 10.1002/app.53982.
- Nakamura, K.; Sekiguchi, Y.; Shimamoto, K.; Houjou, K.; Akiyama, H.; Sato, C. Creep Crack Growth Behavior During Hot Water Immersion of an Epoxy Adhesive Using a Spring-Loaded Double Cantilever Beam Test Method. Mater. 2023, 16(2), 607. DOI: 10.3390/ma16020607.
- Houjou, K.; Sekiguchi, Y.; Shimamoto, K.; Akiyama, H.; Sato, C. Energy Release Rate and Crack Propagation Rate Behaviour of Moisture-Deteriorated Epoxy Adhesives Through the Double Cantilever Beam Method. J. Adhes. 2023, 99(6), 1016–1030. DOI: 10.1080/00218464.2022.2074295.
- Shimamoto, K.; Batorova, S.; Houjou, K.; Akiyama, H.; Sato, C. Degradation of Epoxy Adhesive Containing Dicyandiamide and Carboxyl-Terminated Butadiene Acrylonitrile Rubber Due to Water with Open-Faced Specimens. J. Adhes. 2021, 97(15), 1388–1403. DOI: 10.1080/00218464.2020.1772061.
- Shimamoto, K.; Akiyama, H. Estimating the Mechanical Residual Strength from IR Spectra Using Machine Learning for Degraded Adhesives. J. Adhes. 2022, 98(15), 2423–2445. DOI: 10.1080/00218464.2021.1978293.
- Houjou, K.; Shimamoto, K.; Akiyama, H.; Sato, C. Experimental Investigations on the Effect of a Wide Range of Strain Rates on Mechanical Properties of Epoxy Adhesives, and Prediction of Creep and Impact Strengths. J. Adhes. 2022, 98(5), 449–463. DOI: 10.1080/00218464.2020.1840368.
- Zanni-Deffarges, M. P.; Shanahan, M. E. R. Diffusion of Water into an Epoxy Adhesive: Comparison Between Bulk Behaviour and Adhesive Joints. Int. J. Adhes. Adhes. 1995, 15(3), 137–142. DOI: 10.1016/0143-7496(95)91624-F.
- Cognard, J. Y.; Créac’hcadec, R.; Sohier, L.; Davies, P. Analysis of the Nonlinear Behavior of Adhesives in Bonded Assemblies–Comparison of TAST and Arcan Tests. Int. J. Adhes. Adhes. 2008, 28(8), 393–404. DOI: 10.1016/j.ijadhadh.2008.04.006.
- Spaggiari, A.; Castagnetti, D.; Dragoni, E. Experimental Tests on Tubular Bonded Butt Specimens: Effect of Relief Grooves on Tensile Strength of the Adhesive. J. Adhes. 2012, 88(4–6), 499–512. DOI: 10.1080/00218464.2012.660831.
- Créac’hcadec, R.; Sohier, L.; Cellard, C.; Gineste, B. A Stress Concentration-Free Bonded Arcan Tensile Compression Shear Test Specimen for the Evaluation of Adhesive Mechanical Response. Int. J. Adhes. Adhes. 2015, 61, 81–92. DOI: 10.1016/j.ijadhadh.2015.05.003.
- Hodge, B. M.; Milligan, M. Wind Power Forecasting Error Distributions Over Multiple Timescales. 2011 IEEE Power and Energy Society General Meeting, Michigan, IEEE, 2011. pp. 1–8.
- Bakouch, H. S.; Al-Zahrani, B. M.; Al-Shomrani, A. A.; Marchi, V. A. A.; Louzada, F. An Extended Lindley Distribution. J. Korean Statis. Soc. 2012, 41(1), 75–85. DOI: 10.1016/j.jkss.2011.06.002.
- Ford, H. L.; Ravelo, A. C.; Polissar, P. J. Reduced El Niño–Southern Oscillation During the Last Glacial Maximum. Science. 2015, 347(6219), 255–258. DOI: 10.1126/science.1258437.
- Krithikadatta, J. Normal Distribution. J Conserv Dent. 2014, 17(1), 96–97. DOI: 10.4103/0972-0707.124171.
- Lyles, R. H.; Kupper, L. L. On Strategies for Comparing Occupational Exposure Data to Limits. Amer. Indus. Hygiene Associat. J. 1996, 57(1), 6–15. DOI: 10.1080/15428119691015430.
- Koch, A. L. The Logarithm in Biology 1. Mechanisms Generating the Log-Normal Distribution Exactly. J. Theoret. Biol. 1966, 12(2), 276–290. DOI: 10.1016/0022-5193(66)90119-6.
- Rinne, H. The Weibull Distribution: A Handbook; Florida: CRC Press, 2008.
- Husak, G. J.; Michaelsen, J.; Funk, C. Use of the Gamma Distribution to Represent Monthly Rainfall in Africa for Drought Monitoring Applications. Int. J. Climatol. 2007, 27(7), 935–944. DOI: 10.1002/joc.1441.
- Cochran, W. G. The χ2 Test of Goodness of Fit. Ann. Math. Statist. 1952, 23(3), 315–345. https://www.jstor.org/stable/2236678.
- Ahlgren, P.; Jarneving, B.; Rousseau, R. Requirements for a Cocitation Similarity Measure, with Special Reference to Pearson’s Correlation Coefficient. J. Ameri. Soc. Informat. Sci. Technol. 2003, 54(6), 550–560. DOI: 10.1002/asi.10242.
- Magee, L. R2 Measures Based on Wald and Likelihood Ratio Joint Significance Tests. The Amer. Statis. 1990, 44(3), 250–253. DOI: 10.1080/00031305.1990.10475731.