
Abstract
In this study 12 acacia and 12 linden honey samples from the Czech Republic were analyzed with a chemometric and volatile compound profiles approach. The results of electrical conductivity (17.4 and 65.1 mS/m), free acidity (12.5 and 24.5 meq/kg), diastase activity (12.6 and 18.8 DN), colour (21.5 and 47.8 mm Pfund), hydroxymethylfurfural (HMF) (11.5 and 3.5 mg/kg), fructose (45.1 and 36.3 g/100g), fructose + glucose (F + G) (76.7 and 69.3 g/100g) content and fructose/glucose ratio (1.4 and 1.1) showed statistically significant differences (p < 0.05) between acacia and linden honey, respectively. The physico-chemical properties and pollen profiles were in compliance with the description of European monofloral honey, except for acacia honey due to the low proportion of acacia pollen (2.8 − 10.3%). According to volatile compounds analysis by head-space solid phase micro-extraction coupled with gas chromatography − mass spectrometry (HS-SPME/GC-MS), nine key volatile substances were selected from more than 100 volatile compounds present in the analysed samples for evaluation as markers of botanical origin typical of the most common plant nectar sources in the Czech Republic. Further, the non-targeted analysis combined with Principal Component Analysis (PCA) revealed trends and outliers within all chromatography data obtained for 24 honey samples. Cis-linalool oxide and β-linalool have been confirmed as markers of acacia honey, while carvacrol and p-cymenene were found almost exclusively in linden honey. The results demonstrated that the chemometrics with the non-targeted and targeted volatile compounds analysis approach is reliable and accurate for the classification of honey of various botanical origins.
Introduction
Honey is a natural sweetener widely used in the world for its flavour, as well as, nutritional value and medical properties. It exhibits antioxidant, antibacterial, and anti-inflammatory activities due to containing a variety of nutrients and bioactive substances such as sugars, organic acids, proteins, amino acids, vitamins, minerals, flavonoids, phenolic acids, and enzymes (Osés et al., Citation2016; Wang et al., Citation2019). Among the variety of honey, acacia (robinia) and linden (tilia) honey are two of the most valuable and popular types of honey in Central Europe (Bartáková et al., Citation2007; Přidal & Vorlová, Citation2002). Linden or Basswood honey is produced by bees from the flowers of a small-leaved lime (Tilia mordata Mill.), and a large-leaved lime (Tilia platyphyllos Scop). Acacia honey is produced during the flowering of a black locust (Robinia pseudoacacia L.), also known as “false acacia”, “white acacia” or “white linden tree”. Monofloral types of honey or honey from specific geographical locations are more valuable because of their flavour and safety reasons (Wang et al., Citation2019). Thus, the establishment of methods and parameters to determine and discriminate botanical and geographical origin is highly important.
The botanical or geographical origin of honey can be ascertained by its physico-chemical composition, organoleptic characteristics, chromatographic techniques for possible markers determination (sugars, phenols, or volatiles), and melissopalynology analysis (Mădaş et al., Citation2019; Pospiech et al., Citation2021; Truzzi et al., Citation2014). The pollen analysis reveals the geographical origin of honey based on the vegetation type from which the nectar has been collected by the bees and the relative frequencies of the pollen types that reflects the botanical origin (Ruoff et al., Citation2006). Physico-chemical analysis typically accompanies pollen analysis to complement the monflorality decision (Mădaş et al., Citation2019; Pospiech et al., Citation2021; Truzzi et al., Citation2014). Characteristic features of acacia honey (low conductivity, low free acidity, light colour, fluid) and linden honey (one of the highest conductivities in floral honeys) in comparison with the European and Italian honeys were summarized in Table S1.
Honey aroma comes from volatile compounds regarded as the identified specific markers for each honey, which is one of the distinguishable characteristics of honey collected from different flowers (Castro-Vázquez et al., Citation2014; Chen et al., Citation2017; Ruoff & Bogdanov, Citation2004). Recently, the analysis of volatile compounds by head-space solid phase micro-extraction (SPME) has been carried out in many studies as an effective method to assess the quality and to identify specific compounds that belong to sunflower, thyme, citrus, fir, pine, rape, acacia and lime honey (Alissandrakis et al., Citation2007; Baroni et al., Citation2006; Kružík et al., Citation2019; Plutowska et al., Citation2011). Linalool oxide (Mădaş et al., Citation2019; Plutowska et al., Citation2011; Radovic et al., Citation2001; Špánik et al., Citation2013), heptanal (Radovic et al., Citation2001), 3-methyl-3-buten-1-ol, decanal (Kadar et al., Citation2010; Mădaş et al., Citation2019), 5-ethenyldihydro-5-furanone, benzemethanol (Mădaş et al., Citation2019), 1-methylpyrrolidinone, 2,4-decadienal, 2-hexen-1-ol, 3,4-dimethylhexan-3-ol, 3-ethylheptan-3-ol, heptan-3-one and dihydrolinalool (Špánik et al., Citation2013) were referred to as the marker volatile compounds of acacia honey. 4-tert-butylphenol, estragol, methyl(1-methylethenyl)benzene, menthol, carvacrol, 8-p-menthen-1,2-diol, thymol (Plutowska et al., Citation2011), 4-methylacetophenone (Plutowska et al., Citation2011; Radovic et al., Citation2001), 2 methylfuran, methyl isopropyl benzene, 3-cyclohexen-1-ol-5-methylene-6-isopropylene and bicyclo-3,2,1-octane-2,3 bis (methylene) (Radovic et al., Citation2001), were considered as the unique components of linden honey. The volatile compounds of acacia and linden honey from Europe are summarized in Table S2. The conclusions of these studies partially differ from each other. It can be seen that the results vary depending both on the geographical origin of the honey samples and the isolation technique and chromatographic conditions used. In addition, there are limited studies on Czech acacia and linden honey.
The aim of this study was to characterize and comprehensively assess the quality of Czech acacia and linden honey by means of both the method of production and its origin. The analysis included their physico-chemical properties, pollen content, and the profile of volatile compounds to determine the characteristic compounds.
Materials and methods
Honey samples
In this study, 24 honey samples including 12 acacia and 12 linden honey samples were analyzed. In which, 6 acacia and 9 linden samples were from the 2019 harvest season. The rest were harvested in 2020. All samples were purchased from beekeepers from the Czech Republic. The originally planned testing of a larger set of monofloral honeys was not carried out because it was not possible to collect these two types of honey in the required floral purity during the 2019–2020 seasons. Samples were stored at 20 °C in a dark room (in glass bottles) until analysis. Each sample was analysed in duplicate and mean values were reported.
Methods of analysis
Melissopalynological analysis
Qualitative and quantitative melissopalynological analysis was performed using the method described by (Von Der Ohe et al., Citation2004). For each sample of honey, at least 500 pollen grains were counted and identified. For each type of pollen, the absolute number of pollen grains (PG/10g × 10³) and their percentage (%) were determined. The samples were analysed under the BAM 2006 microscope (Maneko, Czech Republic). Pollen grains were observed at a total magnification of 600×.
Physico-chemical analysis
Physico-chemical parameters were analysed following the Harmonised Methods of the International Honey Commission (Bogdanov, Citation2002). Water content was measured using a digital refractometer (RM 40, Mettler-Toledo, Grainfensee, Switzerland). Electrical conductivity was determined by the conductometric method (Multi 9310 IDS Conductivity meter, electrode IDS Tetra Con 925, WTW GmbH, Weilheim, Germany). Free acidity was determined by alkalimetric titration to pH 8.3 (Automatic titrator T5, electrode DGi115-SC, Mettler-Toledo, Greifensee, Switzerland). Determination of HMF was performed by HPLC with UV detection (Agilent Technologies 1290 Series, 1290 Infinity Diode Array Detector, Santa Clara, CA, USA). Diastase activity (diastase number) was determined spectrophotometrically using the Phadebas method (Phadebas Honey Diastase Test, Phadebas AB, Kristianstad, Sweden). Carbohydrate analysis (glucose, fructose) was performed using an HPLC system with RI detector (Agilent Technologies 1260, RID Detector, Santa Clara, CA, USA). Colour was measured colorimetrically according to study by Castro et al., Citation1992 using Pfund scale (HI 96785, Hanna Instruments, Woonsocket, RI, USA).
GC-MS analysis
Preparation of standards for chromatographic analysis
A stock solution of 3 internal standards (IS; benzophenone, 2-methyl-3-heptanone and 6-undecanone) in methanol was prepared with a final concentration of 0.01 g/l for each standard. In addition, a stock mixed-standards solution of 12 standards was prepared: 3 IS, benzaldehyde, 2-phenylethylalcohol, linalool, 2-phenylacetaldehyde, p-cymenene, nonanoic acid and carvacrol in methanol with a final concentration of 0.01 g/l for each standard except linalool oxide (0.1 g/l) and 3-methylbutanenitrile (1 g/l) in methanol. 20 µl of the stock mixed-standards solution was added into 4 ml of distilled water into a 10 ml vial. The commercially available n-alcane standards, 0.2 µl (C5-C8) and 1 µl (C8–C20) were separately added directly into empty 10 ml vials without any modification.
Honey samples preparation for chromatographic analysis
30 g of honey was mixed with 10 ml of distilled water in a plastic sample container with a lid (dilution factor 3:4). Subsequently, 4 ml of this honey solution was pipetted into a 10 ml vial and 20 µl of 3 IS stock solution was added.
HS-SPME-GC/MS
The method for the determination of volatile compounds was modified based on the conditions published in the literature (Alissandrakis et al., Citation2007). GC/MS analysis was performed using an Agilent Technologies 7890 A gas chromatograph connected to an Agilent Technologies 5975 C mass detector. An HP-5MS capillary column, 30 m x 0.25 mm ID, film thickness 0.25 µm, was used. The temperature gradient started at 40 °C (3 min), followed by a temperature increase at a rate of 3 °C/min to 160 °C (0 min) and a further temperature increase at a rate of 10 °C/min to 250 °C. The injector temperature (Ultra Inert Straight SPME Liner, Agilent) was 220 °C. Helium 4.8 with a flow rate of 0.7 ml/min was used as the carrier gas. Electron ionization with ionization energy of 70 eV, with an ion source temperature of 230 °C and a quadrupole analyser of 290 °C, with a measuring mass range m/z 50–550 was used for MS.
The HS-SPME method (DVB/CAR/PDMS, 50/30 μm; Supelco) was used to isolate analytes from the samples under the following conditions: pre-incubation 20 min, extraction 40 min at 60 °C and stirring speed 250 rpm. In the injection chamber (inlet), analytes were desorbed at 220 °C for 3 min and injected in a 1:1 split mode, which ensured good sensitivity and acceptable peak shape throughout the chromatogram.
The chromatograms were evaluated using HP Chemstation software (Agilent Technologies) and processed both by targeted and non-targeted analysis:
targeted analysis: nine selected compounds declared as botanical source indicators which are typical for the most common plant species in the Czech Republic were identified by comparing the spectra with the NIST library of mass spectra (NIST 14) and by retention indices (RI) and quantified by peak areas (full scan; RTE integrator)
non-targeted analysis: peak absolute areas without corrections were obtained using the function and filters of the RTE GC Chemstation Integrator. Subsequently, data selection and consolidation were performed using the DataSORT application, which works on the principle of clustering. DataSORT processed data from unmodified txt files obtained from HP Chemstation software by clustering method which enables sorting of the data according to retention time (Tr, min) with an accuracy of 4 decimal places and with peak area limited to 50,000. The result of this process was the creation of a data table, where individual samples are characterized by two variables (retention time, absolute area), whereas retention time of the individual features/volatile compounds was limited to the frequency of occurrence higher than 50%. In this way, the original number of variables (338) was optimized to 75. Finally, the identification and quantification of compounds of interest was carried out the same way as for targeted analysis.
Statistical analysis
Physico-chemical analyses were performed in triplicate, data being expressed as mean ± standard deviation. Differences between means were determined using one-way ANOVA test (Statgraphics Technologies, Inc., USA). p-values < 0.05 were considered statistically significant. Principal component analysis (Statistica 12.0, StatSoft, Tulsa, Oklahoma, USA) was used to investigate whether the profile of volatiles would allow discrimination of the botanical origin of the types of honey.
Results
Pollen profile
The melissopalynological results showed significant differences between acacia and linden honey, the percentage of specific pollen ranging from 2.8 to 10.3% (mean of 6.3 ± 2.7%) and from 5.9 to 31.1% (mean of 16.0 ± 8.0%), respectively ().
Table 1. Quantitative and qualitative pollen analysis of acacia and linden honey.
Physico-chemical analysed
The physico-chemical analysis results which are the key parameters to evaluation acacia and linden honey are described in . All honey samples in this study were shown to be fresh and of good quality, because the water content, HMF and diastase (diastase number; DN) values were in accordance with European Honey Directive (Citation2001) (Bogdanov, Citation2002).
Table 2. The physico-chemical parameters of acacia and linden honeys.
The moisture content of all samples was below 20% which is the maximum limit (Bogdanov et al., Citation2004). Similarly, the HMF content in all samples was found to be lower than the allowed limit of 40 mg/kg. HMF content is a freshness indicator of honey because at high temperature or poor storage conditions, sugar will be converted into HMF leading to increased accumulation of HMF in the sample (Boussaid et al., Citation2018; Isla et al., Citation2011). Significant differences (p < 0.01) in the HMF content between acacia and linden honey have been observed. HMF content of acacia was 11.49 ± 7.76 mg/kg and much higher than that of linden honey (less than 5 mg/kg). Moreover, the diastase activity values were 18.80 ± 4.95 and 12.64 ± 4.16 DN for linden and acacia honey, respectively.
The average acid content of acacia honey was 12.53 ± 2.93 meq/kg while of linden honey was 24.47 ± 10.87 meq/kg. In addition, there was a statistically significant difference (p < 0.05) in mm Pfund means between acacia and linden honey. According to the Pfund scale, linden honey has extra light amber colour with an average value (47.8 mm) higher than that of the acacia samples (21.5 mm) considered a white colour.
Remarkable contrasts in electrical conductivity between acacia and linden honey are given in Figure S1. Within the samples, the lowest electrical conductivity of 12.1 mS/m was observed for acacia sample A09 and the highest electrical conductivity of 79.8 mS/m for linden sample L10. Generally, the mean electrical conductivity value (p < 0.05) of linden honey was 65.1 ± 13.2 mS/m and almost 4 times higher than that of acacia honey (17.4 ± 4.0 mS/m).
Sugars are the main components of any type of honey as the extremely important value to determine and authenticate the botanical origin of the honey samples (Isla et al., Citation2011). The presentation of the amount and ratio of glucose and fructose in acacia and linden honey is illustrated in . The fructose content was significantly different between the two types of honey while the glucose content of linden honey was not statically higher than that of acacia honey. The sum of reducing sugar content in the acacia samples was 76.72 ± 4.24 g/100g and higher than that of linden honey with an average of 69.33 ± 6.24 g/100g. In addition, the average of F/G of acacia was much higher than that of linden honey (1.44 ± 0.15 and 1.11 ± 0.08, respectively).
Volatile compounds analysis
More than 100 volatile compounds were presented in the analysed samples. When tentatively comparing the composition of both groups, it was found that linden honey had a qualitatively and quantitatively richer profile of volatile compounds compared to acacia; nevertheless, benzaldehyde was the most abundant compound in both groups.
Firstly, nine key volatile substances were selected based on previous research of authors (Grégrová et al., Citation2021) and evaluated by targeted analysis as markers of botanical origin typical for the most common plant nectar sources in the Czech Republic. With regard to the matrix effect and without the use of isotopically labelled standards, the quantification (determined concentration in mg/kg) of selected volatile substances would be subjected to high uncertainty. For this reason, an approach comparing the areas of the individual peak areas with each other was chosen to interpret the results shown in ; the stated conclusions are therefore primarily valid for the set isolation and chromatographic conditions. 3-methylbutannitril presented a very low concentration in acacia honey and was not found in linden honey. Benzaldehyde was the principal volatile component detected by head-space analysis and there were no significant differences of 2-phenylacetaldehyde and 2-phenylethyl alcohol in these two types of honey. Our analysis showed the concentration of carvacrol in linden honey about 4.4 time higher than in acacia. Besides the isomers of carvacrol and thymol, a significantly (p < 0.05) higher concentration of p-cymenene was observed in linden honey. Contrary to that, cis-linalool oxide and β-linalool were almost exclusively represented only in acacia honey.
Table 3. Content of 9 selected volatile compounds in acacia and linden honey.
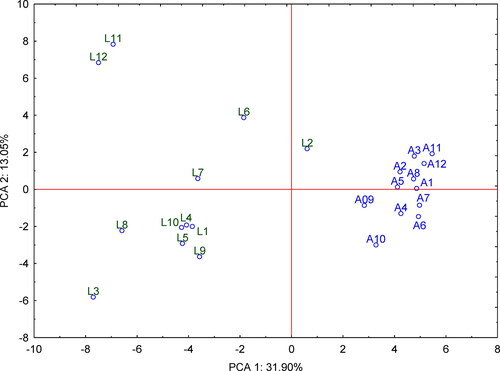
Principle component analysis (PCA) was used to get an overview, revealing trends and groups of data obtained by non-targeted analysis for 24 honey samples (areas of 75 features/volatile compounds) from two different botanical groups. The first and second main components (PCA 1 and PCA 2), as shown on the PCA score plot (), represent 44.95% of the total data variability. The proximity of the samples on the score plot indicates similar behaviour in terms of volatile profiles. The first main component clearly divides samples of linden and acacia honey. The acacia honey corresponds to the right side (positive values of PCA 1) and linden honey to the left (negative values of PCA 1). Both groups of honey have positive and negative values of the second main component (PCA 2).
In the group of linden honey, which was more diverse than the acacia group, the samples L11, L12 and L2 were the most different (). Samples L11 and L12 were characterised (compared to other linden honeys) by increased areas of these compounds: furfural (RI = 819; Peak area = 1.1 × 10⁶); 1,3,8-p-menthatriene (1021; 1.1 × 10⁷); β-damascenone (1391; 7.0 × 10⁶); trans-3(10)-caren-2-ol (1004; 1.1 × 10⁷) and α-terpinen-7-al (1301; 1.4 × 10⁷). In contrast, the sample L2 was characterised by an atypically high content of benzaldehyde (960; 2.6 × 10⁷) and γ-terpinene (1059; 5.5 × 10⁶).
Figure 1. PCA score plot of linden honey (L, green) and acacia honey (A, blue).
On PCA loading plot (Figure S2) it is possible to observe volatile compounds (represented by retention times) that contribute to the distribution of both groups of samples. The group of linden honey is most significantly distinguished by these variables: trans-3(10)-caren-2-ol (Tr = 16.657 min; RI = 1004); o-cymene (Tr = 17.413 min; RI = 1021); γ-terpinene (Tr = 19.150 min; RI = 1059); p-cymenene (Tr = 20.802 min; RI = 1087) and carvacrol (Tr = 30.768 min; RI = 1294). In contrast, the acacia honey group had high content of nonane (Tr = 11.272 min; RI = 887), cis-linalool oxide (Tr = 19.796 min; RI = 1084) and β-linalool (Tr = 21.294 min; RI = 1096). These compounds had 5-20× higher areas in acacia honey than in linden honey.
Discussion
The acacia pollen representation in acacia honey (6.3 ± 2.7%) was found to be lower than expected. Although Robinia pseudoacacia trees are generally considered as a poor source of pollen, the average percentage of the Robinia pseudoacacia pollen in a comprehensive European study was 28% (Persano Oddo & Piro, Citation2004) and 13% in the Czech honey (Pospiech et al., Citation2021), the proportion of acacia pollen grains ranged from 22 to 68% in Northwest Croatia, 11 − 70% in East Croatia and 33 − 71% in Istria (Uršulin-Trstenjak et al., Citation2017). Similar to Robinia pseudoacacia, the low pollen producing capacity of lime trees, the percentage of Tilia pollen is low (Persano Oddo & Piro, Citation2004). In previous studies, the lime pollen content ranged from 5 to 23% in French lime honey and 13 − 39% in Czech honey (Guyot et al., Citation1998; Pospiech et al., Citation2021). The nectar and honey composition are mainly effected by the diversity in pollen-producing capacity of plants, and geographic aspects (climate, soil acidity or other pedologic conditions) (Persano Oddo et al., Citation1995). Therefore, a set of tested lime honey with specific pollen representation of 16.0 ± 8.0% can be considered as monofloral. In the case of acacia honey, these are not pure monofloral types of honey although beekeepers declared in this way as their pollen grains do not reach the usual proportion of acacia pollen grains and do not approach the minimum level required by the German standard (Beckh & Camps, Citation2009).
The water content, HMF and diastase activity (DN) are easily affected by storage and handling conditions (Isla et al., Citation2011; Pospiech et al., Citation2021). In our results, there was a significant difference between acacia and linden honey. However, HMF content is used as an indicator of freshness or evidence of overheating and cannot be used for the determination of botanical origin because it is not an intrinsic property of honey (Ouradi et al., Citation2021). Our results conforms to the previous studies on acacia and linden honey in some European countries such as Romania, France, Germany, and Italy where the temperate climate is one of the factors affecting the water content of honey (Mădaş et al., Citation2019; Persano Oddo & Piro, Citation2004; Truzzi et al., Citation2014).
The enzyme activity of honey decreases after storage and heating so this parameter can only be used for the classification of monofloral honey if fresh honey is examined (Bogdanov et al., Citation2004). The lower diastase activity in acacia honey compared to other types of honey were reported in the studies of Bartáková et al. (Citation2007). The results on diastase activity in this study are in a similar range as those of honey from other studies (Bartáková et al., Citation2007; Pospiech et al., Citation2021).
Acidity affects the flavour and aroma of honey due to the presence of organic acids, particularly gluconic, pyruvic, malic and citric, in the equilibrium with lactones or esters and inorganic ions (Isla et al., Citation2011). Free acidity depends on its botanical origin: acacia samples showed the lowest free acidity compared with sunflower and linden honey (Truzzi et al., Citation2014). Similar results were also recorded in publications of Persano Oddo and Piro (Citation2004). For two samples (L1 and L6) the measured concentration exceeded 40 meq/kg (data not shown), which could indicate the beginning of unwanted fermentation.
Electrical conductivity is one of the important physico-chemical characteristics for the authentication of monofloral honey (Mateo & Bosch-Reig, Citation1998). It is correlated to the mineral content, organic acids, proteins and polyols and is a stable range of variability which nearly remains constants during treatment or storage for the same type of honey (Oroian, Citation2012). Similar values of this parameter were reported ranging from 12 to 35 mS/m in acacia honey and from 48 to 73 mS/m in linden honey (Oroian et al., Citation2015; Popescu et al., Citation2016). Tilia tree is a very good source of nectar, but also provide honeydew (produced by an attacking insect Eucallipterus tiliae), which result in the electrical conductivity values quite high for a nectar honey. The same conclusion was also mentioned in some studies (Albu et al., Citation2021; European Honey Directive, Citation2001). The value of electrical conductivity can be successfully used for the basic distinction between acacia and linden honeys. It is a cheap and fast classification tool.
Honey pigmentation is variable ranging from white to a light tint of amber. Thus, its colour seems to be a suitable parameter for the classification of monofloral honeys (Bogdanov et al., Citation2004). Mineral content, light exposure and many organic compounds in honey such as phenolic and flavonoids were reported as related to pigmentation (Khalil et al., Citation2012; Moniruzzaman et al., Citation2013). Our results are consistent with the study of Albu et al. (Citation2021). The different colour shades are also recognized between linden and acacia honey which the higher value belongs to linden honey (Albu et al., Citation2021).
In previous studies, the glucose and fructose values of acacia and linden honey in some European countries such as Italy, Romania, France, Germany showed consistent results such as roughly equal glucose content and higher fructose content for acacia (Mădaş et al., Citation2019; Persano Oddo & Piro, Citation2004). The mixture of sugars in honey is composed mainly of glucose and fructose, which together account for not less than 60 g/100 g for blossom honey and not below 45 g/100 g for honeydew honey and blends of honeydew with blossom honey (European Honey Directive, Citation2001). The sum of reducing sugar content in the acacia samples was 76.72 ± 4.24 g/100g and higher than that of linden honey with an average of 69.33 ± 6.24 g/100g. In addition, the F/G ratio is used as an indicator of the crystallization rate. These parameters can also be used for honey classification purposes (Pospiech et al., Citation2021). The average of F/G of acacia and linden honey were larger than 1.0 indicating a smaller tendency to crystallize. According to Pospiech et al. (Citation2021), in comparison to European honey, the F/G ratio of acacia honey was higher and slightly lower for lime honey (Pospiech et al., Citation2021). Generally, previous results in Table S1 and our data showing differences between acacia and linden honey were also established for these parameters.
Based on the PCA plots, the possibility of discrimination between two floral sources could be achieved using HS-SPME/GC-MS. All mentioned volatile compounds (trans-3(10)-caren-2-ol, o-cymene, γ-terpinene, p-cymenene and carvacrol) are described in the literature as characteristic/unique for linden honeys (Table S2) (Kadar et al., Citation2010; Mădaş et al., Citation2019; Plutowska et al., Citation2011; Radovic et al., Citation2001). Obtained results also confirm the correct selection of compounds for targeted analysis; p-cymenene and carvacrol can be considered as easily quantified compounds for the differentiation of linden honey. Contrary to that, in the relatively poor chromatogram of acacia honey, the presence of cis-linalool oxide and β-linalool excludes the presence of linden honey in accordance with the literature (Juan-Borrás et al., Citation2014; Radovic et al., Citation2001).
Conclusions
The physico-chemical properties and pollen profile of linden and acacia honey from the Czech Republic showed that all honey samples respect the characteristics required by the European Directives, although minor differences of acacia honey were demonstrated, due to which these are not considered pure monofloral honey. The pollen profiles and physico-chemical parameters such as electrical conductivity, free acidity, diastase activity, colour, and fructose content can provide enough information to allow the distinction of the two types of honey. The rapid and the cheapest classification can be made based on differences in electrical conductivity (17.4 vs 65.1 mS/m). However, the targeted and non-targeted analyses of the volatile fraction were found to be complementary methods applicable to indicate the differences in linden and acacia honey according to specific markers and their contents. The volatile compounds are directly interlinked with the unique and appreciable organoleptic properties such as flavour and aroma of unifloral honey and may to some extent replace necessary sensory analysis. Cis-linalool oxide and β-linalool were considered as markers of acacia honey (they had a higher concentration in acacia honey than in linden honey), while carvacrol and p-cymenene were determined as markers of linden honey and can be used for distinguishing these two types of honeys. Although other studies suggest general applicability of cis-linalool oxide, β-linalool, carvacrol and p-cymenene for classification (Grégrová et al., Citation2021; Kadar et al., Citation2010; Mădaş et al., Citation2019; Plutowska et al., Citation2011; Radovic et al., Citation2001), it would be appropriate to confirm this experimentally, because these compounds can be detected also in other monofloral and polyfloral honeys. The combination of volatile compounds profiles determined by HS-SPME-GC/MS and chemometrics is a promising method for the characterization, classification and discrimination of honey samples of different botanical origins.
Supplementary Material
Download MS Word (209.8 KB)Disclosure statement
The authors declare no conflict of interest.
Additional information
Funding
References
- Albu, A., Radu-Rusu, C.-G., Pop, I. M., Frunza, G., & Nacu, G. (2021). Quality assessment of raw honey issued from eastern Romania. Agriculture, 11(3), 247. https://doi.org/10.3390/agriculture11030247
- Alissandrakis, E., Tarantilis, P. A., Harizanis, P. C., & Polissiou, M. (2007). Comparison of the volatile composition in thyme honeys from several origins in Greece. Journal of Agricultural and Food Chemistry, 55(20), 8152–8157. https://doi.org/10.1021/jf071442y
- Baroni, M. V., Nores, M. L., Díaz, M. d P., Chiabrando, G. A., Fassano, J. P., Costa, C., & Wunderlin, D. A. (2006). Determination of volatile organic compound patterns characteristic of five unifloral honey by solid-phase microextraction − gas chromatography − mass spectrometry coupled to chemometrics. Journal of Agricultural and Food Chemistry, 54(19), 7235–7241. https://doi.org/10.1021/jf061080e
- Bartáková, K., Vorlová, L., Titěra, D., & Lutzová, M. (2007). Physicochemical parameters and botanical origin of Czech honeys. Journal of Food and Nutrition Research, 46(4), 167–173.
- Beckh, G., & Camps, G. (2009). Neue spezifikationen für trachthonige. Deutsche Lebensmittel-Rundschau, 105(2), 105–110.
- Bogdanov, S. (2002). Harmonised methods of the International Honey Commission. Swiss Bee Research Centre, FAM, Liebefeld.
- Bogdanov, S., Ruoff, K., & Persano Oddo, L. (2004). Physico-chemical methods for the characterisation of unifloral honeys: A review. Apidologie, 35(Suppl 1), S4–S17. https://doi.org/10.1051/apido:2004047
- Boussaid, A., Chouaibi, M., Rezig, L., Hellal, R., Donsì, F., Ferrari, G., & Hamdi, S. (2018). Physicochemical and bioactive properties of six honey samples from various floral origins from Tunisia. Arabian Journal of Chemistry, 11(2), 265–274. https://doi.org/10.1016/j.arabjc.2014.08.011
- Castro, R. M., Escamilla, M. J., & Reig, F. B. (1992). Evaluation of the color of some Spanish unifloral honey types as a characterization parameter. Journal of AOAC INTERNATIONAL, 75(3), 537–542. https://doi.org/10.1093/jaoac/75.3.537
- Castro-Vázquez, L., Leon-Ruiz, V., Alañon, M. E., Pérez-Coello, M. S., & González-Porto, A. V. (2014). Floral origin markers for authenticating Lavandin honey (Lavandula angustifolia x latifolia). Discrimination from Lavender honey (Lavandula latifolia). Food Control, 37, 362–370. https://doi.org/10.1016/j.foodcont.2013.09.003
- Chen, H., Jin, L., Fan, C., & Wang, W. (2017). Non‐targeted volatile profiles for the classification of the botanical origin of Chinese honey by solid‐phase microextraction and gas chromatography–mass spectrometry combined with chemometrics. Journal of Separation Science, 40(22), 4377–4384. https://doi.org/10.1002/jssc.201700733
- European Honey Directive. (2001). Council directive 2001/110/EC of 20 December 2001 relating to honey. Official Journal of European Communities, L10/47–L10/52.
- Grégrová, A., Kružík, V., Nguyen, T. Q. N., Pospiech, M., Javůrková, Z., Titěra, D., & Čížková, H. (2021). Vybrané těkavé markery českých řepkových a lipových medů. Chemické Listy, 115, 524−529.
- Guyot, C., Bouseta, A., Scheirman, V., & Collin, S. (1998). Floral origin markers of chestnut and lime tree honeys. Journal of Agricultural and Food Chemistry, 46(2), 625–633. https://doi.org/10.1021/jf970510l
- Isla, M. I., Craig, A., Ordoñez, R., Zampini, C., Sayago, J., Bedascarrasbure, E., Alvarez, A., Salomón, V., & Maldonado, L. (2011). Physico chemical and bioactive properties of honeys from Northwestern Argentina. LWT - Food Science and Technology, 44(9), 1922–1930. https://doi.org/10.1016/j.lwt.2011.04.003
- Juan-Borrás, M., Domenech, E., Hellebrandova, M., & Escriche, I. (2014). Effect of country origin on physicochemical, sugar and volatile composition of acacia, sunflower and tilia honeys. Food Research International, 60, 86–94. https://doi.org/10.1016/j.foodres.2013.11.045
- Kadar, M., Juan-Borrás, M., Hellebrandova, M., Doménech, E., & Escriche, I. (2010). Volatile fraction composition of acacia (Robinia pseudoacacia) honey from Romania, Spain and Check Republic. Bulletin of University of Agricultural Sciences and Veterinary Medicine Cluj-Napoca. Agriculture, 67(2), 259–265. https://doi.org/10.15835/buasvmcn-agr:5081
- Khalil, I., Moniruzzaman, M., Boukraâ, L., Benhanifia, M., Islam, A., Islam, N., Sulaiman, S. A., & Gan, S. H. (2012). Physicochemical and antioxidant properties of Algerian honey. Molecules (Basel, Switzerland), 17(9), 11199–11215. https://doi.org/10.3390/molecules170911199
- Kružík, V., Grégrová, A., Ziková, A., & Čížková, H. (2019). Rape honey: Determination of botanical origin based on volatile compound profiles. Journal of Food and Nutrition Research, 58(4), 339–348.
- Mădaş, N. M., Mărghitaş, L. A., Dezmirean, D. S., Bonta, V., Bobiş, O., Fauconnier, M.-L., Francis, F., Haubruge, E., & Nguyen, K. B. (2019). Volatile profile and physico-chemical analysis of acacia honey for geographical origin and nutritional value determination. Foods, 8(10), 445. https://doi.org/10.3390/foods8100445
- Mateo, R., & Bosch-Reig, F. (1998). Classification of Spanish unifloral honeys by discriminant analysis of electrical conductivity, color, water content, sugars, and pH. Journal of Agricultural and Food Chemistry, 46(2), 393–400. https://doi.org/10.1021/jf970574w
- Moniruzzaman, M., Sulaiman, S. A., Azlan, S. A. M., & Gan, S. H. (2013). Two-year variations of phenolics, flavonoids and antioxidant contents in acacia honey. Molecules (Basel, Switzerland), 18(12), 14694–14710. https://doi.org/10.3390/molecules181214694
- Oroian, M. (2012). Physicochemical and rheological properties of Romanian honeys. Food Biophysics, 7(4), 296–307. https://doi.org/10.1007/s11483-012-9268-x
- Oroian, M., Sonia, S., Amariei, A., Leahu, A., & Gutt, G. (2015). Multi-element composition of honey as a suitable tool for its authenticity analysis. Polish Journal of Food and Nutrition Sciences, 65(2), 93–100. https://doi.org/10.1515/pjfns-2015-0018
- Osés, S. M., Pascual-Maté, A., Fernández-Muiño, M. A., López-Díaz, T. M., & Sancho, M. T. (2016). Bioactive properties of honey with propolis. Food Chemistry, 196, 1215–1223. https://doi.org/10.1016/j.foodchem.2015.10.050
- Ouradi, H., Hanine, H., Fauconnier, M.-L., Kenne, T., Rizki, H., Ennahli, S., & Hssaini, L. (2021). Determination of physico-biochemical proprieties and composition in volatile constituents by solid phase micro-extraction of honey samples from different botanical and geographical origins in Morocco. Journal of Apicultural Research, 60(1), 84–98. https://doi.org/10.1080/00218839.2020.1718339
- Persano Oddo, L., Piazza, M. G., Sabatini, A. G., & Accorti, M. (1995). Characterization of unifloral honeys. Apidologie, 26(6), 453–465. https://doi.org/10.1051/apido:19950602
- Persano Oddo, L., & Piro, R. (2004). Main European unifloral honeys: Descriptive sheets. Apidologie, 35(Suppl. 1), S38–S81. https://doi.org/10.1051/apido:2004049
- Plutowska, B., Chmiel, T., Dymerski, T., & Wardencki, W. (2011). A headspace solid-phase microextraction method development and its application in the determination of volatiles in honeys by gas chromatography. Food Chemistry, 126(3), 1288–1298. https://doi.org/10.1016/j.foodchem.2010.11.079
- Popescu, R., Geana, E. I., Dinca, O. R., Sandru, C., Costinel, D., & Ionete, R. E. (2016). Characterization of the quality and floral origin of Romanian honey. Analytical Letters, 49(3), 411–422. https://doi.org/10.1080/00032719.2015.1057830
- Pospiech, M., Javůrková, Z., Hrabec, P., Čížková, H., Titěra, D., Štarha, P., Ljasovská, S., Kružík, V., Podskalská, T., Bednář, J., Burešová, P. K., & Tremlová, B. (2021). Physico-chemical and melissopalynological characterization of Czech honey. Applied Sciences, 11(11), 4989. https://doi.org/10.3390/app11114989
- Přidal, A., & Vorlová, L. (2002). Honey and its physical parameters. Czech Journal of Animal Science, 47(10), 439–444.
- Radovic, B. S., Careri, M., Mangia, A., Musci, M., Gerboles, M., & Anklam, E. (2001). Contribution of dynamic headspace GC–MS analysis of aroma compounds to authenticity testing of honey. Food Chemistry, 72(4), 511–520. https://doi.org/10.1016/S0308-8146(00)00263-6
- Ruoff, K., & Bogdanov, S. (2004). Authenticity of honey and other bee products. Apiacta, 38, 317–327.
- Ruoff, K., Luginbühl, W., Künzli, R., Iglesias, M. T., Bogdanov, S., Bosset, J. O., von der Ohe, K., von der Ohe, W., & Amado, R. (2006). Authentication of the botanical and geographical origin of honey by mid-infrared spectroscopy. Journal of Agricultural and Food Chemistry, 54(18), 6873–6880. https://doi.org/10.1021/jf060838r
- Špánik, I., Janáčová, A., Šusterová, Z., Jakubík, T., Jánošková, N., Novák, P., & Chlebo, R. (2013). Characterisation of VOC composition of Slovak monofloral honeys by GC × GC-TOF-MS. Chemical Papers, 67(2), 127–134. https://doi.org/10.2478/s11696-012-0254-z
- Truzzi, C., Illuminati, S., Annibaldi, A., Finale, C., Rossetti, M., & Scarponi, G. (2014). Physicochemical properties of honey from Marche, central Italy: Classification of unifloral and multifloral honeys by multivariate analysis. Natural Product Communications, 9(11), 1595–1602. https://doi.org/10.1177/1934578X1400901117
- Uršulin-Trstenjak, N., Puntarić, D., Levanić, D., Gvozdić, V., Pavlek, Ž., Puntarić, A., Puntarić, E., Puntarić, I., Vidosavljević, D., Lasić, D., & Vidosavljević, M. (2017). Pollen, physicochemical, and mineral analysis of Croatian acacia honey samples: Applicability for identification of botanical and geographical origin. Journal of Food Quality, 2017, 1–11. https://doi.org/10.55/2017/8538693
- Von Der Ohe, W., Persano Oddo, L., Piana, M. L., Morlot, M., & Martin, P. (2004). Harmonized methods of melissopalynology. Apidologie, 35(Suppl. 1), S18–S25. https://doi.org/10.1051/apido:2004050
- Wang, X., Rogers, K. M., Li, Y., Yang, S., Chen, L., & Zhou, J. (2019). Untargeted and targeted discrimination of honey collected by Apis cerana and Apis mellifera based on volatiles using HS-GC-IMS and HS-SPME-GC–MS. Journal of Agricultural and Food Chemistry, 67(43), 12144–12152. https://doi.org/10.1021/acs.jafc.9b04438