
Abstract
The empirical properties of a multidimensional poverty index require robust assessment. However, poverty research is yet to systematically implement measurement theories and practices that have been proven to be successful in other fields. Measurement theory has been developed over more than 100 years to produce indexes that are scientific (falsifiable) in that researchers put under scrutiny whether their value judgements and assumptions result in scales that have high internal consistency (reliability) and capture the phenomenon they aim to measure (validity). The paper uses the Multidimensional Poverty Index for Latin America (MPI-LA) to illustrate the importance of adopting sound measurement practices. The MPI-LA aims to be an improvement over the widely applied Unsatisfied Basic Needs (UBN) approach. However, its empirical development was based on ad hoc non-standard methods and principles, making the conclusions of the developer’s analyses unfalsifiable and prone to confirmation bias. This analysis includes six countries and two time periods. The findings suggest that the MPI-LA is an unreliable measure of poverty and that the pre-specified dimensional structure is invalid. The paper illustrates how standard principles like reliability and validity can be used to inform the discussion about the statistical properties of a given poverty index.
1. Introduction
Poverty has a range of different meanings; such as inadequate material living conditions, social position, and economic circumstances, and so forth (Spicker, Alvarez, & Gordon, Citation2006). Many of these definitions agree that poverty is a multidimensional concept. Poverty can be defined as the lack of command of resources over time and deprivation is its consequence (Gordon, Citation2006; Townsend, Citation1979). This is a multidimensional definition of poverty in that ‘individuals, families and groups in the population can be said to be in poverty when they lack the resources [cash income, capital assets, value of employment benefits in kind, public social services and private income in kind] to obtain the types of diet, participate in the activities and have the living conditions and amenities which are customary, or are at least widely encouraged or approved, in the societies to which they belong’ (Townsend, Citation1979). In his seminal paper on the meaning of poverty, Townsend (Citation2010, p. 98) argued that ‘We must remember that to some extent the concept of “poverty” is independent of that of income’ and highlighted the importance of the distribution of non-monetary resources in poverty measurement.
The main goal in poverty measurement is to produce a measure that is both theoretically and methodologically sound so that it can be used to inform policies (Gordon, Citation2000; Sen, Citation1976; Townsend, Citation1979). There is, nonetheless, a lack of consensus about the best way to measure multidimensional poverty and there are many different proposals (Boltvinik, Citation1998): Unsatisfied Basic Needs (UBN) (Beccaria & Minujín, Citation1985; Boltvinik, Citation1992); variants of the UBN such as the global Multidimensional Poverty Index (MPI) (Alkire & Santos, Citation2010) that draw on an axiomatic approach (Alkire et al., Citation2015; Sen, Citation1976); relative and consensual deprivation (Guio, Gordon, Najera, & Pomati, Citation2017; Mack & Lansley, Citation1985; Nandy & Pomati, Citation2015; Townsend, Citation1979).
All these poverty measures are based upon different concepts and definitions of poverty, different assumptions with respect the type and number of indicators, the thresholds used to identify deprivation, the number and type of dimensions, and the weights (World Bank, Citation2017). Therefore, it is vital to know the extent to which the empirical data is consistent with all these assumptions. The World Bank Commission on Global Poverty has put forward a series of principles and recommendations to improve the measurement of poverty (World Bank, Citation2017). Principle four in this report recommends that the indicators should be sufficiently robust and statistically validated. This principle demands a scientific framework with theory of measurement with sound statistical counterpart to empirically examine the assumptions of a scale.
Measurement theory (that is Classical Test Theory and the latent variable framework) is one strong candidate for the validation of poverty measures (Bartholomew, Citation1987; Cudeck & MacCallum, Citation2012; Kvalheim, Citation2012; Thorndike & Hagen, Citation1969). Although poverty research is increasingly incorporating scientific measurement theory methods to assess the properties of multidimensional poverty measures (Guio, Gordon, & Marlier, Citation2012; Guio et al., Citation2017; Moisio, Citation2004; Nandy & Pomati, Citation2015; Whelan & Maitre, Citation2006); the reality is that the scientific status of poverty measurement is still inferior relative to the principles routinely implemented in other fields like education, psychology, biology, chemistry or medical sciences (Brennan, Citation2006; Buchanan & Finch, Citation2005; Kvalheim, Citation2012; Raykov & Marcoulides, Citation2011). These principles come from measurement theory, which has a history of consistent development over the past hundred years, and which aims to statistically assess if the indicators included in a measure are internally consistent such that they lead to a systematic ranking and identification of the population in question (reliability); whether the indicators adequately capture the construct in question (criterion validity); whether the number and types of dimensions are a good model to classify the indicators (construct validity); whether the index and its indicators are comparable across sub-populations (Measurement Invariance) (see Section 3, for a definition of these concepts).
Some of the perils of an idiosyncratic selection of methods, without clear links to a theory of measurement, are that researchers work with assumptions that are not clearly falsified, the consequences of using invalid and unreliable indicators may be obscured and there is an increased risk of confirmation biases. An example of the negative consequences of lacking a sound empirical framework can be found in the history and current status of the measurement of poverty in Latin America. For many years, this region was at the forefront in poverty measurement when the UBN approach was utilised to produce one of the first multidimensional poverty measures (Altimir, Citation1979; Boltvinik, Citation2014; Katzman, Citation2000). Many indexes have been based on the UBN framework, with considerable variations in number of dimensions, indicators, thresholds, weights and aggregation methods and it is rather unclear which measure is better based on agreed empirical standards (Battiston, Cruces, Lopez-Calva, Lugo, & Santos, Citation2013; Beccaria & Minujín, Citation1985; Boltvinik, Citation2014). Recently, the Multidimensional Poverty Index for Latin America (MPI-LA), drawing on the UBN approach and on the family of measures proposed by Alkire and Foster (Citation2011), has been a step forward to produce an improved and comparable regional measure (Santos & Villatoro, Citation2016).
The MPI-LA aims to improve the measurement of poverty in the region by updating the thresholds of some indicators, adding new indicators and dimensions, formulating the index in terms of the AF method and including differential indicator weights. The MPI-LA thus makes a range of assumptions about the nature of multidimensional poverty in Latin America and this raises the question about the extent to which the MPI-LA is an improvement over previous indices. One novel feature of the MPI-LA, compared with previous measures in the region, is that includes an empirical component for its validation. However, this empirical evaluation is based upon non-standard criteria such as comprehensiveness, parsimony and robustness; concepts that do not often feature in the statistical (measurement) literature, and on an ad hoc selection of methods for the assessment of these concepts. These ad hoc validation methods make assumptions that are not clearly falsifiable, lack explicit statistical rejection rules and raises the question about the extent to which a different team of researchers would have reached the same conclusions and ended up with the same poverty index, after applying such methods.
This paper uses the case of the MPI-LA to illustrate the risks of using non-standard unfalsifiable measurement assumptions and idiosyncratic selection methods to develop a multidimensional poverty measure. The advantages of using standard measurement frameworks and methods are examined, adapted for the production of multidimensional poverty indexes. This article raises concerns about the validity and reliability of the MPI-LA.
The paper tests the following two hypotheses:
The MPI-LA is an internally consistent (reliable) measure of poverty.
The MPI-LA’s five-dimensional structure and its associated differential weighting adequately represent the structure of poverty in (six) Latin American countries.
The paper is organised as follows. Section 2 presents the main features of the MPI-LA- its indicators and dimensions. The paper discusses the selection, application and use of methods and concepts to develop the MPI-LA. Section 3 presents the key principles of measurement theory that are relevant to poverty research with an emphasis on the concepts of reliability and validity. Section 4 assesses the reliability of the MPI-LA index using both Classical Test Theory (CTT) and Item Response Theory (IRT). Section 4 also examines the structure of the MPI-LA to determine if it is a ‘good’ model of poverty in six LA countries: Argentina, Bolivia, Brazil, Chile, Mexico and Uruguay. Section 5 concludes the article.
2. Background, description and questions about the MPI-LA
The pioneering Unsatisfied Basic Needs (UBN) put Latin American research at the forefront of multidimensional poverty measurement and has been at the core of poverty measurement in the region since the late 1970s (Beccaria & Minujín, Citation1985; Boltvinik, Citation1992, p. 19; INDEC, Citation1984; Kast & Molina, Citation1975). The UBN relies on indicators about access to public services and housing conditions, which are available in household surveys (Boltvinik, Citation2014). The appeal of the UBN rests on its clear links with human needs and, more recently with human rights. Many recent UBN measures include more indicators and dimensions than the original variant, drawing upon more comprehensive theories of human needs or on human rights frameworks (Dean, Citation2010; Doyal & Gough, Citation1991).
The MPI-LA follows the UBN tradition but extends the number of indicators and dimensions and uses the Alike-Foster (AF) aggregation method (Alkire & Foster, Citation2011). The MPI-LA – constrained by available comparable data – uses a hybrid approach that draws on both a sub-set of human rights described in international agreements and discursive derivations of functionings derived from Sen’s capability theory (Santos & Villatoro, Citation2016; Sen, Citation1999). The MPI-LA introduces the following six changes compared with the traditional UBN approach:
New indicators: Social protection, employment, adult education attainment, attendance schooling gap and housing tenure.
Dichotomising income (using the ECLACFootnote1 income poverty line) and includes this as a binary variable.
Specifies a five-dimensional structure to measure poverty.
Uses less severe thresholds than usual for several UBN indicators for example Housing materials, overcrowding, access to water and sanitation.
Introduces differential weighting for each indicator and dimension.
Uses a weighted (intermediate) intersection approach to identify the poor (based on the AF aggregation method)
presents the full list of indicators used to compute the MPI-LA and the differential weighting procedure applied to indicator and each dimension. Santos and Villatoro (Citation2016) provide no explicit definition of poverty, instead they draw upon international human rights agreements and an adaptation of the capability approach, but they do not define what they mean by ‘poverty’. However, they argue that the MPI-LA includes the constituent elements of poverty. However, this claim is not backed up by a review of past or current theories and definitions of poverty. Thus, the MPI-LA appears to lack an explicit theory or definition of poverty and the questionable nature of some of its indicators and their associated thresholds underlines the need for empirical scrutiny. The following issues are of concern:
Dimensions: A distinctive feature of the MPI-LA is the assumption that poverty in Latin America has five dimensions. This is a critical aspect of the MPI-LA model which specifies the number and types of dimensions of poverty and constrains weighting of each indicator within and across dimensions.
Housing tenure: The indicator of housing tenure seems to rest on a hypothesis that the poor are more likely to suffer from tenure insecurity compared with their richer peers. However, it is unclear whether this assumption is correct as many poor households in Latin America are able to build and own their own homes, therefore insecure tenure might not be a strong manifestation of poverty. Santos and Villatoro (Citation2016) acknowledge that the current tenure measures are not ideal, but they nevertheless retained this indicator in their poverty measure.
Education achievement: Santos and Villatoro (Citation2016) argue that the school achievement indicator has clear ties with the human rights framework and with national legislations and therefore should be included in a poverty measure. However, the threshold values they use are arguably too low as in many countries basic education is public and mandatory. This may not a major problem in that the indicator will be too severe and will overlap with others. The question is whether setting a higher threshold (for example completion of secondary education) would make for a better education deprivation indicator.
Schooling gap: Santos and Villatoro (Citation2016) acknowledge that this is an imperfect measure, but they retained the indicator based on the assumption that it has potential capacity to identify a substantive aspect of education deprivation. However, it is debatable if an education gap should be part of a poverty measure or if it is a measure of exclusion. Furthermore, being two years behind at school for your age is a crude measure of education deprivation which could be due to many different causes (for example ill health, learning disability, and so forth) and thus this indicator may be subject to bias and measurement error if used to identify the poor.
Water and sanitation: International norms from the World Health Organisation (WHO) and UNICEF were used to define the threshold values for the water and sanitation indicators. The WHO and UNICEF changed the definition of unimproved drinking water to include ‘bottled water’ as it was seen as expensive for the poor. However, in many countries, bottled water is mainly used by middle class and rich households which leads to these households being classified as having unimproved water and therefore this might result in the misclassification of ‘rich’ households as water deprived. The MPI-LA uses different thresholds for urban and rural households for water and sanitation and thus fails to comply with the WHO/UNICEF standards.
Employment: Drawing upon the International Labour Organisation social protection floor agreement, the MPI-LA includes a dimension on employment and access to some forms of social protection. The links between employment, social security and poverty are well investigated, however it is quite clear that they are predictors and not outcomes of poverty (Lohmann & Marx, Citation2018). Furthermore, unemployment is a poor indicator of a precarious position in the economic landscape in Latin America. This weak connection is likely to have negative impacts upon the measurement of poverty as in some Latin American countries an unemployed person is likely to have higher living standards than a person who is employed in the informal labour market. From an international perspective, the EU 2020 poverty and social exclusion indicator uses an indicator of quasi-joblessness. However, the academic literature has shown the negative consequences that this indicator has upon the reliable identification of the poor (de Graaf-Zijl & Nolan, Citation2011; Nolan & Whelan, Citation2011). Social protection and economic participation may be good dimension for a social exclusion index, however their inclusion in a poverty index may violate the poverty focus axiom (for example that the measure adequately distinguishes the poor from the not poor).
Thresholds: the MPI-LA provides little theoretical or empirical justification for setting the threshold values for the house construction materials, housing tenancy and overcrowding.
Differential weights: The MPI-LA rests on the assumption that some indicators are more important measures of household living standards than others. Therefore, differential weighting is utilised to take these differences in importance into account when aggregating the indicators into a single index. There are different ways to apply weights when constructing welfare measure (Decancq & Lugo, Citation2013). However, Abdu and Delamonica (Citation2018) argue that the weighting structure of the global MPI not only adds unnecessary complexity to the measurement of poverty, it also results in a misleading classification of the poor relative to the not poor. Pasha (Citation2017) has shown the misleading effects of the (equal) weighting scheme of the global MPI upon the ordering of countries and argued that equal weighting of the dimensions cannot be statistically justified. Recently, Nájera (Citation2018) showed that differential weighting does not greatly improve misclassification error rates if the indicators themselves are unreliable. The relationship between reliability and weighting is therefore discussed below.
Table 1. MPI-AL: dimensions, deprivation indicators and weights
2.1. Idiosyncratic empirical examination of the MPI-LA
Santos and Villatoro (Citation2016) use two approaches to underpin and assess the robustness of their index. First, the MPI-LA uses the AF method of aggregation, which draws on Sen’s (Citation1976) axiomatic approach to poverty measurement where the aim is to impose a series of mathematical properties to make the behaviour of an index predictable (Alkire & Foster, Citation2011). The AF method fulfils many of the most desirable axioms such as symmetry, replication invariance, scale invariance, poverty focus, deprivation focus, dimensional monotonicity, among others (Alkire et al., Citation2015). However, a critical aspect, and often overlooked, is that the AF is a formula that tells researchers how to aggregate poverty data but not what data you should use to measure poverty. Alkire and Foster (Citation2011) provide a general description of how to select indicators, set thresholds, weights and dimensions. The effect of all these decisions upon the fulfilment of the axioms is not tractable in practice and the replication of the index in question is compromised as many of the decisions are left to the user.
The consequence of lacking a methodology based on scientific principles in the AF framework is that primacy is often given to value judgements in selecting poverty indicators which then rely on post hoc checks to assess the stability of the resulting poverty index. For evaluating the MPI-LA, Santos and Villatoro (Citation2016) make use of the following concepts to assess the properties of their scale: Comprehensiveness, Parsimony/Redundancy and Robustness. They define each concept (see below) and propose a method to examine the extent to which they are met. However, one of the main drawbacks of this strategy is that these concepts are not part of any standard scientific measurement framework. This limitation has several negative implications for the statistical scrutiny conducted by Santos and Villatoro (Citation2016) given that the degrees of freedom of the researchers increase and confirmation biases are more likely to happen.
Comprehensiveness means that ‘[T]he index should capture poverty in the region, including, as much as possible, the deprivations that are widely recognized as constituent elements of poverty.’ (p. 65, Santos & Villatoro, Citation2016). They propose using Exploratory Factor Analysis (EFA) to assess this principle. There are two main reasons why this is an inadequate approach. First, EFA is an exploratory technique to investigate which indicators correlate (load) with a series of unidentified latent dimensions. Thus, the use of EFA is incompatible with the fact that Santos and Villatoro (Citation2016) put forward and keep a five-dimensional model, irrespective of the EFA results. Since this five-dimensional model has been specified a priori, this is a clear case where Confirmatory Factor Analysis is more appropriate than Exploratory Factor Analysis (EFA) (Brown, Citation2006). Furthermore, a CFA can be used to test the validity of the a priori five-dimensional MPI-LA structure, whereas EFA cannot be used to do this.
The second problem is how the results from the EFA analysis are used to inform the selection of the indicators. The EFA results suggest a radically different structure of two dimensions with very low amounts of explained variance. Most of the indicators load into one dimension (that accounts by for about 55 per cent of the total variation) and the total explained variance of the second dimension is just above 10 per cent. Furthermore, the indicators of the dimension of employment and social protection have unacceptably low loadings, but these dimensions and indicators are retained regardless of these empirical results. It is unclear how the results from the EFA analyses where used to inform or improve the measure- the MPI-LA should have had two rather than five dimensions.
Parsimony/redundancy refers to the capacity of capturing poverty without unnecessary complexities or double counting. Santos and Villatoro (Citation2016) use Cramer’s V as a measure of parsimony, which is a correlation coefficient (measure of association) for nominal variables. Dropping unnecessary items is a good practice; however, in standard measurement theory, there are other concerns, for example, whether the items result into a reliable measure and can be aggregated together to provide an account of an underlying phenomenon (see below). More importantly, it is unclear how Cramer’s V can be used as a test of the ability of the indicators capture poverty in a parsimonious way that is the null hypothesis is unclear. This is an example of how researcher’s degrees of freedom could lead to confirmation biases. For example, the indicators with negative correlations are not dropped from the MPI-LA, which is a more serious problem than overlapping. These correlations could mean that these data lead to a violation of monotonicity, that is overall poverty would increase after a reduction in achievements. But this is not discussed by the authors.
Robustness, unlike the other two concepts, is a standard concept used in the AF framework. In many applications, robustness is a procedure that involves assessing whether a hypothesis holds under alternative specifications of the same model. Unfortunately, as Santos and Villatoro (Citation2016) do not provide a hypothesis, there are no standards by which to judge the application of their robustness analyses. Rather than checking robustness Santos and Villatoro (Citation2016) appear to have undertaken a sensitivity analysis to compare how the identification of the poor is sensitive to changes in the weightings. However, they impose a marginal variation to their weights. The baseline weight is 7.4 and their variation ranges between 6.67 and 7.69 for most indicators (3.7–10 for health). For monetary resources, the weights vary between 7.69 and 14.8. The amount of change they get in poverty is more or less proportional to the degree of variability imposed in the weights. The percentage of inconsistently poor ranges between (5% and 20%). If a relative measure is used instead, the percentage of inconsistently poor relative to baseline poverty the percentage ranges from 6 per cent to 80 per cent. For example, in Colombia in 2012, the baseline measure reports 35 per cent poor and 13 per cent were found to be inconsistently poor. This is far from an ideal result and this raises the question about whether the weights result in a significant difference in the composition of the poor. The authors do not provide any clear-cut tests for their sensitivity analysis. However, it is known from statistical theory that if a measure is valid and reliable, a measure is self-weighted and the misclassification error is low (Nájera, Citation2018).
It is clear from this reflection that the concepts and methods used for the examination of the MPI-LA are not very helpful for drawing clear conclusions about the empirical properties of this poverty measure. This underlines the need to use standard statistical practices, concepts and methods that have proven to be useful across the natural and social sciences for dealing with similar measurement problems.
3. Methods: a framework to empirically assess a poverty measure
This paper relies on measurement theory to assess whether the MPI-LA is: a) a reliable measure of poverty in Latin America and b) a valid dimensional representation of poverty in the region. The origins of measurement theory can be traced back to Spearman (Citation1904) and it has undergone continuous development ever since with the discussion and refinements of the key concepts and methods (Bartholomew, Citation1987; Cudeck & MacCallum, Citation2012; Kvalheim, Citation2012; Streiner, Norman, & Cairney, Citation2015; Thorndike & Hagen, Citation1969).
In measurement theory, the presumption is that observed indicators are manifestation of an underlying phenomenon and therefore should be associated in some way (Spearman, Citation1904). In poverty research, this implies that the observed deprivations have a structure and are part of a higher-order construct (poverty). From a measurement perspective, multidimensionality means that the observed measures form clusters (dimensions) that in turn measure the higher-order construct, that is the indicators measure material or social deprivation which are dimensions of overall poverty.
Measurement theory grew from its concern with developing indexes capable of: a) capturing the essence of a concept (that is validity) and b) consistently replicating the observed scores in the context of measurement error (that is reliability) (Brennan, Citation2006). These two concerns had wide-ranging implications for further theoretical and statistical developments and the implications of violating validity and reliability are well known and can be subject to empirical testing (Brennan, Citation2006; Streiner et al., Citation2015).
The consequences of lacking a robust measure have been demonstrated in different disciplines where invalid and unreliable measures systematically lead to the incorrect results (Allen & Yen, Citation2001; Brennan, Citation2006; Streiner et al., Citation2015). In poverty research, drawing upon Townsend’s theory of relative deprivation and upon the principles of measurement Guio et al. (Citation2012), Guio et al. (Citation2016), (Citation2017) have adapted the key concepts for use in poverty measurement and propose the following criteria to determine if a poverty measure is robust.
Suitability: Each item in an index should have face validity, i.e. it should be considered to be a suitable measure of poverty in the relevant society.
Validity: This concept is concerned with the extent to which a set of indicators measures the concept they intend to measure that is poverty. There are several different kinds of validity (Streiner et al., Citation2015). Criterion validity holds when the set of indicators in a scale are correlated with a priori known outcomes and/or causes of poverty like poor health, low income and debt (inability to keep up with bills), and so forth Construct validity (dimensionality and structure) holds when an index adequately measures poverty that is it measures the phenomenon it is meant to measure and not something else (Cronbach, Citation1951).
Reliability: is the internal consistency and repeatability of the poverty index that is how closely related the set of UBN items are as a group. Classical Test Theory (CTT) defines reliability in terms of the correlation between the ‘true’ score and the observable score, which are influenced by a range of other factors collectively known as random ‘error’ (that is un-reliability). In CTT reliability is the proportion of the observed variance attributable to the non-error true score (Brennan, Citation2006). The CTT approach has been modified with the development of modern measurement theory (Latent Variable Approach). Reliability is concerned with how well an empirical measure (that is the UBN index based on observed data) measures one common concept (Revelle, Citation1979; William; Revelle & Zinbarg, Citation2009). That is, how much information observed deprivations contain with respect to the underlying phenomenon causing them, that is poverty. Item Response Theory (IRT) is based on more powerful statistical methods than CTT, but it makes more assumptions (Hambleton & Jodoin, Citation2003; Harris, Citation1989). IRT provides useful additional information about each item in a UBN deprivation measure, that is how well each component in the UBN index discriminates between the poor and the not-poor and the likely overall severity of poverty suffered by people who lack each item. A consequence of reliability is that the indicators would rank the population accordingly from the worse-off to the better-off (Nájera, Citation2018).
Additivity: is a check that a person/household suffering from two UBN deprivations is worse off than people suffering from one or no UBN deprivations that is that the poverty index adds up.
Measurement Invariance: When measurement invariance holds it indicates that the index measures poverty in an equivalent manner across social and demographic groups and/or countries. Measurement Invariance therefore also assesses whether an index can be decomposed without leading to incorrect conclusion about the levels of poverty between two or more groups.
Measurement theory provides an established and unified framework to assess any multidimensional measure and provides a way to choose the best poverty measure from among the n possible indexes. The standard methods to assess the reliability and construct validity are presented and discussed below (for the other methods and concepts see Guio et al. (Citation2017)).
3.1. Reliability methods
There are several agreed and well-known statistics to assess reliability and this paper relies on both classical test theory (CCT) and item response theory (IRT), which provide different tests of the overall and item-specific reliability of the MPI-LA. Several statistics have been proposed within CTT to assess the internal consistency of an index (Revelle & Zinbarg, Citation2009; Zinbarg, Revelle, Yovel, & Li, Citation2005). This paper uses the following three reliability statistics: Alpha, Beta and Omega (total). These three statistics range from 0 to 1 (the closer to one the more reliable the index is, see thresholds below) and show if a set of indicators results in an internally consistent index, that when aggregated leads to consistent measurement of the latent variable (that is poverty) and the correct classification of people/households across samples.
Omega (ω) total is the ‘greatest lower bound’, that is the upper end of the lowest reliability of an index with optimal weights (that is the empirically estimated strength of the relationship between each indicator and the latent variable).Footnote2 Omega is arguably the best measure of reliability regardless the multi or uni-dimensionality of a measure. From simulation studies of poverty data, it is known that ω > .8 is the minimum for consistent classification of cases in a sample (Nájera, Citation2018). Unlike ω, alpha assumes that each indicator measures the same latent construct on the same scale and with the same degree of precision (essentially tau equivalence model) if these assumptions are violated then alpha may underestimate the ‘true’ reliability of an index (Revelle & Zinbarg, Citation2009). Alpha values below 0.7 indicate unacceptably low reliability in social science research (Nunnally, Citation1978). Therefore, α is not as good a reliability measure as the ω statistic, research has shown that α < ω when tau equivalence is violated (Zinbarg et al., Citation2005).
Revelle (Citation1979) has argued that coefficient β can provide additional and complementary information about reliability. β estimates the worst possible split, that is what happens to reliability when considering the lowest possible correlation among the items of an index. When β < α it is an indicator of possible multidimensionality but when is too low (<.5) this is an indication of low internal consistency that is some of the individual indicators are unreliable and potentially do not measure the overall latent construct in question. β can be a conservative estimate of reliability and a lower bound of the percentage of the deprivation index that measures a single latent construct (for example UBN poverty).
One of the limitations of CTT is that it provides an assessment of the overall reliability of an index/measure, but provides limited information about the measurement properties of each individual indicator/component of the final index. Item Response Theory (IRT) conceptualises reliability in terms of the information that observed deprivations provide with respect to the underlying level of overall deprivation (Harris, Citation1989). Standard IRT models do not look at the relationship between a dimension and the indicators. IRT therefore is most suited for unidimensional measures. However, it is known from simulations that if the higher order factor (overall poverty) captures most of the variation of the indicators (that is weak dimensionality), an IRT model is a sensible approach (Gibbons, Immekus, Bock, & Gibbons, Citation2007). Our results () and the EFA of Santos and Villatoro (Citation2016) suggest that the MPI-LA has only limited or weak multidimensionality and so we should not expect to see a substantive degree of bias in the IRT result (see below).
In poverty research, IRT models permit assessment of reliability in terms of two parameters: severity and discrimination. Severity measures the relationship between the individual poverty indicator and how acute or mild the observed deprivation is in units of standard deviation from the average persons/households living standard (that is the average person/household has a score of zero). Discrimination shows how well the UBN item differentiates between the not deprived and the deprived. Both discrimination and severity assess whether an indicator has valuable information (that is is useful) for constructing an index. Guio et al. (Citation2016) define thresholds to decide whether an indicator is useful or not. Low discrimination (<.4 correlation) suggests that the item in question fails to adequately distinguish between the deprived and not deprived. This is an undesirable property given that low discrimination would increase the chances of identifying a person as ‘poor’ when they are not.
High severity values (>3 standard deviations from the average) are associated with very extreme manifestations of deprivation which cannot be measured accurately in most social surveys as their sample size is too small. Indicators with such extreme values are unlikely to provide valuable information about the poor given that they are measuring only the severest forms of deprivation.
3.2. Construct validity methods
In this paper, we are concerned with the concept of construct validity. The MPI-LA has been put forward as a multidimensional poverty measure comprising five separate dimensions. This means that the MPI-LA pre-specifies a grouping of the indicators into five dimensions, otherwise the indicators would have different weights and the aggregation would have resulted in a different measure. Measurement theory translates such a dimensional structure into testable statements, that is the measure has five dimensions, the indicators are correctly classified, and the weights are equal within dimensions as shown in (except for monetary resources).
Factor analysis was developed to study the possible grouping of observed variables into ‘n’ latent constructs (Brown, Citation2006; Cudeck & MacCallum, Citation2012). Factor analysis evolved from data-driven (Exploratory Factor Analysis) to model assessment approaches (Confirmatory Factor Analysis). CFA examines how well the observed data fit the pre-specified model, that is whether the presumed MPI-LA model is a valid representation of poverty in Latin America, given the available data. Therefore, a CFA is the most adequate method to assess whether the assumptions of the MPI-LA hold or not. Unlike EFA, CFA provides benchmarks to reject the hypothesis raised with respect to a certain model. Therefore, this paper uses a CFA model to assess the following hypotheses:
Is the five-dimensional structure of the MPI-LA a valid representation of poverty in the Region?
Are the component indicators of the MPI-LA adequately associated with the sub-dimensions they are meant to measure?
Are the MPI-LA weights correct?
The implementation of the CFA is as follows. First, a null unidimensional model (omission of the dimensions) was fitted to assess the case in which all the variation is captured by the higher-order factor (that is overall poverty). Second, a CFA with a five-dimensional model with the raw binary indicators and free loadings was fitted to the data. Third, the same five-dimensional CFA model was fitted but we tested how the fit of the model changes when each indicator is weighted in accordance with the MPI-LA weighting criteria. It is not possible to exactly replicate the full MPI-LA as CFA models require fixing some parameters to fit an identified model, that is a CFA model is ‘identified’ where the known information available implies that there is one best value for each parameter in the model whose value is not known (Brown, Citation2006). Nonetheless, this means that the reported statistics of fit that are used to validate or invalidate a model represent the most optimistic scenario for each hypothesis that is reality will be worse than the results presented here.
4. Results
This section presents the findings of the reliability analysis and the assessment of the presumed dimensional structure of the MPI-LA. First, it presents the findings using CTT followed by the results from the IRT analysis. Finally, the CFA findings are reported.
4.1. Reliability: classical test theory assessment
shows the values for three reliability coefficients α, β and ω. All three were estimated in R using Revelle’s ‘psych’ package (Revelle, Citation2018). The input data were the raw deprivation variables (0 = not deprived 1 = deprived) but using the MPI-LA differentially weighted variables would not have changed the results. α was also estimated in Stata to determine the sensitivity to the sampling weights, but they had little impact upon the reliability results. The reported omega (ω) is the highest possible reliability estimate using the MPI-LA data in that a CFA model with five-dimensions had a very poor fit. All three statistics provide a standardised (ranging from 0 to 1) estimate of the reliability of the MPI-LA, where the closer to 1 the higher the reliability, the minimum acceptable value for each statistic is α ≥ .7, β ≥ .5 and ω ≥ .8.
Table 2. Reliability: classical test theory analysis
shows that for both time periods for almost all six countries the α, β and ω results are low, indicating that the MPI-LA is an unreliable measure of poverty in each country (except for Mexico 2004). Another important finding from these estimates is that reliability decreases overtime as α, β and ω are higher for the first period relative to the second. This is an indication that perhaps the MPI-LA indicators that were adequate in the early 21st Century have become more unreliable overtime.
For both time periods in all six countries β is below 0.5 (except for Bolivia in 2003), indicating that the MPI-LA includes some highly unreliable items and that some of its dimensions have a weak relationship with the higher-order factor, poverty. These findings are of considerable concern as it means that changes in the MPI-LA over time may be a result of changes in poverty, but they may also be a result of measurement error that is it is not possible to interpret the change as having a substantive meaning. In addition, it means the MPI-LA results have only a weak correlation with the ‘true’ level of poverty, that is if several samples were taken for the same population, the ranking of the population as ‘poor’ and ‘not poor’ would show significant random fluctuations.
The analyses are limited in that they provide a summary of the reliability of the MPI-LA measure, but do not show which indicators have the greatest unreliability problems. Therefore, an item-reliability analysis was conducted to see specific problems.
4.2. Item response theory analysis
The two-parameter IRT model was fitted in Mplus 7.2 with Maximum Likelihood considering the complex design of the surveys (Muthén, Citation2013; Muthén & Muthén, Citation2012). The raw binary variables were utilised for the analysis (as in the case of the reliability statistics the results are not affected by differential weighting). The 2-parameter (severity and discrimination) IRT model for each country is reported in the series of plots shown in and (below) (see the coefficients in ). The series of curves (Item Characteristic Curves) shows how each indicator relates the latent construct, that is poverty. Whereas severity establishes the location of each curve along the x-axis, discrimination determines the slope of the plot, that is a steep slope indicates that the not deprived and the deprived have very different probabilities of being poor, which is a desirable result. Flat curves indicate low discrimination and curves located on the far right-hand side suggest that the indicator is associated with severer manifestations of poverty.
Figure 1. Item characteristic curves from the two-parameter IRT model. Selected countries.
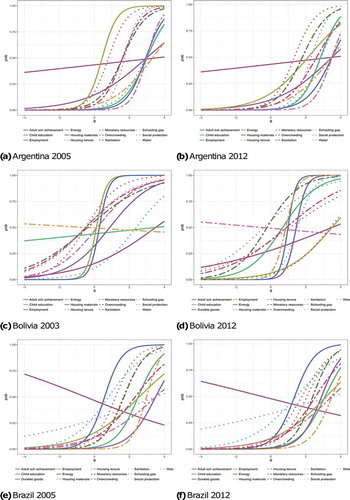
Figure 2. Item characteristic curves from the two-parameter IRT model. Selected countries.
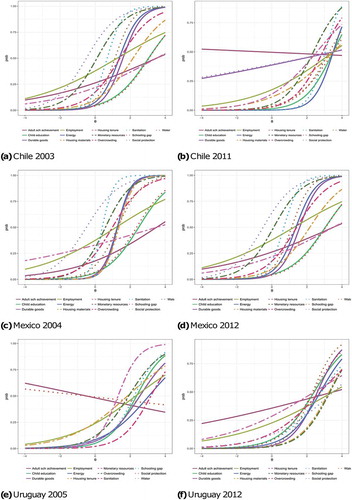
The plots suggest that Adult School Achievement, Employment and Housing tenure tends to have very flat curves and therefore do not adequately discriminate between the poor and not poor. The IRT models also show that many of the MPI- LA items are far too severe to be reliable measures of poverty in these Latin American countries. In particular, Years of education, Housing tenure, School Gap and Employment. These are some of the new indicators introduced by the MPI-LA and they are unreliable measures of poverty in these six Latin American countries.
The results from the two time points also suggest that the indicators have become more severe measures of UBN poverty during the twenty-first Century, and thus their reliability as UBN poverty measures is declining. The best example is Chile where MPI-LA seems particularly inadequate for the Chile 2011 data that is the UBN indicators used simply fail to adequately measure poverty. However, this phenomenon is observed across all six countries. The adjustments introduced by the MPI-LA do not have the expected effect upon the measurement of less severe forms of deprivation. The new indicators do little to measure moderate deprivation and do not improve the reliability of the measurement of poverty for these six countries.
4.3. Construct validity analysis. Confirmatory factor analysis
shows the structure of the MPI-LA where the 13 indicators are classified into 5 dimensions (housing, basic services, living standard, education and employment and social protection) and weights are applied accordingly. These dimensions in turn measure overall poverty. The MPI-LA assumes that the indicators contribute differentially to the measurement of poverty. This is done by assigning weights to each indicator and to each dimension, that is some indicators are considered to be more important than other indicators and so they are multiplied by larger weights, similarly four of the dimensions are considered to be equally important so they are given the same weight (22.2) but the employment and social protection dimension is considered to be only half as important as the other dimensions so it is given half the weight (11.1).
In order for the MPI-LA to be a useful measure of poverty, the five-dimensional structure needs to be reproduced by the data, that is if fewer or more dimensions are present then the indicators and weights would need to be re-specified otherwise poverty will not be measured accurately – the weights and the way in which poverty is aggregated would just introduce ‘noise’ to the measurement. The MPI-LA is a five-dimensional hierarchical model where the loadings of the dimensions have a fixed value.
tests three hypotheses. The first one is that the MPI-LA indicators result in a unidimensional characterisation of poverty in the region (baseline model in ). The second one is that the MPI-LA has a valid structure to measure poverty in Latin America and its weights are correct (fixed weights in ). The third is that the MPI-LA has a valid structure to measure poverty but that the a priori weights are unknown (MPI-LA with free item loadings in ). The second is a strict representation of the MPI-LA model and the third is less restrictive one.
Table 3. CFA analysis. MPI-LA with weights and free weights
presents the results of the baseline model (unidimensional) and of the two versions of the five-dimensional hierarchical factor model. In order for the models to be considered an adequate fit both the Comparative Fit Index (CFI) and Tucker Lewis index (TLI) should be above at least 0.90 and ideally higher – a good fit would be above 0.95 (Hu & Bentler, Citation1999). The Root Mean Square Error of Approximation (RMSEA) is included to assess the model fit in a different way that is RMSEA and CFI might not always point at the same direction (Lai & Green, Citation2016). The RMSEA should be less than 0.06.
All the models in show an inadequate fit using CFI and TLI that is the data do not adequately fit the five-dimensional structure imposed by the MPI-LA – the MPI-LA model is very likely to be ‘wrong’. However, the RMSEA for Argentina and Chile indicates a better fit. From Monte Carlo simulations it is known that this contradiction between fit statistics is usually a result of low correlations and insufficient degrees of freedom. This is reflected in the form of low factor loadings, missing cross-loadings and residual covariances (Lai & Green, Citation2016). It is likely that some indicators are part of a different dimension, this might be the case for the social protection dimension in Chile and Argentina. This would indicate that the dimensional model of the MPI-LA needs to be re-specified.
The results lead us to reject three hypotheses. The results also suggest that the indicators are more likely to load on to one dimension than on to five, that is very weak multidimensionality was found, this result is consistent with the EFA results of Santos and Villatoro (Citation2016). Whilst in theory, it could be the case that a five-dimensional model is correct, these results suggest that it is not correct when using the indicators used to measure the MPI-LA. The lack of reliable indicators is one of the key reasons affecting the poor fit of the MPI-LA. If more reliable indicators have been used, the fit of the MPI-LA might have been better – but currently, the MPI-LA does not adequately measure poverty in six large Latin American countries.
5. Conclusion and discussion
Poverty measurement involves making a series of assumptions with regard indicators, thresholds, dimensions and weights given the available survey data. Poverty indices, regardless the aggregation method used, are likely to suffer from confirmation biases and serious measurement problems if they have not been statistically validated. The World Bank Commission on Global Poverty has put forward a series of principles and recommendations to improve the measurement of poverty (Bank, W, Citation2017). Principle four recommends that the indicators should be sufficiently robust and statistically validated. This is a sensible recommendation that aligns poverty measurement with the measurement standards that have been systematically and routinely implemented in other areas such as psychometrics, medicine, education, biology, and so forth.
Progress has been made in poverty measurement by incorporating scientific measurement principles such as validity and reliability that come from measurement theory (Guio et al., Citation2012, Citation2017; Whelan & Maitre, Citation2006). Both are routinely used in other fields and increasingly referenced as minimum standards for academic publishing. However, in poverty research, there is no agreement about what framework and standards should be adopted. Both reliability and validity are unsystematically implemented, and researchers have often used unscientific frameworks based on ad hoc selection of principles and methods that deviate from measurement practices in other fields and that do not result in clear falsifiable statements about the assumptions used to produce a poverty measure.
This paper uses the case of the MPI-LA to illustrate several challenges, limitations and potential contributions of measurement theory and methods to some of the problems in contemporary poverty measurement: a) the risks of using unfalsifiable statements and an idiosyncratic selection of methods to examine a measure and b) the advantages of using scientific measurement theory in developing a poverty measure.
The Latin American region requires a multidimensional poverty measure which is valid, reliable and comparable. This updating needs to be based on a sound theory of poverty with a clear definition of poverty so that the thresholds, indicators, weights and dimensions are part of a coherent theory-driven framework. All this in a context of survey data that has barely changed over the last decades and was not designed explicitly to measure poverty. The MPI-LA aims to update the UBN and assumes that adding new dimensions, indicators, setting different thresholds and specifying differential weighting improves the UBN approach. Adding new indicators and dimensions as well as using different thresholds is clearly a sensible approach given that the changes in living standards in the region over the last few decades.
This paper examined the MPI-LA using standard measurement theory and methods which have been shown to be useful across both the natural and social sciences. The properties of the indicators of the MPI-LA were examined using both Classical Test Theory, Item Response Theory and Latent Variable Modelling. Two hypotheses were tested about the MPI-LA. The first is that the MPI-LA indicators are reliable measures of deprivation across six Latin American countries for two time periods. The second hypothesis is that the dimensional structure of the MPI-LA and its differential weighting result in an adequate measurement of the dimensions of poverty in Latin America.
The results indicated that the MPI-LA is an unreliable measure of poverty. Because the measure is not internally consistent and does not adequately capture the latent construct in question, the classification of the population into poor and not-poor groups will be unstable and inconsistent (Nájera, Citation2018). That is, in a parallel survey, the same population would have been ranked differently, that is poor as not poor and vice versa for a given poverty line. Given that reliability is a pre-condition for a stable poverty classification, small changes to the any of the contents of the measure (that is weights, thresholds, indicators, and so forth) are likely to result in significant changes in the identification of the poor.
The item-level analysis of reliability suggests that there are particularly severe reliability problems with the new MPI-LA indicators included to measure education, employment and housing tenure. Santos and Villatoro (Citation2016) acknowledge that some of these indicators are imperfect and this could be a potential source of error but decided to keep these indicators in the final measure even though their analyses suggested that these indicators were problematic. From a theoretical perspective, this is what would be expected given that unemployment is a cause not an outcome of poverty that is the MPI-LA mixes indicators of both cause and effect (Gordon, Citation2006; Townsend, Citation1979). Housing tenure may be a manifestation of poverty but it is very unreliable given the threshold values used in the MPI-LA and the categories of the nominal variable in the HIES data. It seems that insecure tenure as defined by the MPI-LA is not associated with being poor but with something else and therefore should not be used as a measure of deprivation in Latin America. Further discussions need to take place about how these results relate to violations of the poverty focus axiom and how such low factor loadings might violate strict monotonicity (that is low factor loadings indicate that the indicators are insensitive to changes in the latent variable).
The two-parameter IRT model suggests that there have been changes in the severity of MPI-LA deprivation indicators over time. This indicates that the UBN indicators in the MPI-LA are likely to be losing their measurement accuracy over time. These indicators are not adequately measuring the living standards of the poor given the improvements in living standards in Latin America. This means that while the severity of deprivation might be decreasing over time, poverty cannot be consistently measure using such indicators and threshold values. This has of course also occurred in other countries, for example, in the United Kingdom, overcrowding, outdoor sanitation and access to hot water were valid and reliable indicators of poverty in the early twentieth century but in the twenty-first century these indicators no longer adequately measure the living conditions of the poor population in the UK.
Poverty can be simply defined as the lack of command of sufficient resources over time and deprivation is a consequence of poverty (Gordon, Citation2006). Townsend (Citation1979) proposed how different types of resources resulted in deprivation in different aspects of life (dimensions). Therefore, it is not surprising to find measurement problems with indicators such as employment and the attendance schooling gap given that the MPI-LA confounds manifestations of poverty with predictors of poverty. Employment status can be better conceptualised as a predictor of the household’s levels of resources, but it is rarely a direct outcome of poverty in Latin America. Similarly, lagging behind in school might be a manifestation of a complex underlying phenomenon where poverty might or might not be the primary cause. Adult school achievement is both a cause and an effect of poverty during childhood. However, in the contexts of a household-level measure is an excellent proxy of the level of resources of a household but to treat it as a manifestation of poverty seems to add noise to the measurement. The MPI-LA could be improved if it was based upon an operationalisation of a clear definition of poverty and deprivation.
The MPI-LA uses a five-dimensional structure to measure poverty in the region. The second hypothesis was assessed using Confirmatory Factor Analysis (CFA). The results suggest that the five-dimensional structure of the MPI-LA and its differential weightings are not supported by the data. This means that the way in which indicators are aggregated results in an incorrect measurement of poverty, that is some indicators have a very weak relationship with latent poverty and the data does not back up the existence of such dimensions and that a unidimensional model fits better the data. This finding is not exclusive of this paper. Santos and Villatoro (Citation2016) found that the MPI-LA is fairly unidimensional, but they ignore this empirical finding and imposed a five-dimensional structure to their measure. The results suggest that the MPI-LA is very likely to be an inadequate measure of poverty for Latin America. These findings from the set of six countries included in this paper (which cover more than 80 per centof the total population in the region) are likely to also hold for many other countries. Perhaps the MPI-LA indicators are reliable for the poorest countries but the results for Bolivia suggest otherwise. This is likely to reflect the fact that the UBN was designed to capture poverty almost four decades ago, and even sensible changes to the indicators are not enough to produce a reliable and valid measure.
To conclude, the MPI-LA is an unreliable and invalid measure of poverty in Latin America. The results produced using the MPI-LA are highly likely to be both wrong and misleading. Thus, we recommend that the MPI-LA should not be used for policymaking or academic research purposes in Latin America unless its reliability and accuracy can be radically improved. The MPI-LA draws on the UBN approach and this opens up questions about whether in the twenty-first century, the UBN – with the current data – is capable of producing a valid and reliable poverty measure for the region. Should the available data prove to be inadequate, LA countries could look at a different approach that has been an empirical success such as the consensual deprivation method based on Townsend’s theory of relative deprivation (Guio et al., Citation2017; Mack & Lansley, Citation1985; Stewart, Citation2006; Townsend, Citation1979). One pending question is whether the MPI-LA is the best possible measure – upper bound reliability – given the current data and knowledge in poverty research.
The paper shows the advantages of using the scientific principles of measurement theory that have been developed over the past hundred years (validity and reliability) as a means to test and improve multidimensional poverty indexes (Guio et al., Citation2012). We agree with the World Bank Commission on Global Poverty that poverty measures should be subject to statistical testing and validation. However, there is no agreement about which measurement framework should be used for this purpose. This paper, drawing upon on some of the work that has used classical test theory and modern latent variable measurement framework, proposes using the principles and protocols that have been successful in other fields as they rely on falsifiable statements that constrain confirmation biases. The specific adequacy of some methods for poverty measure needs to be widely discussed as in multidimensional poverty measurement is still rare to have many indicators for one dimension and there is little agreement about the number and types of dimensions of poverty. Furthermore, researchers are constrained by the quality of available data and valid and reliable poverty measures require good data that is designed, ideally a priori, to measure poverty in all its dimensions (World Bank, Citation2017; Vollmer & Alkire, Citation2018), which should be based upon an explicit theory and definition of poverty. Otherwise, the lack of better data leads to a suboptimal situation of researchers looking for a feasible higher upper bound – the best possible measure – given the existent data, which might not guarantee a good poverty measure.
Disclosure statement
No potential conflict of interest was reported by the authors.
Additional information
Funding
Notes
1. The United Nations Economic Commission for Latin America and the Caribbean (ECLAC).
2. Ideally, omega should be calculated from a confirmatory model but the model for the MPI-LA estructure was so poor (see ) that we approximate omega using an exploratory approach.
Related Research Data
References
- Abdu, M., & Delamonica, E. (2018). Multidimensional child poverty: From complex weighting to simple representation. Social Indicators Research, 136(3), 881-905.
- Alkire, S., & Foster, J. (2011). Counting and multidimensional poverty measurement. Journal of Public Economics, 95(7), 476–487.
- Alkire, S., Roche, J. M., Ballon, P., Foster, J., Santos, M. E., & Seth, S. (2015). Multidimensional poverty measurement and analysis. Oxford: Oxford University Press.
- Alkire, S., & Santos, M. (2010). Acute multidimensional poverty: A new index for developing countries (OPHI Working Paper No. 38). Oxford: University of Oxford.
- Allen, M. J., & Yen, W. M. (2001). Introduction to measurement theory. Long Grove, IL: Waveland Press.
- Altimir, O. (1979). La dimensión de la pobreza en América Latina. Santiago de Chile, Chile: CEPAL.
- Bank, W. (2017). Monitoring global poverty: Report of the commission on global poverty (The Atkinson Commission). Washington, DC: World Bank.
- Bartholomew, D. J. (1987). Latent variables models and factor analysis. ( D. J. Bartholomew, Ed.). New York, NY: Oxford University Press.
- Battiston, D., Cruces, G., Lopez-Calva, L. F., Lugo, M. A., & Santos, M. E. (2013). Income and beyond: Multidimensional poverty in six Latin American Countries. Social Indicators Research, 112(2), 291–314.
- Beccaria, L., & Minujín, A. (1985). Métodos alternativos para medir la evolución del tamaño de la pobreza (Documento de Trabajo N. 6). Buenos Aires: INDEC.
- Boltvinik, J. (1992). El método de medición integrada de la pobreza. Una propuesta para su desarrollo. Comercio Exterior, 42(4), 354–365.
- Boltvinik, J. (1998). A panorama of poverty measurement methods. New York, NY: UNDP.
- Boltvinik, J. (2014). América Latina, de la vanguardia al rezago en Medición multidimensional de la pobreza. La experiencia contrastante de México. Una guía para la región. In J. Boltviniki (Ed.), La multidimensionalidad como un desafío para los métdos y técnicas de la Medición de la pobreza (pp. 23–73). Buenos Aires: CLACSO-CROP.
- Brennan, R. L. (2006). Educational measurement. ACE/Praeger series on higher education. USA: ERIC.
- Brown, T. (2006). Confirmatory factor analysis for applied research. ( T. Brown, Ed.). New York, NY: The Guilford Press.
- Buchanan, R. D., & Finch, S. J. (2005). History of psychometrics. In B. Everitt and D. Howell (Eds.), Encyclopedia of Statistics in Behavioral Science (Vol. 2, pp. 875–878). West Sussex: John Wiley.
- Cronbach, L. J. (1951). Coefficient alpha and the internal structure of tests. Psychometrika, 16, 297–334.
- Cudeck, R., & MacCallum, R. C. (2012). Factor analysis at 100: Historical developments and future directions. New Jersey: Routledge.
- de Graaf-Zijl, M., & Nolan, B. (2011). Household joblessness and its impact on poverty and deprivation in Europe. Journal of European Social Policy, 21(5), 413–431.
- Dean, H. (2010). Understanding human need. ( H. Dean, Ed.). Bristol, UK: The Policy Press, University of Bristol.
- Decancq, K., & Lugo, M. A. (2013). Weights in multidimensional indices of wellbeing: An overview. Econometric Reviews, 32(1), 7–34.
- Doyal, L., & Gough, I. (Eds.). (1991). A theory of human need. London, UK: The Macmillan press LTD.
- Gibbons, R. D., Immekus, J. C., Bock, R. D., & Gibbons, R. D. (2007). The added value of multidimensional IRT models. In Multidimensional and hierarchical modeling monograph (pp. 1–92). Chicago, IL: Center for Health Statistics, University of Illinois.
- Gordon, D. (2000). The scientific measurement of poverty: Recent theoretical advances. In J. Bradshaw (Ed.), Researching poverty (pp. 37–58). Aldershot: Ashgate.
- Gordon, D. (2006). The Concept and measurement of poverty. In C. Pantazis, D. Gordon, & R. Levitas (Eds.), Poverty and social exclusion in Birtain: The milenium survey (pp. 29–69). Bristol: Bristol Policy Press.
- Guio, A., Gordon, D., & Marlier, E. (2012). Measuring material deprivation in the EU: Indicators for the whole population and child-specific indicators. Luxembourg: EUROSTAT.
- Guio, A.-C., Gordon, D., Najera, H., & Pomati, M. (2017). Revising the EU material deprivation variables ( techreport). Luxembourg: EUROSTAT.
- Guio, A.-C., Marlier, E., Gordon, D., Fahmy, E., Nandy, S., & Pomati, M. (2016). Improving the measurement of material deprivation at the European Union level. Journal of European Social Policy, 26(3), 219–333.
- Hambleton, R., & Jodoin, M. (2003). Item response theory: Models and features. In Fernández-Ballesteros (Ed.), Encyclopedia of psychological assessment (pp. 510–515). London: SAGE Publications Ltd. doi:10.4135/9780857025753.n110
- Harris, D. (1989). Comparison of 1-, 2-, and 3-parameter IRT models. Educational Measurement: Issues and Practice, 8(1), 35–41.
- Hu, L., & Bentler, P. (1999). Cutoff criteria for fit indexes in covariance structure analysis: Conventional criteria versus new alternatives. Structural Equation Modeling: A Multidisciplinary Journal, 6(1), 1–55.
- INDEC. (1984). La Pobreza en la Argentina: Indicadores de necesidades básicas insatisfechas a partir de los datos del Censo nacional de población y vivienda, 1980. Buenos Aires, Argentina: Instituto Nacional de Estadística y Censos.
- Kast, M., & Molina, S. (1975). Mapa extrema pobreza (en Chile). Santiago de Chile, Chile: ODEPLAN/IEUC.
- Katzman, R. (2000). Notas sobre la medición de la vulnerabilidad social. Santiago de Chile, Chile: CEPAL.
- Kvalheim, O. M. (2012). History, philosophy and mathematical basis of the latent variable approach: From a peculiarity in psychology to a general method for analysis of multivariate data. Journal of Chemometrics, 26(6), 210–217.
- Lai, K., & Green, S. B. (2016). The problem with having two watches: Assessment of fit when RMSEA and CFI disagree. Multivariate Behavioral Research, 51(2–3), 220–239.
- Lohmann, H., & Marx, I. (2018). Handbook on in-work poverty. Cheltenham, UK: Edward Elgar Publishing.
- Mack, J., & Lansley, S. (Eds.). (1985). Poor Britain. London: George Allen & Unwin.
- Moisio, P. (2004). A latent class application to the multidimensional measurement of poverty. Quality and Quantity, 38(6), 703–717.
- Muthén, B. (2013). IRT in Mplus. Mplus. Retrieved from http://www.statmodel.com/download/MplusIRT2.pdf
- Muthén, L., & Muthén, B. (Eds.). (2012). Mplus user’s guide (7th ed). California, USA: Mplus.
- Nájera, H. E. (2018). Reliability, population classification and weighting in multidimensional poverty measurement: A Monte Carlo study. Social Indicators Research. doi:10.1007/s11205-018-1950-z
- Nandy, S., & Pomati, M. (2015). Applying the consensual method of estimating poverty in a low income African setting. Social Indicators Research, 124(3), 693–726.
- Nolan, B., & Whelan, C. T. (2011). The EU 2020 poverty target. UCD Geary Institute Discussion Paper Series. Dublin: Geary Institute.
- Nunnally, J. C. (1978). Psychometric theory. McGraw-Hill. Retrieved from http://books.google.co.in/books?id=WE59AAAAMAAJ
- Pasha, A. (2017). Regional perspectives on the multidimensional poverty index. World Development, 94, 268–285.
- Raykov, T., & Marcoulides, G. (Eds.). (2011). Introduction to psychometric theory. New York, NY: Routledge.
- Revelle, W. (1979). Hierarchical cluster analysis and the internal structure of tests. Multivariate Behavioral Research, 14(1), 57–74.
- Revelle, W. (2018). Psych: Procedures for personality and psychological research. Evanston, IL: Northwestern University. Retrieved from https://CRAN.R-project.org/package=psych Version = 1.8.12.
- Revelle, W., & Zinbarg, R. (2009). Coefficients alpha, beta, omega, and the glb: Comments on Sijtsma. Psychometrika, 74(1), 145–154.
- Santos, M. E., & Villatoro, P. (2016). A multidimensional poverty index for Latin America. Review of Income and Wealth, n/a–n/a. doi:10.1111/roiw.12275
- Sen, A. (1976). Poverty: An ordinal approach to measurement. Econometrica, 44(2), 219–231.
- Sen, A. (1999). Development as freedom. ( A. Sen, Ed.). Oxford: The Clarendon Press.
- Spearman, C. (1904). The proof and measurement of association between two things. Américan Journal of Psychology, 15(1), 72–101.
- Spicker, P., Alvarez, S., & Gordon, D. (2006). Poverty and international glossary. In P. Spicker, Alvarez S., & D. Gordon, (Eds.), International studies in poverty research, International social science council. London, UK: Zen Books.
- Stewart, Q. T. (2006). Reinvigorating relative deprivation: A new measure for a classic concept. Social Science Research, 35(3), 779–802.
- Streiner, D. L., Norman, G. R., & Cairney, J. (2015). Health measurement scales: A practical guide to their development and use. USA: Oxford University Press.
- Thorndike, R., & Hagen, E. (1969). Measurement and evaluation in education and psychology. New York, NY: John Wiley and Sons.
- Townsend, P. (Ed.). (1979). Poverty in the United Kingdom: A survey of household resources and standards of living. England, UK: Penguin Books Ltd.
- Townsend, P. (2010). The meaning of poverty. The British Journal of Sociology, 61, 85–102.
- Vollmer, F., & Alkire, S. (2018). Towards a global assets indicator: Re-assessing the assets: Indicator in the global multidimensional poverty index Oxford, UK: OPHI RESEARCH IN PROGRESS SERIES 53a.
- Whelan, C., & Maitre, B. (2006). Comparing poverty and deprivation dynamics: Issues of reliability and validity. The Journal of Economic Inequality, 4(3), 303–323.
- Zinbarg, R., Revelle, W., Yovel, I., & Li, W. (2005). Cronbach’s α, Revelle’s β, and Mcdonald’s ω: Their relations with each other and two alternative conceptualizations of reliability. Psychometrika, 70(1), 123–133.
Annex
Table