
 ?Mathematical formulae have been encoded as MathML and are displayed in this HTML version using MathJax in order to improve their display. Uncheck the box to turn MathJax off. This feature requires Javascript. Click on a formula to zoom.
Abstract
This paper studies productivity convergence to the regional and national frontiers among manufacturing firms in India, using panel data over the period 1999 to 2010. We find evidence that lagging firms converge to their national and regional frontiers, with faster speed of convergence to the national frontier than to their regional frontier. We extend our analysis to explore how firms’ participation in foreign markets (through exporting and investing abroad) affects the process of convergence. Our results suggest a ranking of firms’ speed of convergence based on their level of international engagement through exports, with non-exporters converging faster to their technological frontiers, followed by non-continuous exporters, and finally by continuous exporters. These results suggest that more established exporters are closer to the technological frontier and therefore have less scope to catch up than their less persistent counterparts and non-exporting firms. However, we did not find significant differences in the speed of convergence amongst exporting firms that have moved to the next stage of globalisation by investing abroad.
1. Introduction
The process of productivity convergence (or catching up) has been widely recognised to be one of the most important sources of productivity growth for countries and firms behind the technological frontier. The intuition behind this process is that the relatively lower costs of imitation (compared to innovation) allows the less developed countries or firms to grow relatively quickly and catch up to the technological leaders.
In contrast with a long tradition of empirical work at the country and industry levels (for example, Barro & Sala-i-Martin, Citation1997; Howitt, Citation2000), the process of productivity convergence at the firm level only started to receive attention in recent years.Footnote1 The bulk of this nascent firm-level literature has focused mainly on examining how the less productive firms catch up to the national technological frontier in each industry (for example, Nishimura, Nakajima, & Kiyota, Citation2005; Girma & Kneller, Citation2005; Chevalier, Lecat, & Oulton, Citation2012;; Gemmell, Kneller, McGowan, Sanz, & Sanz‐Sanz, Citation2018), ignoring the process of productivity convergence to the sub-national regional frontiers.
Considering productivity catch-up to the national frontier only might be adequate in the context of developed or relatively small countries with integrated economies, facilitated by high-quality infrastructures, common institutions, and limited linguistic and cultural diversity. Such contexts facilitate the adoption of similar technologies within national boundaries. However, in large and less developed countries, like India, the geographical location of firms is more likely to matter. In such scenarios, there is a strong likelihood that institutional, linguistic, and cultural diversity gives rise to technological heterogeneity between firms within industries across the country. This diversity is evident in India, one of the most multicultural nations in the world. In terms of language, for example, India has 22 scheduled dialects, and each state can adopt any regional language as their official idiom. Although Hindi is the official tongue of the central government, there is no one ‘national language’. According to 2011 India Census Data, 43.6 per cent of total population speaks Hindi, while the other 56.4 per cent speaks the other 21 scheduled languages, as well as other dialects. In addition to this linguistic diversity, a body of work has identified marked institutional and political heterogeneity across Indian regions, which induce differences not only in policy and government performance (Chhibber & Nooruddin, Citation2004; Dash & Raja, Citation2009), but also in business behaviour (Kumar & Borbora, Citation2017) across regions.Footnote2
In a country with such geographical heterogeneity, the process of technological catch-up to the frontier may not be appropriately represented by merely examining convergence to the national frontier. In less than fully integrated national economies, one may also need to allow for the possibility of convergence to sub-national regional frontiers.Footnote3 The first objective of this paper is, therefore, to extend existing studies on firms’ productivity convergence by exploring the process of catching up of lagging firms in India to both the national and sub-national (or regional) frontiers simultaneously.Footnote4 To our knowledge, only Griffith, Redding, and Simpson (Citation2009) and Zheng (Citation2016) have explored the process of firms’ productivity catching up to both frontiers in the context of advanced economies (the UK and New Zealand, respectively), which are countries with relatively small and well-integrated territories. The results from these studies indicate that the less productive firms converge faster towards the regional frontier than to the national frontier, suggesting that knowledge spillovers may be geographically concentrated, with firms benefiting more from leading firms that are located nearby.Footnote5 In the context of India, a country with more homogeneity of conditions and deeper economic integration within than between regions, there may be greater opportunity or incentive for firms to converge faster to the regional than to the national frontier. However, while firms may benefit from local technological spillovers, they might also need to follow technological advances outside their regions (Bathelt, Malmberg, & Maskell, Citation2004), especially if local knowledge is insufficient for firms’ productivity catching up. In contrast to more advanced nations, an important characteristic of developing countries like India is the high concentration of national frontiers in specific regions, which forces local firms to follow not only their regional leader, but also the national technological frontier located outside their regions. Understanding the importance of local and national forms of productivity catching-up in non-fully integrated developing countries is therefore an important question that needs to be explored empirically.
In addition to overlooking the possibility of catching up to sub-national frontiers, a second limitation of the existing research on firm-level productivity convergence is the lack of understanding of the role of firms’ international engagement in fashioning the speed of technological convergence. Most of the existing literature has mainly focused on investigating how globalisation facilitates firms’ productivity growth, but its effects on the nature and speed of convergence to regional and national frontiers is not well understood.Footnote6 Evaluating the process of productivity convergence amongst firms engaged in international activities is particularly relevant for firms from developing countries like India, where governments have been actively implementing outward-oriented reforms with the view of facilitating international technology transfer and helping indigenous firms to catch up with the technological frontier. In the case of India, one of the most important features of such outward-oriented economic reforms has been the promotion of exports and outward foreign direct investments (OFDI). Over the period of our study the share of merchandise trade (imports plus exports as a percentage of GDP) almost doubled from 18 per cent in 1999 to 34 per cent by 2010. During the period of analysis, there was also a substantial rise in cross border investment activities by Indian firms, with OFDI increasing from US$6 million in 1990 to $US15,947.4 million in 2010 (United Nations Conference on Trade and Development [UNCTAD], Citation2015). Despite this successful international expansion of Indian firms, the effectiveness of such activities in facilitating technology transfer and helping indigenous firms to catch up to the technological frontier remains open to question. Thus, the second objective of this paper is to investigate if the speed of productivity convergence is affected by the extent to which firms engage in international activities. In particular, we explore potential differences in the speed of catching up between domestic firms, exporters, and firms engaged in overseas investments.Footnote7 Moreover, in our empirical analysis we differentiate between different levels of exporting engagement by distinguishing between continuous and sporadic exporters.
We perform our analysis using the Centre for Monitoring the Indian Economy (CMIE) Prowess database, which contains balance sheets and income statements for listed and unlisted companies operating in different industries in India. From this database, we extracted firms operating in the manufacturing sector for the fiscal period spanning from 1999 to 2010.Footnote8 An important characteristic of this data set is that it contains information on firms’ regional location, which allows us to identify regional frontiers and examine the speed of catching up of lagging firms towards these regional leaders, as well as the conventional national frontier.
To preview our results, our estimates indicate that Indian manufacturing firms converge to their national and regional frontiers, with somewhat more convergence to the national than to the regional frontier. While demonstrating the importance of convergence to the national frontier, the findings of the present paper show that by not allowing for regional frontier effects (as is the case of most of the related literature on productivity convergence at the firm or industry level) the role of the national frontier may well have been overstated. We also find that non-exporting firms converge faster than exporting firms, and among exporters, non-continuous exporters show higher speed of convergence than continuous exporters.Footnote9 However, when comparing exporting firms with and without foreign direct investments, our results show no significant difference in the relative speed of convergence to either frontier.
The remainder of the paper is organised as follows. Section 2 presents the empirical framework. This is followed by a discussion of the data used to measure and model productivity convergence (section 3). The empirical results are presented in section 4, and the overall conclusions are set out in section 5.
2. Empirical framework
2.1. Productivity convergence
To estimate firms’ productivity convergence towards the national and regional frontier, we employ a formulation from the macroeconomic literature of productivity growth and convergence (see Bernard & Jones, Citation1996; Cameron, Proudman, & Redding, Citation2005), which has been extensively used in analysing cross-country productivity convergence, as well as firm-level productivity catching up (for example, Griffith et al., Citation2009; Nishimura et al., Citation2005). The standard baseline model used in this literature is described as:
In the context of firm-level analysis, the dependent variable, , is the natural logarithm of the productivity level of firm i, operating in industry j at time t. Our measure of firms’ productivity is total factor productivity (TFP), which is estimated using the Levinsohn and Petrin (Citation2003) approach. To construct this variable we use net fixed assets as a measure of firms’ capital stock; the sum of domestic and imported raw materials to compute the intermediate input variable; the wage bill as a proxy for the labour variableFootnote10; and the difference between sales and intermediate inputs as our value-added variable.
For each year, the technological frontier is defined as the firm with the highest TFP in each industry. Thus, in EquationEquation (1)(1)
(1) productivity convergence is evaluated by introducing the term (lnAFjt-1- lnAijt-1), defined as the distance (or gap) in productivity between the productivity of the technological frontier (lnAFjt-1) and firm i (lnAijt-1) at time t-1. This approach allows for changes in the frontier over time, as one firm may catch up and overtake the initial frontier next period. The coefficient on the productivity gap term (λ) is an indicator of the speed at which firm i catches up to the frontier each year. A positive and significant value of λ indicates that, on average, firms further behind the technological frontier grow faster than firms nearer the frontier, providing evidence of productivity catching-up.
EquationEquation (1)(1)
(1) accounts for productivity persistence over time (by including firm i’s productivity in the previous year, lnAijt-1), as well as heterogeneity in productivity across firms (captured by the term
). The idiosyncratic error term (ϵijt) is assumed to follow a normal distribution with a mean of zero and a constant variance.
In our empirical analysis, we rearrange (taking lnAijt-1 to the left-hand side) and extend EquationEquation (1)(1)
(1) to allow for convergence to the regional and national frontiers. In doing so, we also control for firms’ size and age, and include a set of time and fixed effects to control for unobserved industrial and regional heterogeneity, as described in EquationEquation (2)
(2)
(2) :
Where is the annual rate of firm i’s productivity growth;
is a vector of firm i’s characteristics including its size and age;
,
, and
are industry, region, and year effects; lnANFjt-1 and lnARFjt-1 represent the natural logarithm of the productivity level of the national and regional industry frontiers, respectively; the terms
and
are therefore the national and regional gaps in productivity between firm i and the national and regional industry leaders, respectively; and the coefficients λ1 and λ2 capture the speed of technological convergence towards the national and regional frontiers.Footnote11
2.2. Empirical strategy
The estimation of productivity convergence at the firm level is subject to a number of econometrics concerns. First, the presence of on both sides of EquationEquations (1)
(1)
(1) or (Equation2
(2)
(2) ) raises potential endogeneity issues which might lead to biased estimations of the true speed of convergence. On the one hand, the method of ordinary least squares (OLS) tends to underestimate the speed of convergence, as it produces a negative correlation between the gaps and the error term; whereas the fixed effects (FE) estimator, on the other hand, tends to overestimate the speed of convergence (Bond, Citation2002; Iacovone & Crespi, Citation2010). Following Iacovone and Crespi (Citation2010), in our empirical analysis, we, therefore, report OLS estimates alongside FE estimations to provide a range within which the true convergence parameters are likely to lie. To verify that the true speed of convergence lies between the OLS and FE estimates we conducted, as a robustness test, a GMM estimation using lag values of the productivity gaps as internal instruments for the potentially endogenous productivity gap terms. These estimates are expected to lie between the estimated range of productivity convergence obtained from using the OLS and FE estimators.
A second concern commonly identified in the literature of firm’s productivity convergence is a potential sample selection problem, whereby we can only observe the productivity of firms that survive during the period of analysis, which are likely to be the most productive firms (Fariñas & Ruano, Citation2005; Nishimura et al., Citation2005). To check whether our results are robust to potential sample selection we use a two-stage sample selection procedure, where an inverse Mills ratio (IMR) is obtained from estimating a firm’s survival equation (in the first-stage), which is then used as an additional control variable in our (second-stage) convergence equation.Footnote12
The literature of firms’ productivity convergence has also highlighted potential measurement problems in the technological frontier that may arise when only the firm with the highest productivity level is used as the industry leader. To check that our results are not affected by any potential miss-measurement of the technological frontier, as a robustness check we define the national productivity frontier as a weighted average of the top five firms with the highest productivity levels in each industry-year, an approach that has been used by Griffith et al. (Citation2009).
In addition to the aforementioned robustness tests, we also performed a number of additional checks to ensure that our main results are robust. For example, we check the sensitivity of our results to an alternative way of measuring TFP using imputed employment data for firms that do not report this figure.Footnote13 We also estimate our convergence model for the period 1999–2006 to check that our main results are not affected by the negative shocks in productivity caused by the global financial crisis. Finally, we excluded firms that started their operations during the sample period in order to discard any concern about firms choosing their locations endogenously (that is to rule out the possibility that firms locate themselves near the technological frontier).
3. Data
Our main data source is the Prowess database compiled by the Centre for Monitoring the Indian Economy (CMIE). The database includes annual financial statements for both listed and unlisted firms and is one of the most comprehensive firm-level databases in India. The firms covered by this database account for more than 70 per cent of industrial output, 75 per cent of corporate taxes, and more than 95 per cent of excise taxes collected by the government. It includes firms from a wide cross-section of industries in manufacturing, services and financial sectors. In this study, we concentrate on manufacturing firms and focus on the period 1999 to 2010. To control for outliers, we winsorised the lower and upper 0.1 per cent of the variables employed in the estimation of TFP. Thus, our econometric analysis is based on an unbalanced panel dataset that includes 7,140 manufacturing firms spanning a 12 year-period, which give us a total number of 43,913 observations.
The Prowess database also provides information on the regions in which firms are located. This information allows us to identify the national and regional technological frontiers and evaluate the speed of productivity convergence of Indian manufacturing firms towards their national and sub-national (or regional) frontiers.Footnote14 Thus, for each year, we define the national and regional productivity frontier as the firm with the highest TFP in each industry in the country and the region, respectively.Footnote15 We then calculate the national and regional productivity gap terms as the distances in productivity of a laggard firm from its corresponding frontiers. In our empirical analysis, we focus on the 13 major states of India plus the capital, Delhi, which together contribute with about 70 per cent of India’s GDP and 87 per cent of its population (Shingal, Citation2014).Footnote16
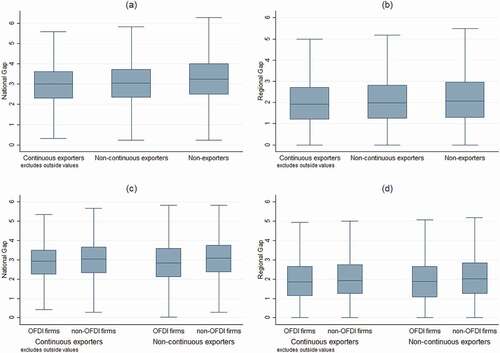
shows the distribution of TFP growth and the productivity gap terms, and provides a graphical inspection of the national and regional technological gaps across groups of firms according to their global statuses. In we observe that firms in our sample exhibit substantial dispersion in their productivity growth rates and their scope for catching up. This is reassuring, as our empirical strategy to test the hypothesis of productivity convergence relies on important variation in firms’ productivity growth and their scope for catching up. Interestingly, looking at , we observe that, on average, the national and regional gaps are smaller for exporting than for non-exporting firms; and that among exporters, continuous exporters have potentially less scope for catching up than non-continuous exporters. However, differences amongst exporters that also invest abroad and those that only export, do not appear to be important.
Figure 1. Distribution of TFP growth and productivity gap
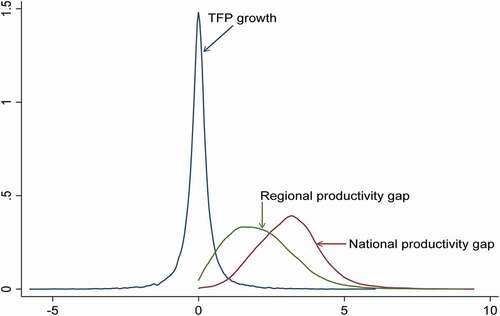
Figure 2. National and regional productivity gaps across groups of firms
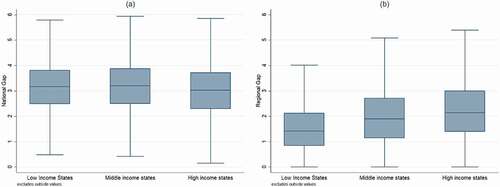
Looking at the distribution of lagging and frontier firms across regions, shows that, not surprisingly, the most developed regions in India host a large fraction of firms, and the national leaders are highly concentrated in such advanced regions. This uneven distribution of firms across geographical regions, characteristic of less advanced economies, is an important aspect that needs to be considered when studying firms’ productivity convergence in developing countries. In such contexts, the role of the regional frontier is likely to be different than in contexts with less geographical concentration of frontier (and non-frontier) firms, as is the case of more advanced economies. To provide a graphical illustration of the potential scope for catching up amongst firms located in regions with different levels of development, presents the regional and national productivity gap of firms located in low, medium, and high-income regions. shows that, in general, there is a high variability in the scope for catching up across firms in different regions. More interestingly, however, firms in low-income regions appear to have less scope to catch up to their regional frontier, as judged by the smaller productivity gap to their regional leader. Firms in these regions are likely to follow more closely the national frontier.
Table 1. Summary statistics by state
Figure 3. National and regional productivity gaps across regions
In we provide more detailed summary statistics of the key variables used in our empirical analysis across different types of firms. We can observe that, on average, national leaders are 1.5 times more productive than regional leaders, which in turn are 1.8 times more productive than the laggard firms. As one might expect, there are also substantial productivity differences between domestic and globally engaged firms. As predicted by recent models in international economics, firms in our sample are sorted according to their productivity levels, with those firms engaged in exporting and foreign direct investments displaying the highest levels of productivity, followed by continuous exporters, non-continuous exporters, and non-exporters. These patterns result in internationally engaged firms having narrower productivity gaps and potentially less scope for catching up, as was shown in .
Table 2. Mean and standard deviation of the main variables by type of firm
Interestingly, firms engaged in international markets displayed, on average, negative (although small) rates of productivity growth during the period of analysis. This puzzling phenomenon is explained by the disproportionately negative effects that the global financial crisis had on globally oriented firms, as is illustrated in Table A2 in the Supplementary Materials. In Table A2 we can observe that although, on average, all groups of firms experienced positive rates of productivity growth before the global financial crisis, the period 2007–2010 witnessed a general decrease in TFP across all firms in India (especially in the year 2008). Not surprisingly, this decrease in productivity was more pronounced amongst firms with a global nexus.Footnote17
4. Empirical results
4.1. Productivity convergence: baseline results
As discussed in Section 2, a common econometrics concern when estimating EquationEquation (2)(2)
(2) is the potential endogeneity of our productivity gap indicators. In the presence of such endogeneity, the OLS estimator is likely to underestimate the true speed of convergence towards the regional and national frontiers, whereas the Fixed Effects (FE) estimator is expected to overestimate these parameters. To address this concern, throughout this paper we estimate our models of productivity convergence using these two estimators, with the view that they will give us the expected lower and upper bounds in which the true speed of convergence is likely to lie. In we, therefore, start presenting our baseline OLS and FE estimates of the speed of convergence towards the national and regional frontiers. Overall, the results from these estimators are coherent and in line with the expected bias pattern, whereby the estimated coefficient of the TFP gap term is lowest (highest) under the OLS (FE) estimator.Footnote18
Table 3. Firms’ productivity convergence: baseline results
In general, regardless of the estimator employed, suggests that Indian firms tend to converge faster towards the national than to the regional frontier. For example, looking at columns (1) to (4), which provide estimations of speed of convergence towards the national and regional frontier separately, our results show that firms converge at rate of between 21 per cent and 41 per cent towards the national leader; whereas the speed of convergence towards the regional frontier lies between 18 per cent and 39 per cent. However, by not accounting for the simultaneous convergence towards the national and regional frontier, our estimations in columns (1) to (4) are likely to be biased. In columns (5) and (6) we, therefore, allow firms to converge towards both frontiers simultaneously. These results confirm that Indian firms converge faster to the national frontier, suggesting that the greater distance and scope for catching up to the national frontier dominates any greater scope for learning from more geographically proximate regional leading firms. The regional frontier does, however, play a significant role in the productivity convergence process, and the role of the national frontier would be overstated if (as in many studies) the regional frontier was abstracted from.Footnote19 According to columns (5) and (6), the speed of convergence to the national and regional frontiers lies between 15 per cent and 25 per cent and 8 per cent and 23 per cent, respectively.
4.2. Dealing with the concentration of national frontiers in some specific regions
An important conclusion from is the finding that, on average, laggard firms converge faster to the national than to the regional frontier. Given that India is a geographically large and culturally and linguistically diverse country, this is perhaps a surprising finding, which contrasts with what Griffith et al. (Citation2009) and Zheng (Citation2016) have reported for the UK and New Zealand, respectively. For these countries, firms have been found to catch up faster to the regional frontier. A possible explanation for the difference in findings is the existence of greater technological heterogeneity across the states/regions of India than across regions in the UK and New Zealand. If nationally efficient firms are relatively evenly distributed across regions, as it is likely to be the case in developed, smaller, and less culturally and linguistically diverse economies (like the UK and New Zealand), then the technological gap to the regional frontier is expected to be very similar to the distance to the national frontier for lagging firms in most regions. In contrast, in developing countries like India, a large fraction of national frontiers are likely to be located in specific regions. In our database for example, we observe a high concentration of national frontiers in the high-income states of Gujarat and Maharashtra. These two states host around 50 per cent of the national leaders. To explore whether our finding about the relative speed of convergence to the national and regional frontier is being driven by this regional concentration of national frontiers, we conduct our analysis by splitting our sample into laggard firms located in these two states and laggard firms located in the remaining 12 states. The estimation results from this exercise are presented in columns (1) to (6) in . The estimates in show that laggard firms operating in Gujarat and Maharashtra converge faster to their regional than to the national frontier. This finding clearly contrasts with the pattern of productivity convergence of firms located in the rest of the country, which, in line with our baseline estimations, display higher speeds of convergence towards the national frontier.Footnote20 Overall, the results suggest that the relative importance of the regional and national frontier in driving convergence is fashioned by the distribution of frontier firms across the country.
Table 4. Firms’ productivity convergence across groups of regions
4.3. Dealing with common frontiers
In the previous analysis, we treated the speed of convergence of firm i located in region j as being unaffected by whether or not the national industrial frontier was also located in region j. In other words, we ignored the fact that for some laggard firms their regional leader is also the national frontier.Footnote21 This means that a common gap to the regional and national frontier is applied in the econometric modelling presented in , despite the possibility that only one of the frontiers may be inducing convergence by a specific lagging firm in that region. To check whether the presence of common frontiers affects the estimated speeds of convergence, we re-estimated our models in dropping the observations with common frontiers. The results from this reduced sample are presented in . This exercise confirms that firms in the major states of Gujarat and Maharashtra converge faster to their regional frontiers, whereas firms in the rest of the country follow the national leader more intensively.Footnote22
Table 5. Firms’ productivity convergence across groups of regions excluding common frontiers
4.4. The effects of globalisation on firm’s productivity convergence
In what follows, we extend our analysis by considering how the speed of productivity convergence is affected by whether or not firms are directly engaged with the global economy through exporting and investing abroad. We perform this analysis by first comparing the process of technological convergence among exporters and non-exporters; and then assessing whether the speed of convergence is different for firms that only export versus those that in addition to exporting also invest abroad. Through the analysis, we distinguish between continuous and non-continuous (or sporadic) exporters, as the international trade literature has highlighted important differences between these groups of firms. presents the regression results for non-exporters versus continuous and non-continuous exporters. In line with our baseline results, the coefficients of the national gap and regional gap variables remain positive and significant for all three groups of firms. The magnitudes of the estimated speed of convergences are similar to those reported in the baseline model presented in . However, we observe that firms that do not export converge at a slightly faster rate, followed (in order) by sporadic exporters and continuous exporters. These results are not surprising given that firms that continuously export display higher levels of productivity, and hence have less scope and need for catching up than sporadic exporters (which are in turn more productive than non-exporting firms).
Table 6. Firm’s productivity convergence across groups of firms
To further examine whether the process of internationalisation of Indian firms has affected their ability to catching up, we extend our previous analysis by considering the decision to invest abroad. Overseas foreign direct investments have been an important aspect of the recent process of globalisation of Indian firms, which in addition to exporting have moved a step further by setting up subsidiaries abroad. In our sample, around 6 per cent of firms have expanded their operations abroad through OFDI, but a little over 95 per cent of firms that conduct OFDI are exporters. We, therefore, consider how OFDI affects the speed of catching up amongst continuous and non-continuous exporting firms. presents the estimation results for these groups of firms. The coefficients on the national and regional gaps are in line with our baseline results, suggesting that exporters (with or without overseas foreign direct investments) converge more rapidly to the national than to the regional frontier. The results show that non-continuous exporters without OFDI tend to catch up slightly quicker to their regional frontiers than their counterparts with overseas investments. There are, however, no significant differences in the relative speed of convergence to either frontier between OFDI and non-OFDI firms in the case of continuous exporters. Further engagement of continuous exporters with the global economy through investing abroad does not seem to have additional effects on their convergence patterns.
Table 7. Firm’s productivity convergence across groups of exporting firms
4.5. Robustness checks
As mentioned in Section 2, the estimation of firm-level productivity is challenging due to potential sample selection bias. To address this problem, we follow the Heckman (Citation1979) two-stage treatment effect procedure. Specifically, in the first-stage, we compute an inverse Mills ratio (IMR) obtained from estimating a firm’s survival equation, which we then include in the second-stage regression of productivity convergence.Footnote23 The baseline results from these estimations are presented in columns (1) and (2) of Table A5 in the Supplementary Materials. These results are consistent with our previous findings, indicating that correction for potential sample selection does not alter our main conclusions.
Another concern when estimating firm’s productivity convergence is associated to potential measurement errors in the identification of the frontier. The negative consequences of measuring the frontier with an error is exacerbated by considering only the most productive firm as the unique national leader, as we have done in our previous analysis. To check that our results are not driven by such measurement errors we define the national frontier as the weighted average of TFP in the top five most productive firms in each industry each year, instead of using the single most productive firm. The baseline empirical findings from this experiment are shown in columns (3) and (4) of Table A5 in the Supplementary Materials. The results are in line with our main conclusions, confirming that firms converge to their national and regional frontiers, with a faster speed of catching up to the national frontier.
Another potential source of concern when estimating firm productivity convergence is the possibility that firms locate themselves geographically close to the technological frontier, which might bias the estimations of the speed of convergence. However, in the case of India, this issue is unlikely to be a major source of concern. Empirical studies have shown that the main determinants of Indian firms’ location decisions are related to factors such as physical infrastructure, workforce education, and differences in labour regulation rather than on the performance of the leading firms in their industries (Ghani, Kerr, & O’Connell, Citation2014; Mukim & Nunnenkamp, Citation2012; Sridhar & Wan, Citation2010). Moreover, given the substantial differences in the quality of infrastructure, education, labour regulation, as well as the linguistic and cultural diversity among Indian states, it is also costly for firms to move between states. Therefore, we are confident that our previous estimations, in which we treated the firm location as fixed, are appropriate to conduct our analysis of productivity convergence in India. As a robustness check, however, we drop those firms that started their operations during the period of analysis (around 15% firms) and performed our analysis using only those firms that existed at the start of our sample period. The results from this experiment are presented in columns (5) and (6) of Table A5 in the Supplementary Materials. These estimates are highly consistent with our main conclusions, suggesting that endogeneity due to location choice is unlikely to be a problem.
A specific limitation of estimating a firm’s productivity convergence in India using the Prowess database is that it does not report information on the number of employees for all firms in the dataset. Following Girma and Vencappa (Citation2015), we predict the missing employment data using a two steps procedure, as follows: i) in the first stage, we regress the logarithm of the total number of employees (for those firms with available data) on the logarithm of total assets, controlling for year and industry effects, and ii) in the second stage, we use the predicted values at different values of assets to impute the missing employment data for all other firms. We use this imputed employment data to calculate TFP, and re-estimate our models of productivity convergence. The baseline results from these estimations are reported in columns (7) and (8) of Table A5 in the Supplementary Materials. It is reassuring to confirm that our previous conclusions are not affected by using wages instead of employment in the calculation of TFP.
As a final robustness check, we estimate our baseline convergence model on the period 1999–2006. We perform this analysis in order to eliminate any potential effects caused by the global financial crisis on the estimation of the speed of convergence of Indian firms. This exercise is motivated by the observed differences in productivity growth before and after the crisis, as illustrated in Table A2 in the Supplementary Materials. The estimation results on this pre-crisis period are reported in columns (9) and (10) of Table A5 in the Supplementary Materials. These results are in line with our main estimations for the whole sample period, which allow us to conclude that our conclusions are not affected by the effects of the global financial crisis.
5. Conclusions
In this paper we study the process of productivity convergence to both national and regional frontiers at the firm level, using a comprehensive micro manufacturing panel dataset for the regions (13 states and 1 territory) of India from 1999 to 2010. Our results confirm the process of convergence of productivity levels of lagging firms to frontier firms. Unlike many other studies, we allow for convergence to both the regional and national frontier. The results show that firms converge to both their national and regional frontiers, and that abstraction from the regional frontier (as is the case in many studies) would tend to overstate the role of the national frontier in fashioning productivity catch-up at the firm level. We compare the convergence speed to the national frontier with that to the regional frontier, and find that firms on average converge more rapidly to their national frontier than to the regional frontier. This indicates that the influence of greater distance of lagging firms in general from the national frontier tends in this particular country context to dominate the greater scope to learn from more proximate, regional frontier firms. This is apparently surprising and in contrast to findings for smaller and more integrated economies (UK and New Zealand), where more rapid convergence to regional than national frontiers has been identified. We find, however, that there is considerable concentration of frontier firms in India, with virtually half of the frontier firms being located in just two states. In these two states, we do find more rapid convergence to the regional frontier than to the national frontier. We infer that greater technological heterogeneity across regions in the case of India than the above developed economies may account for the different patterns of convergence. Unlike in the case of the developed countries above, nationally efficient firms in India are often located in a region in which the lagging firms are not located. This results in greater distance of lagging firms to the national than the regional frontier and induces faster convergence to the national than the regional frontier (despite the greater homogeneity and integration within than between regions).
Since the trade liberalisation in 1991, Indian firms have been quite active in globalisation activities. We explore firms’ heterogeneity in global participation on the process of convergence. We first compare between exporters and non-exporters and between continuous (exporting every year) and non-continuous exporters (those exporting only in some years), and find greater speed of convergence to the national frontier for non-exporting than exporting firms and for non-continuous than continuous exporters. This is because exporters (continuous exporters) are more productive than non-exporters (non-continuous exporters) and they are closer to or at the frontier and have less scope to converge. Some exporters have taken globalisation a step further by undertaking overseas investments. We explore the heterogeneity among exporting firms (distinguishing between continuous and non-continuous exporters) in convergence speeds to the regional and national frontiers depending on whether or not they invest abroad, but find no significant differences in the relative speeds of convergence to either frontier between OFDI and non-OFDI firms.
Supplemental Material
Download PDF (508.3 KB)Acknowledgements
We are thankful to the editor, Oliver Morrissey, and two anonymous referees for helpful comments on a previous version of this paper.
Data availability statement
The data that support the findings of this study are available from the authors upon request.
Disclosure statement
No potential conflict of interest was reported by the author(s).
Supplementary materials
Supplementary Materials are available for this article which can be accessed via the online version of this journal available at https://doi.org/10.1080/00220388.2021.1881492
Additional information
Funding
Notes
1. See for example, Bernard and Jones (Citation1996); Esteban (Citation2000); Aiello and Scoppa (Citation2008); Villaverde and Maza (Citation2008); Lee (Citation2009); and Demir and Duan (Citation2018).
2. See Dheer, Lenartowicz, and Peterson (Citation2015) for a taxonomy of the subcultural divisions in India and a detailed qualitative account of their distinct attributes.
3. For example, Wang, Liu, Wei, and Wang (Citation2014) find that cultural proximity is an important factor in explaining the process of convergence of Chinese firms to multinational enterprises.
4. In this paper, the sub-national regions are defined by the administrative divisions in India (that is states and territories).
5. A related emerging literature has studied firms’ productivity convergence to global and national frontiers (see for example, Bartelsman, Haskel, & Märtin, Citation2008 for the UK,; Iacovone & Crespi, Citation2010 for Mexico). A key finding of this literature is that the national frontier exerts a stronger pull on domestic firms than the global frontier, suggesting that technologically lagging firms are less able to learn from the global frontier, perhaps because greater geographical distance and institutional and other barriers constrain the scope for learning effects.
6. Some of the few studies examining the role of trade on firms’ speed of convergence include Iacovone and Crespi (Citation2010) who find that exposure to trade allows Mexican firms to converge faster to the national frontier, whereas Chevalier et al. (Citation2012), on the other hand, show that exporting slows down the rate of catching up of French firms to the national technological frontier. Similarly, Lancheros (Citation2012) examines role of exporting and outward foreign direct investments on productivity convergence amongst Indian firms, but like most empirical studies only focuses on the process of catching up to the national frontier.
7. In our sample, around 6 per cent of firms have expanded their operations abroad through overseas foreign direct investments (OFDI), but a little over 95 per cent of firms that conduct OFDI are exporters. We, therefore, consider how OFDI affects the convergence process of the exporting firms. Henceforth, OFDI firms in this study refer to those exporters that invest overseas.
8. In India, the fiscal year runs from April 1st until March 31st. Thus, a reference to 1999 in this paper would indicate the fiscal year starting in April 1999 and ending in March 2000.
9. Following Greenaway, Guariglia, and Kneller (Citation2007), we define ‘continuous exporters’ as those firms that export every year, and ‘non-continuous exporters’ as those firms that export only in some years.
10. We use wages as a proxy for the freely variable input labour as Prowess does not report employment data for all firms. As a robustness test, however, we estimate the number of employees for those firms with missing employment data and the results remain robust to this alternative way of calculating TFP (see section 4.5. for details).
11. Table A1 in the Supplementary Materials provides the precise definition of the variables used in our analysis.
12. This strategy has been adopted by Griffith et al. (Citation2009) in a similar context.
13. As mentioned in section 2.1, we use the wage bill as a proxy for the freely variable input labour as Prowess does not report employment data for all firms. As a robustness test, we estimate the number of employees for those firms with missing employment data and estimate TFP using this imputed employment variable (see section 4.5. for details).
14. Although Prowess does not provide information at the plant level, we are confident that our results are not affected by the presence of multi-plants. As Harrison, Martin, and Nataraj (Citation2012) and Dougherty, Frisancho, and Krishna (Citation2014) have shown, very few Indian firms have more than one factory and the difference between ‘plant’ and ‘firm’ can be considered negligible.
15. We calculated the technological frontier for each of the 10 two-digit manufacturing industries included in the Prowess dataset for each year. These industries are: food products, textiles and leather products, paper and wood products, chemicals and chemical products, rubber and plastic products, cement and other non-metallic mineral products, basic metals alloys and metals products, machinery and machine tools, transport equipment and parts, and miscellaneous manufactured articles.
16. Although there are 14 major states in India (Andhra Pradesh, Bihar, Gujarat, Haryana, Karnataka, Kerala, Madhya Pradesh, Maharashtra, Orissa, Punjab, Rajasthan, Tamil Nadu, Uttar Pradesh and West Bengal), in this study we do not include Bihar, as it is a service-oriented state. With the exception Delhi, in our empirical approach, we include the union territories in India (which are usually cities) as part of the states in which they are located in or close by. To be more specific, we include Chandigarh as part of Punjab; Dadra and Nagar Haveli and Daman and Diu as part of Gujarat; and Pondicherry as part of Tamil Nadu. We excluded the small islands of Andaman and Nicobar and Lakshadweep, as we do not have data on them. We also excluded the non-major states in India from our empirical analysis as very few firms in our dataset are located in these states, leaving us with very few observations to conduct any meaningful empirical analysis.
17. See Baldwin (Citation2009) for an analysis of the great collapse in global trade that occurred in late 2008 and beginning of 2009.
18. To be more confident that the true speed of convergence lies between the OLS and FE estimates, we also estimate EquationEquation (2)(2)
(2) applying the system GMM estimator, where the potentially endogenous gap terms are instrumented using their own lag values. The results from these estimations, alongside the OLS and FE results, are presented in Table A3 in the Supplementary Materials. It is reassuring to observe that the system GMM estimator indeed generates an estimated speed of convergence that lies between the OLS and FE estimates.
19. We might also wish to explore whether there is an interaction effect that is whether greater distance from both frontiers induces even greater catch-up. An interaction term is, however, highly co-linear with the distance from the regional frontier in particular, since greater distance from the regional frontier must by necessity involve greater distance also from the national frontier. We do not attempt, therefore, to report estimations where all of the terms are separately and jointly included, but can note that when separately or jointly included the interaction term is positive and significant; suggesting that greater distance from both frontiers increases the rate of catch-up.
20. In our empirical analysis, we also performed separated regressions for firms located in Delhi and Tamil Nadu, as these two states combined host nearly 35 per cent of the national frontiers. The results from these regressions (which are available upon request) are in line with our baseline aggregated results, with laggard firms converging more rapidly to the national frontier (albeit with a speed of convergence to the regional frontier only marginally slower than that to the national frontier in the case of Tamil Nadu).
21. For about 18 per cent of the sample the national frontier is defined for a lagging firm by a firm from within the same region.
22. In addition to dropping observations with common frontiers, we also performed our estimations interacting our national gap term with a dummy variable taking the value of 1 if the frontier firm was located in the same region, and zero otherwise. The results from this exercise (presented in Table A4 in the Supplementary Materials) are in line with our key findings: firms in Gujarat and Maharashtra converge faster to their regional frontiers; whereas firms in the rest of the country converge faster towards the national leader.
23. This strategy has been adopted by Griffith et al. (Citation2009) in a similar context. Specifically, in the first stage of this procedure, we model a firm’s survival as a function of its age, log of sales, log of total capital, and control for ownership and industry dummies. The results from this (first-stage) regression are available on request.
References
- Aiello, F., & Scoppa, V. (2008). Convergence and regional productivity divide in Italy: Evidence from panel data (Munich Personal RePEc Archive (MPRA) Paper 17343). Retrieved from https://mpra.ub.uni-muenchen.de/17343/1/MPRA_paper_17343.pdf
- Baldwin, R. (2009). The great trade collapse: What caused it and what does it mean? The great trade collapse: Causes, consequences and prospects. Centre for Economic Policy Research, 100(105), 1.
- Barro, R. J., & Sala-i-Martin, X. (1997). Technological diffusion, convergence, and growth. Journal of Economic Growth, 2(1), 1–26.
- Bartelsman, E. J., Haskel, J., & Märtin, R.-P. (2008). Distance to which frontier? Evidence on productivity convergence from international firm-level data (Centre for Economic Policy Research (CEPR) Discussion Papers, 7032). Retrieved from https://cepr.org/active/publications/discussion_papers/dp.php?dpno=7032#
- Bathelt, H., Malmberg, A., & Maskell, P. (2004). Clusters and knowledge: Local buzz, global pipelines and the process of knowledge creation. Progress in Human Geography, 28(1), 31–56.
- Bernard, A. B., & Jones, C. I. (1996). Comparing apples to oranges: Productivity convergence and measurement across industries and countries. American Economic Review, 86(5), 1216–1238.
- Bond, S. R. (2002). Dynamic panel data models: A guide to micro data methods and practice. Portuguese Economic Journal, 1(2), 141–162.
- Cameron, G., Proudman, J., & Redding, S. (2005). Technological convergence, R&D, trade and productivity growth. European Economic Review, 49(3), 775–807.
- Chevalier, P.-A., Lecat, R., & Oulton, N. (2012). Convergence of firm-level productivity, globalisation and information technology: Evidence from France. Economics Letters, 116(2), 244–246.
- Chhibber, P., & Nooruddin, I. (2004). Do party systems count? The number of parties and government performance in the Indian states. Comparative Political Studies, 37(2), 152–187.
- Dash, B., & Raja, A. (2009). Institutions and the quality of governance: An empirical study on interstate differences in economic development in India. Asia-Pacific Development Journal, 16(1), 1–26.
- Demir, F., & Duan, Y. (2018). Bilateral FDI flows, productivity growth, and convergence: The north vs. the south. World Development, 101, 235–249.
- Dheer, R. J. S., Lenartowicz, T., & Peterson, M. F. (2015). Mapping India’s regional subcultures: Implications for international management. Journal of International Business Studies, 46(4), 443–467.
- Dougherty, S., Frisancho, V., & Krishna, K. (2014). State-level labour reform and firm-level productivity in India. India Policy Forum, 10(1), 1–56.
- Esteban, J. (2000). Regional convergence in Europe and the industry mix: A Shift-Share analysis. Regional Science and Urban Economics, 30(3), 353–364.
- Fariñas, J. C., & Ruano, S. (2005). Firm productivity, heterogeneity, sunk costs and market selection. International Journal of Industrial Organization, 23(7), 505–534.
- Gemmell, N., Kneller, R., McGowan, D., Sanz, I., & Sanz‐Sanz, J. F. (2018). Corporate taxation and productivity catch‐up: Evidence from European firms. Scandinavian Journal of Economics, 120(2), 372–399.
- Ghani, E., Kerr, W. R., & O’Connell, S. (2014). Spatial determinants of entrepreneurship in India. Regional Studies, 48(6), 1071–1089.
- Girma, S., & Kneller, R. (2005). Convergence in the UK service sector: Firm level evidence, 1988–1998. Scottish Journal of Political Economy, 52(5), 736–746.
- Girma, S., & Vencappa, D. (2015). Financing sources and firm level productivity growth: Evidence from Indian manufacturing. Journal of Productivity Analysis, 44(3), 283–292.
- Greenaway, D., Guariglia, A., & Kneller, R. (2007). Financial factors and exporting decisions. Journal of International Economics, 73(2), 377–395.
- Griffith, R., Redding, S., & Simpson, H. (2009). Technological catch-up and geographic proximity. Journal of Regional Science, 49(4), 689–720.
- Harrison, A. E., Martin, L. A., & Nataraj, S. (2012). Learning versus stealing: How important are market-share reallocations to India’s productivity growth? World Bank Economic Review, 27(2), 202–228.
- Heckman, J. J. (1979). Sample selection bias as a specification error. Econometrica, 47(1), 153–161.
- Howitt, P. (2000). Endogenous growth and cross-country income differences. American Economic Review, 90(4), 829–846.
- Iacovone, L., & Crespi, G. A. (2010). Catching up with the technological frontier: Micro-level evidence on growth and convergence. Industrial and Corporate Change, 19(6), 2073–2096.
- Kumar, G., & Borbora, S. (2017). Institutional environment differences across the Indian states for entrepreneurial development. Review of Integrative Business and Economics Research, 6, 50–69.
- Kumar, S., & Managi, S. (2012). Productivity and convergence in India: A state-level analysis. Journal of Asian Economics, 23(5), 548–559.
- Lancheros, S. (2012). Innovation and technological convergence: The role of technology investments and international activities. In Essays on firm level responses to trade and foreign direct investment liberalization in India(PhD Thesis). Retrieved from http://eprints.nottingham.ac.uk/12657/1/Thesis_Lancheros.pdf
- Lee, J. (2009). Trade, FDI and productivity convergence: A dynamic panel data approach in 25 countries. Japan and the World Economy, 21(3), 226–238.
- Levinsohn, J., & Petrin, A. (2003). Estimating production functions using inputs to control for unobservables. Review of Economic Studies, 70(2), 317–341.
- Mukim, M., & Nunnenkamp, P. (2012). The location choices of foreign investors: A district-level analysis in India. The World Economy, 35(7), 886–918.
- Nishimura, K. G., Nakajima, T., & Kiyota, K. (2005). Productivity convergence at the firm level (Discussion Paper No. 39). University of Tokyo MMRC. Retrieved from http://merc.e.u-tokyo.ac.jp/mmrc/dp/pdf/MMRC39_2005.pdf
- Roodman, D. (2009). How to do xtabond2: An introduction to difference and system GMM in Stata. Stata Journal, 9(1), 86–136.
- Shingal, A. (2014). The services sector in India’s states: A tale of growth, convergence and trade. The World Economy, 37(12), 1773–1793.
- Sridhar, K. S., & Wan, G. (2010). Firm location choice in cities: Evidence from China, India, and Brazil. China Economic Review, 21(1), 113–122.
- United Nations Conference on Trade and Development [UNCTAD]. (2015). Handbook of statistics. New York: United Nations.
- Villaverde, J., & Maza, A. (2008). Productivity convergence in the European regions, 1980–2003: A sectoral and spatial approach. Applied Economics, 40(10), 1299–1313.
- Wang, J., Liu, X., Wei, Y., & Wang, C. (2014). Cultural proximity and local firms’ catch up with multinational enterprises. World Development, 60, 1–13.
- Zheng, G. (2016). Geographic proximity and productivity convergence across New Zealand firms (Working paper 2016/04). New Zealand Productivity Commission. Retrieved from https://www.productivity.govt.nz/assets/Documents/explaining-ethnic-disparities-2/6cca996bb0/Geographic-proximity-and-productivity-convergence.pdf