
 ?Mathematical formulae have been encoded as MathML and are displayed in this HTML version using MathJax in order to improve their display. Uncheck the box to turn MathJax off. This feature requires Javascript. Click on a formula to zoom.
Abstract
It is important to monitor operators’ mental workload during the operation phase. Physiological measurement approaches could record the operator's mental data continuously, and might be less interruptive on the work activities. However, these methods often require the attachment of physical sensors, which are not unobtrusive in the physical sense. Furthermore, the individual difference makes calibrating to each individual tedious and requires trained persons to use. Often high noise-to-signal ratio data are hard to analyze. Due to these factors, physiological workload measurements are hardly widely applied in practical fields. In this study, an objective, non-intrusive and performance-based mental workload predictive model was proposed with high validity (R2 = 0.51), which can be applied during the operation phrase. This model, developed based on the Rasmussen's skill–rule–knowledge framework, is comprised of two novel cognitive indices, the attention required index and uncertainty index. It can be used as the basis for establishing an early online warning system automatically. Furthermore, this model also predicts the types of error-prone tasks. This kind of information is expected to provide managers and supervisors with opportunities to intervene and improve tasks before error occurred. Finally, the predictive model proposed in this paper requires more practical application in fields to be completed.
1. Introduction
Nowadays, “mental workload (MWL)” has been considered as an important topic strongly influencing human performance within complex systems [Citation1,Citation2]. Both excessive and low MWL can degrade human performance and trigger human error. The relationship between operators’ performance and MWL is similar to an upside down U shape where the best performance occurs at a level of reasonable task demand [Citation3]. For the purpose of a safe and an efficient operation, it is important to monitor operators’ MWL during the operation phase. Several methods have been developed to measure MWL and could be classified into three major categories: performance-based measures (e.g., primary-task and secondary-task measures), subjective measures [e.g., NASA-Task Load Index (NASA-TLX)] and physiological measures [e.g., eye blink, electroencephalogram (EEG) and heart rate] [Citation4]. Each group of measures has its strengths, weaknesses and applicability.
Subjective measures typically using rating scales after the end of operation, is not applicable to monitoring operators’ MWL during the operation phase dynamically. The “International Organization for Standardization” is attempting to standardize several physiological workload measurement methods, such as fatigue, monotony, satiation and vigilance, which are assigned to several effects induced by MWL. Miyake proposed a way to integrate different physiological parameters into a new index. Heart rate variability, finger plethysmogram amplitude and perspiration were used as physiological parameters. This multivariate workload evaluation index was proposed to characterize task-specific responses and individual differences in response patterns to mental tasks [Citation5]. Farmer and Brownson have successfully used “EEG” to classify the state of operator's MWL. But they also point out that the features of EEG data were high noise-to-signal ratio, and each data had to be calibrated and analyzed by researchers individually. Using EEG to classify MWL was not practical in real life [Citation6]. Some research works considered that physiological measures were very suitable for measuring real-time MWL since it could record the data continuously, and it was less intrusive on work activities in complex tasks [Citation4]. It was undeniably physiological measurements that often require the attachment of electrodes or certain form of physical sensors, and therefore they are not unobtrusive in the physical sense. Furthermore, the physiological response pattern is different from task to task; even in the same task, the response pattern may also differ from person to person. Because of the individual difference and task-specific problem, the physiological workload measurements are hard to analyze and to be applied to practical fields [Citation7].
When a workload predictive tool was developed for measuring MWL in practical fields, attention should be paid to fidelity, unobtrusiveness and non-intrusive. Fidelity and unobtrusiveness minimize threats to external validity, as natural conditions do not incur the artificiality inherent in a well-controlled laboratory setting. Non-intrusive measurements avoid the influence of natural state of the task and contaminate the measurement results. In this study, an objective, non-intrusive and performance-based MWL predict model was developed for application during the operation phase. This model was comprised of two novel cognitive indices, the “attention required index (ARI)” and “uncertainty index (UI)”, based on Rasmussen's skill–rule–knowledge framework, and is especially suitable for advanced workplaces [Citation8]. In addition, behavioral data and NASA-TLX questionnaire were gathered and analyzed systematically in a full-scale “advanced boiling water reactor” plant simulator in Taiwan. By comparing this novel model with NASA-TLX [Citation9], the efficiency was confirmed and validated. This model developed in this study could be the basis for establishing an early online warning system automatically. Finally, the characteristics, advantages and disadvantages of this model was further discussed and identified.
2. Method
According to Rasmussen [Citation8], the human behavior could be classified into three general categories, skill-, rule- and knowledge-based behavior (hereafter called the SBB, RBB and KBB) and distinguished by two critical factors (as shown in ). One is the degree of attentional resources exercised by the individual in his activities. From the single resource theory standpoint, the cognitive system has a single pool of limited capacity and is constrained by some bottlenecks in biological constitution. Attention is a particularly important factor in this cognitive bottleneck, especially in identifying the situation correctly and knowing the correct rules to apply [Citation10]. SBB refers to highly automated actions taking place without attentional resources. Otherwise, attentional resources are needed for RBB and KBB to release the pre-packaged units of behavior and improvisation in unfamiliar situations.
Figure 1. Skill-, rule- and knowledge-based behaviors are distinguished by attention required and uncertainty of situation.
The other critical factor is the level of familiarity with an executable task that the operator encounters. When operators interact with systems, there is a need to understand what is currently happening and what is likely to happen next. Without the support of various approved procedures and training, fear of the unfamiliar and situational stress may have a negative effect on operators’ judgments and cognitive abilities. The Fukushima nuclear accident was a high-surprise event; the operators were caught in response situations where previous training, established tactics and procedures did not exist [Citation11]. KBB is a characteristic of unfamiliar and novel situations. Otherwise, SBB and RBB are applied in a familiar situation that is typically controlled by a stored rule or procedure that has been created through previous experience.
We assume that, for a given task, the ARI can be defined as the ratio of the amount of RBB and KBB operating time (ΣTRBB + ΣTKBB) to the amount of SBB, RBB and KBB operating time (ΣTSBB + ΣTRBB+ ΣTKBB), as shown in EquationEquation (1)(1)
(1) . ARI identifies the density of behaviors for which attention is required in a specific task, reflecting the need for cognition resources. The UI can be defined as the ratio of KBB operating time (ΣTKBB) to SBB, RBB and KBB operating time (ΣTSBB + ΣTRBB + ΣTKBB) as shown in EquationEquation (2)
(2)
(2) . UI identifies the density of behaviors that are performed in unfamiliar situations, reflecting the amount of risk and proneness to error of specific tasks. A relationship may exist between the presentation of ARI and UI, but the meanings and nature of ARI and UI are not the same exactly. For example, much cognition resources are needed for operators to perform complex tasks (high ARI) according emergency operation procedures (low UI) under heavy time pressure.
(1)
(1)
(2)
(2) where TSBB, TRBB and TKBB refer to the operating time of SBB, RBB and KBB.
2.1. Participants and scenarios
Eighteen participants (six crews) had completed formal training and were licensed nuclear power plant operators in Taiwan. Each crew contained one shift supervisor operator (SRO), one reactor operator and one assistant reactor operator. All participants were male and with good health. The mean age of the participants was 43.8 years old. Six scenarios were selected in order to fully reflect the range of activities performed by operators, such as monitoring, detection, diagnosis, planning and execution. Physical and functional fidelity should be addressed so that results can be generalized to the actual operation of a real situation. The six scenarios selected for the study are listed in . In this study, the positions of operation crews and scenarios were not viewed as variables or analyzed separately. The diversity of scenarios used and samples increased the representativeness of the study and the ecological validity. On the other hand, it also increased the variance of the data and the size of the standard error to produce significant results.
Table 1. List of six selected scenarios for this study.
2.2. Procedure and data collection
Objective and subjective data collected in this study were mainly from the human factor validation activities. Behavior data were collected mainly from four videos, located at four corner portions, and simulator recordings (showed in ).
Figure 2. Behavior data were collected mainly from four videos located at four corner portions.
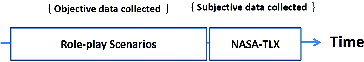
In scientific research, people are typically interested in the relative relationships between independent variables and dependent variables. Validation activity is not a test of theoretically derived hypotheses or a formal experiment. It is typically interested in establishing whether specific performance criteria are met or not, rather than focusing on relative relationships. The advantage of the validation activity is that it minimizes threats to external validity and emphasized on unobtrusiveness. These activities have predefined initial conditions, applicable symptoms, expected system responses and plant behaviors in scripts. The test operation crews were not aware of the specific scenarios before beginning a simulated scenario. Scenarios were run until a stable condition was reached, and post-scenario subjective workload was quantified with the NASA-TLX after each scenario (as shown in ). The NASA-TLX evaluates the operator workload using a weighted average of ratings on six dimensions of subscales, including the mental demand, physical demand, temporal demand, performance, effort and frustration [Citation9]. The participants are requested to identify the relative weighting for the six subscales based on their experience from 0 to 10.
Figure 3. Simplified illustration of the data collection processes.
2.3. Analysis
Scenarios, initial conditions and the main objective of operation were defined by both nuclear engineers and human factors engineers. of Supplemental data was one of the selected scenarios, anticipated transient without scram (ATWS), in this study. The ATWS is one of the worst case accidents, consideration of which frequently motivates the regulators and administrators to take regulatory action. The main activities of each crew member of scenario 3 are described in each box of of Supplemental data.
Behaviors were classified into SBB, RBB and KBB depending on the definition of Rasmussen [Citation8]. All work was done by three experts in the field of “human factors engineering (HFE)” each has at least five years’ experience in the nuclear fields and familiar with all the test scenarios. It is worth noting that expert judgments are widely used to support safety analyses consisting of classification, rank orders and numerical estimates. This method in support of human error, “probability reliability analysis” and “human reliability analysis” is pervasive. Sometimes the behaviors of the crew are not clearly of one particular type and may be of mixed types. HFE experts have to repeatedly watch the videos and discussed the behaviors in the context of scenarios. Furthermore, with the help of the flowchart derived from the “generic error modeling system (GEMS)” [Citation10] (as shown as ), each behavior was categorized as SBB, RBB and KBB consistently. The example of behavior classification of SRO in scenarios 3 is described in of Supplemental data.
Figure 4. Flowchart derived from generic error modeling system (GEMS) [Citation10].
![Figure 4. Flowchart derived from generic error modeling system (GEMS) [Citation10].](/cms/asset/68967c53-5be2-45a1-96c8-2476e9bbe4c4/tnst_a_1027156_f0004_b.gif)
Table 2. The results of Pearson-product moment correlation analysis.
After the classification, behavior types and corresponding executed time can be calculated. Operators’ workload can be quantified as ARI and UI and compared to the results of NASA-TLX. The NASA-TLX was selected as the reference measurement because it is applicable for supporting of the general prediction model for experienced workload [Citation12]. The correlation between the ARI, UI and the score of the NASA-TLX questionnaires was analyzed by the “Statistical Products and Services Solution”.
3. Result
Each participant completed all these six scenarios successfully. The analysis of Pearson-product moment correlation was used to examine the relationship between ARI, UI and NASA-TLX (including its six subscales). The results were shown in . The objective MWL indices (ARI and UI) were compared with the subjective MWL (NASA-TLX) and the six constituted subscales, respectively. For ARI, significant positive correlations were observed with the overall NASA-TLX (r = 0.506, p = 0.032) and the performance subscale (r = 0.514, p = 0.029). For UI, significant positive correlations were observed with NASA-TLX (r = 0.560, p = 0.016) and the frustration subscale (r = 0.78, p < 0.010); furthermore, significant negative correlations were observed with the physical demand subscales (r = −0.985, p < 0.000), temporal demand subscales (r = −0.704, p = 0.001) and effort subscale (r = −0.496, p < 0.036).
Furthermore, the relationship between the objective workload indices (ARI and UI) and subject workload index (NASA-TLX) was modeled using a multiple regression analysis. A detailed understanding of this relationship can be gathered from .
Table 3. The results of multiple regression analysis.
The results reflected in indicated that R-square of this model was 0.51 (adjusted R-square was 0.45). The experimental results indicated that ARI (t = 2.47, p = 0.03) and UI (t = 2.81, p = 0.01) were the significant predictors in predicting the workload. Given the values of ARI and UI, a workload predictive model was expressed by EquationEquation (3)(3)
(3) :
(3)
(3) where x1 and x2 are the value of ARI and UI.
4. Discussion and conclusion
4.1. Working in advanced workplaces
The significant positive correlations between ARI and the performance subscale indicated that operators felt more satisfied in performance when more attention was paid to the tasks. As mentioned previously, each participant had completed all these six scenarios successfully. According to Yerkes--Dodson inverted-U relationship, the tasks may be relatively simple to operators [Citation13]. Differences in UI levels reflect different operation strategies. One is a precise decision-making approach (low UI); the other is a trying-and-modifying approach (high UI). Operators who apply the precise decision-making approach mainly expend their cognitive resources and time on gathering information to understand the current situation before making decisions. Therefore, their physical demands, temporal demands and effort subscores are relatively higher than those of operators who understand a situation through the trying-and-modifying approach. On the other hand, their frustration levels are relatively lower than those of operators who apply the trying-and-modifying approach.
4.2. The basis for establishing an early online warning system
MWL is a critical factor that may impact the operating performance. The human error cannot be totally eliminated during operation as long as people are involved. Prevention is always better than cure. That is to say, unobtrusiveness, non-intrusive and online methods are needed in high-risk and complex environments. Many methods were applied to assess the validity of newly-developed measurements and “criterion-related validity” is the most common one. Criterion-related validity refers to the degree to which a newly-developed measurement can accurately predict specific criterion variables that are reflected by other approved measurement. In this study, significant positive correlation relationship (adjusted R-square was 0.45 at 95% confidence interval) was observed between the MWL scores which inferred from our model and measured by NASA-TLX. It can be concluded that our newly-developed MWL predicts model with high validity.
This model could be the basis for establishing an early online warning system in advanced workplaces. With the application of artificial neural network or fuzzy theory, computers could be trained to recognize and classify human behavior patterns. In the beginning, a lot of behavior data and their categories should be fed to system to establish relationships and differences among SBB, RBB and KBB. After the categories of behavior were identified, corresponding executed time could be tagged and calculated simultaneously. Then, operator workload could be calculated automatically to predict performance without interference and being intrusive. This kind of information is expected to provide both managers and supervisors with a reference value of the operator online performance.
4.3. To predict the categories of human error
Another advantage of this model is to predict the categories of human error that may arise in operation according to the GEMS proposed by Reason [Citation10]. Such cue provides managers with opportunities to intervene and improve before errors occur. High ARI may imply that sufficient resources are unavailable, operators cannot keep up with the tasks, or are unable to arrive at a correct diagnosis. It is expected that the natural course of information processing will tend to become disrupted, and the error of misapplied rules (misapplication of good rules, the application of bad rules or the failure to apply a good rule), or misdiagnosis (insufficient knowledge, or incorrectly expected to work) could be easy to take place [Citation10,Citation14]. These kinds of cognitive errors could be classified as rule-based and knowledge-based mistake.
Not all dangers and possible scenarios can be anticipated in order to develop appropriate guidelines and procedures. Even training is unable to anticipate all possible situations that can be encountered. In real situation, when operators interact with the system, there is a need to understand what is currently happening and what is likely to happen next. A high UI indicates that operators are faced with an unfamiliar and ambiguous situation, failures may have occurred in judgmental, inferential and evaluation processes due to knowledge deficits, known as knowledge-based mistakes [Citation10]. An internal study of errors across the nuclear industry revealed that 25% of errors were skill-based error, 60% were rule-based errors and 15% were knowledge-based errors [Citation15].
Knowledge is reflected both in how well situations are diagnosed and the quality of the chosen solutions. Adequate knowledge relies on training, experience and availability of updated situational information. Knowledge-based mistakes are even more dangerous, practically inevitable and difficult to recover. Because the person committing the mistake believes that she/he is doing the correct thing and thus carries on with the action, often despite a growing number of signs showing that things are not going right [Citation14,Citation16]. In addition, problem-solving knowledge and knowledge-based mistakes can arise from the same mental resources, as they are based on the individual's unique mental model of the system and his or her reasoning process. It is especially hard to predict a mistake and tell one from another.
4.4. Future study
Our study results show that both ARI and UI have significant positive correlations with the results from NASA-TLX. Further research is needed to understand the essence of ARI and UI. After the predictive model was constructed, the reliability of the model is needed to be further validated and modified. More data from practical applications in different fields, such as the military and aviation are needed to increase the applicability of this model.
Supplemental data
Supplemental data for this article can be accessed here.
Supporting_information
Download MS Word (140.1 KB)Disclosure statement
No potential conflict of interest was reported by the authors.
References
- Rouse WB, Geddes ND, Curry RE. An architecture for intelligent interfaces: outline of an approach to supporting operators of complex systems. Humcomput Interaction. 1987;3:87–122.
- Xie B, Salvendy G. Review and reappraisal of modeling and predicting mental workload in single- and multi-task environments. Work Stress. 2000;14:74–99.
- Rubio S, Díaz E, Martín J, Puente JM. Evaluation of subjective mental workload: a comparison of SWAT, NASA-TLX, and workload profile methods. Appl Psychol. 2004;53:61–86.
- Wilson GF, Russell CA. Real-time assessment of mental workload using psychophysiological measures and artificial neural networks. Hum Factors. 2003;45:635–43. Epub 2004
- Miyake S. Multivariate workload evaluation combining physiological and subjective measures. Int J Psychophysiol. 2001;40:233–238.
- Farmer E, Brownson A. Review of workload measurement, analysis and interpretation methods. Brussels: European Organisation for the Safety of Air Navigation; 2003. (no. CARE-Integra-TRS-130-02-WP2).
- Turner JR. Cardiovascular reactivity and stress: patterns of physiological response. New York (NY): Plenum, Modeling Stress and Assessing Reactivity in the Laboratory; 1994. p. 51–53.
- Rasmussen J. Skills, rules, and knowledge; signals, signs, and symbols, and other distinctions in human performance models. IEEE Trans Syst Man Cybernetics. 1983;SMC-13:257–266.
- Hart SG, Staveland LE. Development of NASA-TLX (Task Load Index): results of empirical and theoretical research. Hum Ment Workload. 1988;1:139–183.
- Reason J. Human error. Cambridge: Cambridge University Press; 1990. p. 255–260.
- Samuels RJ. 3.11: disaster and change in Japan. Ithaca (NY): Cornell University Press; 2013. p. 7–10.
- Nygren TE. Psychometric properties of subjective workload measurement techniques: implications for their use in the assessment of perceived mental workload. Hum Factors. 1991;33:17–33.
- Huey FM, Wickens CD. Workload transition: implications for individual and team performance. Washington (DC): National Academy Press; 1993. p. 32–54.
- Mannan S. Human factors and human error: Lees' process safety essentials. Oxford: Butterworth-Heinemann; 2014. p. 143–154.
- DOE Standard. Chapter 2, Human performance improvement handbook volume 1: concepts and principles. Washington (DC): US Department of Energy AREA HFAC; 2009. p. 22–25.
- Woods DD. Modeling and predicting human error. Human performance models for computer-aided engineering. San Diego (CA): Academic Press; 1990. p. 248–274