
 ?Mathematical formulae have been encoded as MathML and are displayed in this HTML version using MathJax in order to improve their display. Uncheck the box to turn MathJax off. This feature requires Javascript. Click on a formula to zoom.
ABSTRACT
If any severe accident occurs, application of the Severe Accident Management Guidance (SAMG) is initiated by the Technical Support Center (TSC). In order to provide advisory information to the TSC, required safety injection flow rate for maintaining the coolability of the reactor core has been suggested in terms of the depressurization pressure. In this study, mechanistic development of the safety injection flow map was performed by post-processing the core exit temperature (CET) data from MELCOR simulation. In addition, effect of oxidation during the core degradation was incorporated by including simulation data of core water level decrease rate. Using the CET increase rate and core water level decrease rate, safety injection flow maps required for removing the decay and oxidation heat and finally for maintaining the coolability of the reactor core were developed. Three initiating events of small break loss of coolant accidents without safety injection, station black out, and total loss of feed water were considered. Reactor coolant system depressurization pressure targeting the suggested injection flow achievable with one or two high pressure safety injections was included in the map. This study contributes on improving the current SAMG by providing more practical and mechanistic information to manage the severe accidents.
1. Introduction
1.1. Background
Recommended by the International Atomic Energy Agency (IAEA), general state of a nuclear power plant is classified as operational states and accident conditions, whose detailed category is shown in [Citation1]. In the operational states, any significant damage to safety features is not expected to occur during the normal operation and anticipated operational occurrences. On the other hand, convention accident conditions consist of Design Basis Accident (DBA) and severe accident. However, taking only these two accident conditions is insufficient in bounding all possible accidents. Rather complete categories have been built, where accidents conditions which are not explicitly considered DBAs but which are encompassed by them were added before the DBA. In addition, beyond DBAs (BDBAs) without significant core degradation was envisioned between the DBAs and severe accidents [Citation2].
Table 1. States of nuclear power plant recommended by IAEA [Citation1].
Conventional reactor protection and safety systems were designed and built to cope with the DBAs. Since the severe accidents in Fukushima Daiichi nuclear power plants, however, upgrade of the nuclear power plant has been in progress by including severe accident mitigation systems such as core catcher system and filtered containment venting system (FCVS). As of now, rather lack of reliable and comprehensive Severe Accident Management Guidance (SAMG) may be the one which concerns for the safety of nuclear power plant. Thus, in this study, a great deal of interest is focused on the SAMG and its improvement. The SAMG has been developed by owners group such as Westinghouse Owners Group (WOG), Combustion Engineering Owners Group (CEOG), and OECD/NEA, to mention a few. In Korea, SAMG for Optimized Power Reactor (OPR1000) has been developed through the Individual Plant Examination (IPE), Probabilistic Safety Analysis (PSA), Technical Basis Report of electric power research institute (EPRI), Nuclear Regulatory Committee (NRC) reports, and research results related to the WOG SAMG [Citation3]. Total seven mitigation strategies are suggested for severe accident management and shows the schematic flow chart of the proposed SAMG strategies. The strategies are performed using several measurable parameters such as steam generator water level, reactor coolant system (RCS) pressure, core exit temperature (CET), containment water level, and hydrogen concentration. Accordingly, operators have to monitor the behavior of these parameters very closely. SAMG will be terminated if the parameters satisfy the fixed conditions indicating that the reactor state is back to the coolable state. Development of SAMG requires tremendous efforts in various aspects of experiment, theoretical modeling, and computational simulation. Due to the limited time and expense, however, severe accident analysis with appropriate codes may be effective in continuing the improvement efforts. Following section summarizes several studies of severe accident simulation to provide up-to-date information.
Figure 1. Flowchart of OPR1000 SAMG.
1.2 State-of-the-art of severe accident simulation
Several severe accident simulations were carried out with severe accident analysis codes such as MELCOR, SCDAP/RELAP5, MAAP, and ASTEC. Vierow et al. investigated the station black out (SBO) scenario with no auxiliary feed water of Zion nuclear power plant using MELCOR, SCDAP/RELAP5, and MAAP [Citation4]. In addition, large break loss of coolant accident (LBLOCA) and SBO scenarios for boiling water reactor (BWR) using the same codes [Citation5]. Park et al. studied the effect of SAMG entry condition and evaluated the RCS depressurization strategy using SCDAP/RELAP5 [Citation6–Citation8]. MAAP code has been predominantly used by industrial side for its ability of fast calculation. However, it has not been selected as the legitimate code for severe accident analysis to the general regulatory body. MELCOR code has been developed by Sandia National Laboratory and has been selected by the NRC as a legitimate tool for PSA Level 2. Using MELCOR 1.8.5, bleed and feed strategy of SAMG was simulated for Kuosheng BWR [Citation9]. Also cavity flooding strategy of SAMG was closely analyzed through comparison of lower head critical heat flux correlation using MELCOR [Citation10]. Severe accident mitigation strategies such as RCS depressurization and external reactor vessel cooling were assessed for postulated SBO [Citation11]. Recently, Lee et al. investigated the RCS depressurization strategy and established a concept to build a core coolability map for small break loss of coolant accident (SBLOCA) without safety injection (SI), SBO, and total loss of feed water (TLOFW) [Citation12]. Also Seo et al. studied effectiveness and adverse effects of RCS depressurization strategy with various SAMG entry conditions [Citation13]. In Europe, ASTEC was used to verify the severe accident management strategy. Stefanova et al. evaluated the SAMG strategy for VVER 1000 [Citation14]. In addition, SAMG strategy was simulated for VVER-1000 using ASTEC [Citation15,Citation16]. As such, several severe accident scenarios have been analyzed using the severe accident codes. However, there is still lack of data for improving SAMG. summarizes the recent severe accident analysis using various severe accident analysis codes.
Table 2. A summary of severe accident analysis.
1.3. Objectives
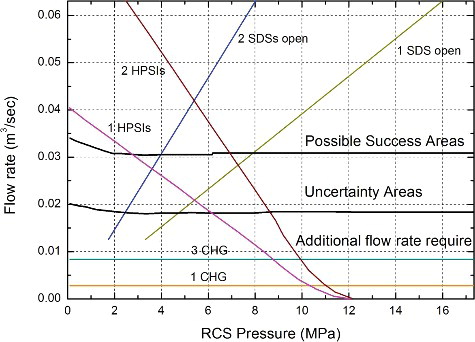
The third mitigation strategy of SAMG is the coolant injection into the RCS. shows the SI flow map implemented in the current SAMG of the OPR1000. The map provides success criteria for the reactor core recovery by the RCS pressure when high pressure safety injections (HPSIs), safety depressurization system (SDS), and charging pump (CHG) are available. Decay heat is input as the major heat source to remove. However, additional heat sources by oxidation reaction between cladding, structure, control rod, and hot steam were not considered. Since significant oxidation heat is generated during the progression of the severe accident, it is necessary to incorporate such additional heat sources for the practical SI flow map. The reliable parameters reflecting the reactor core overheat were CET and the reactor core water level. In our previous study, only the CET increase rate was considered in developing an SI flow map. Recently, however, it was found that oxidation heat generated is proportional to the core water level decrease rate. Thus, a new SI model has been suggested with inclusion of the CET increase rate and core water level decrease rate.
Figure 2. RCS SI flow map in OPR1000 SAMG.
Thus the objective of this study is to develop a mechanistic SI model using the CET and core water level data obtained from the MELCOR code simulation. In parallel, an SI flow rate map is developed using the SI model developed and the flow rate–pressure curve with operation of one HPSI or two HPSIs. MELCOR code 1.8.6 was employed to simulate SBLOCA, SBO, and TLOFW, in which respective CET increase rate and core water level decrease rate were obtained. Resulting SI flow map includes the SI model with the target RCS depressurization pressure allowing the required flow rate.
2. Simulation descriptions
2.1. MELCOR description
MELCOR is a state-of-the-art severe accident simulation code, which enables to simulate the progression of the severe accidents in light water reactors such as pressurized water reactor (PWR) and BWR. Several versions of MELCOR code have been developed by the Sandia National Laboratories for plant risk assessment and source term analysis since 1982. In this study, MELCOR version 1.8.6 is utilized for the fulfillment of addressed objectives. This code is to treat the entire spectrum of severe accident phenomena, including RCS and containment thermal-hydraulic response, core heat-up, degradation and relocation, and fission product release and transport, in a unified framework for both PWR and BWR [Citation17,Citation18]. MELCOR code is mostly used by regulatory body and academic researchers to evaluate strategies for severe accident mitigation and to simulate detailed features of severe accident sequences [Citation19–23]. In Korea, for a successful severe accident management, an AtomCARE code has been developed for collection of SAMG variables connecting plant monitoring program with MELCOR [Citation24]. In addition, an RISARD code based on risk informed severe accident diagnosis and prognosis utilizes MELCOR code results for database buildup [Citation25].
2.2. MELCOR input model of OPR1000
The reference nuclear power plant (NPP) at current interest is Korean OPR1000, which consists of two loops of Nuclear Steam Supply Systems (NSSS). It is an evolutionary design of Combustion Engineering PWR, whose nominal electrical output is 1000 MWe. shows MELCOR nodalization for input model of OPR1000. The input model consists of a core (control volume (CV) 170), a downcomer (CV 130), a lower plenum (CV 150), a upper plenum (CV 260), four cold legs (CV 380, 390, 480, 490), two hot legs (CV 310, 410), a pressurizer (CV 500), two steam generators (CV 330, 337, 600, 610, 430, 437, 700, 710), and four safety injection tanks (SITs) (CV 382, 392, 482, 492). The pressurizer is equipped with two SDS valves and pressurizer safety relief valve (PSRV). PSRV opening point is the RCS pressure of 17.24 MPa and the closing point is 14.1 MPa. The SITs are identical to the accumulators of Westinghouse type PWR. SITs are activated when RCS pressure decreases to 4.3 MPa. The secondary side of the steam generator includes main steam isolation valves (MSIVs), main steam safety valves (MSSVs), eight condenser dump valves (CDVs) or four CDVs/loop, and four atmospheric dump valves (ADVs) or two ADVs/loop for the secondary depressurization.
Figure 3. MELCOR nodalization for OPR1000.
shows the core nodalization for MELCOR calculation. The core is divided into 7 radial rings and 14 axial levels. The lower plenum consisting of eight radial rings is from first axial level to third axial level. The active fuel region is from 4th axial level to 13th axial levels. Fourteenth axial level of core cell models upper region of fuel assembly. The lower plenum allows seven penetrations and hemispheric lower head type is optioned.
Figure 4. MELCOR nodalization for reactor core of OPR1000.
2.3. Hypothesized initiating events
SBLOCA, SBO, and TLOFW were selected for evaluating the SI model. The three initiating events yielded the highest probability of transitioning into severe accidents [Citation26]. In SBLOCA case, a 1.35 inches break on a cold leg was assumed. HPSI and low pressure safety injection (LPSI) were assumed inactive following the SBLOCA. In SBO case, it was assumed that all off-site power and secondary feed water were stopped. In TLOFW case, all secondary feed water systems were stopped and HPSI and LPSI were assumed inactive. These three cases caused the overheating of reactor core. Therefore, the SI was needed for these three cases.
3. Results and discussion
Total three accident scenarios were investigated using MELCOR 1.8.6. Among these, three cases of SBLOCA without SI, SBO, and TLOFW were simulated as base cases. As mentioned above, a cold leg break has been assumed for SBLOCA without SI scenarios. In the case of SBO, the off-site power was assumed lost. For TLOFW case, MFW and AFW are unavailable. The emergency core cooling by active SI is assumed unavailable for all cases. MELCOR simulations continued till the occurrence of reactor pressure vessel (RPV) failure.
3.1. Steady state
In the current MELCOR simulation, a steady state calculation has been performed to verify the suitability of the nodalization of OPR1000. Nominal operating conditions of OPR10000 are available in the FSAR [Citation27]. shows the comparison of the operating conditions and steady-state calculation results of the OPR1000. It is observed that MELCOR results are in good agreement with the nominal operating conditions, which confirms the suitability of MELCOR nodalization.
Table 3. Design value and steady-state condition of OPR1000.
3.2. Base cases
shows MELCOR results for the base cases without any operator actions aiming for accident mitigation. The accidents were initiated by receiving a reactor trip signal from the pressurizer for LOCA, the loss of power signal for SBO, and steam generator for TLOFW at time = 0. SBO and TLOFW scenarios are typically categorized as high pressure sequence, in which PSRV opens passively on account of high RCS set point. With the unavailable emergency core cooling system (ECCS) and secondary side cooling, CET reaches the SAMG entrance point of 649 °C (922 K). The reactor core is then degraded due to insufficient core cooling and the molten core is relocated to the lower plenum. RPV failure occurs by penetration or creep-rupture in the cases of SBO and TLOFW. SITs are passive means of injecting borated water, which is actuated by the RCS pressure set point of 4.3 MPa. Through the simulation results for SBO and TLOFW, it is evaluated that SITs are not actuated until occurrence of RPV failure due to high pressure. In the case of SBLOCA, however, SITs are actuated after molten pool formation. Unlike the SBO and TLOFW, in the SBLOCA, the overheated lower head could be cooled down by the coolant injected from the SITs. As a result, a longer interval between the UO2 relocation to the lower head and RPV failure was observed. RCS pressures at the time of RPV failure are estimated as 5.42, 16.22, and 16.62 MPa in the cases of SBLOCA, SBO, and TLOFW, respectively. Since the pressure at the time of RPV failure is higher than SAMG target pressure of 2.86 MPa, there exists a possibility of high pressure melt eject (HPME) phenomenon. Available times for applying in-vessel retention strategies for a prevention of the reactor vessel failure were estimated as 5.82, 3.78, and 2.30 hr for SBLOCA, SBO, and TLOFW, respectively.
Table 4. Major accident sequences in the base case.
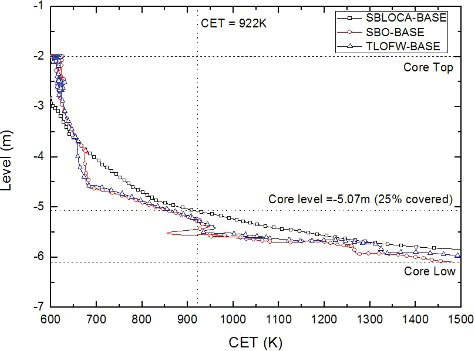
SAMG is initiated when CET reaches 922 K, which is the point where the core uncovery is progressed by 75% [Citation28]. Thus it is of importance to ascertain the logic determined for SAMG entry point before proceeding to further calculation. shows core water level with respect to CET for the base cases of SBLOCA, SBO, and LOFW. It is expected that core water is subject to depletion with accident time evolution, where evaporation of water directly impacts the decrease of water level, generation of oxidation heat, and thereby the increase of CET. As observed in , the water level at CET = 922 K shows a quarter of full core height, which is equivalent of 75% core dry out. This confirms that current MELCOR simulations are deemed reliable.
Figure 5. Behavior of reactor core water level with respect to CET for base cases.
shows the RCS pressure for base cases. For SBLOCA case, the RCS pressure decreased sharply, and reactor trip signal is transmitted at 0.04 hrs. The pressure increased up to 14 MPa since the reactor coolant pump was tripped at 0.06 hours. Since then the pressure gradually decreased because of break flow. Since the steam generator was dried out, the coolant was transformed into vapor and the vapor increased pressure after 1.74 hrs. As the coolant of SITs was injected, the pressure increased at 3.64 and 5.13 hrs. In the cases of SBO and TLOFW, after the secondary cooling was unavailable at 1.04 and 0.27 hrs, the RCS pressure increased. After the PSRV was opened, the pressure increased and decreased repeatedly by the PSRV open and close at 17.24 and 14.1 MPa, respectively. The RCS pressure fluctuated depending on the transformed vapor and the coolant loss through the break and the PSRV.
Figure 6. Behavior of RCS pressure for base cases.

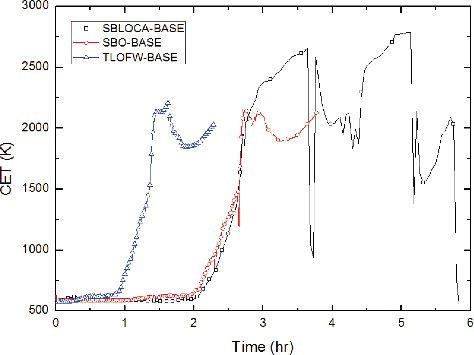
and show the RCS water level and CET for the base cases. It is observed that the water level and CET maintained relatively constant level as long as secondary cooling is available. After the steam generators are dried out, however, the core water level decreased and the CET increased rather abruptly. When the oxidation reaction between core metals and high temperature steam initiated, there has been a significant increase in the water level decrease rate and CET increase rate. In case of SBLOCA, the CET momentarily decreased due to SITs injection at 3.64 and 5 hrs, which delayed RPV failure significantly. However, in cases of TLOFW and SBO, the SITs injection was not actuated because RCS pressure maintained the higher pressure than the SIT actuation pressure during all accident sequences. As a result, no effect of SIT on the delayed RPV failure was expected.
Figure 7. Behavior of reactor core water level for base cases.
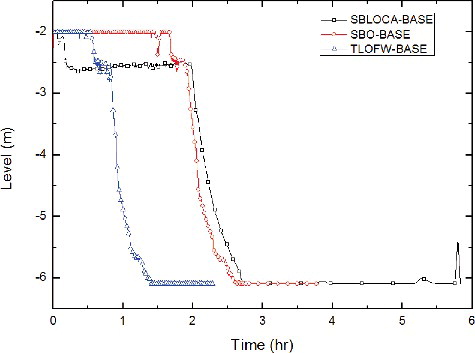
Figure 8. Behavior of CET for base cases.
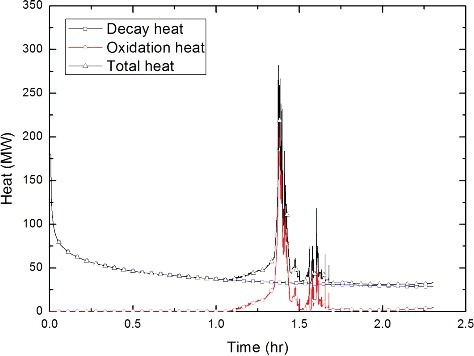
The major heat sources generated in the core are the decay heat and oxidation heat. – show the time-dependent heat generation of both heat sources for three cases. Since the reactor trip, decay heat starts to generate and exponentially decreases with time. On the contrary, oxidation heat is generated from the oxidation reaction between the core metal materials (e.g., zircaloy cladding, steel structures, B4C, etc.) and hot steam. Thus if reactor core maintains coolability, no oxidation heat is generated. However, if metal materials are exposed to high temperature conditions during the degradation of the core, significant heat is generated. Major contribution to the oxidation heat sources is from the oxidation reaction of zircaloy cladding and hot steam. In this particular reaction, exothermic oxidation occurs when the cladding temperature exceeds 1100 K. As a result, significant amount of oxidation heat and hydrogen are generated through the reactions as shown in EquationEquations (1)(1)
(1) and (Equation2
(2)
(2) )
(1)
(1)
(2)
(2)
Figure 9. Oxidation and decay heat generation during SBLOCA scenario.
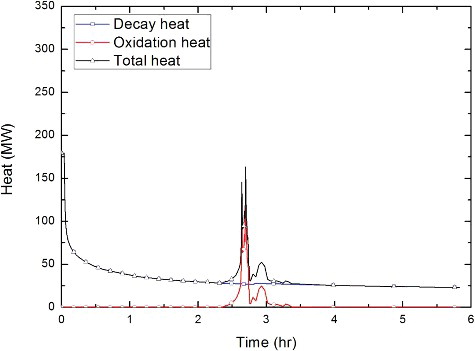
Figure 10. Oxidation and decay heat generation during SBO scenario.
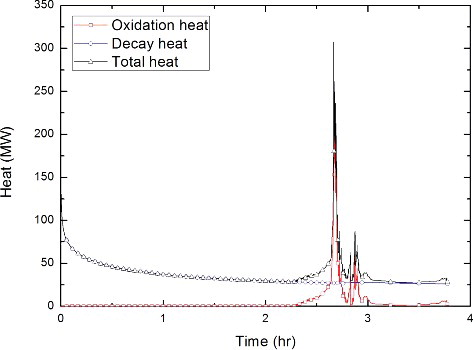
Figure 11. Oxidation and decay heat generation during TLOFW scenario.
Although not predominant, reactions of steel material and hot steam contribute to additional oxidation heat sources. Typical reactions are shown in EquationEquations (3)(3)
(3) –(Equation6
(6)
(6) )
(3)
(3)
(4)
(4)
(5)
(5)
(6)
(6)
Contribution of the decay heat is dominant in the early phase of the accident but abrupt oxidation heat is added during the core degradation, in which fuel is melted and molten core is relocated to the lower head of the RPV. Therefore, for the successful in-vessel retention, SI associated with appropriate RCS depressurization should be performed considering both heat sources of decay and oxidation heat.
3.3. Development of safety injection flow map
Development of SI flow map is one of the main objectives in this study. Here, the SI flow map refers to the graphical mapping of the SI flow rate to maintain the reactor core coolable as a function of CET. Since the amount of SI flow achievable through the ECCS can be governed by the RCS pressure, an SI flow map associated with the target depressurization has been developed. It is generally true that CET can be credited as the most reliable parameter in diagnosing the thermal state of the reactor core and water level information is useful for determining the vaporization of the core inventory [Citation29]. Note that CET is measured by K-type thermocouple and the maximum measurable temperature is up to 1500 K. Thus an SI model was developed using the CET and water level information obtained from the MELCOR simulations. Later this SI flow model was combined with the target depressurization using the characteristic high pressure pump curves.
3.3.1. Safety injection flow model
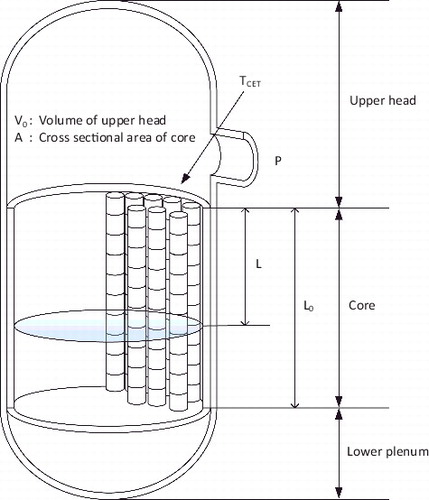
shows a simplified reactor pressure vessel helping model the SI flow. TCET is CET acquired from the position 13 cm off the reactor core exit by K-type thermocouples and PRCS is RCS pressure, A is cross sectional area of upper head, V0 is volume of the upper head, and L is height of the uncovered core. The heat generated in the core is converted to the forms of the latent heat of the water and the sensible heat of the vapor. Superposition of these two is written in EquationEquation (7)(7)
(7)
(7)
(7)
Figure 12. A simplified reactor pressure vessel for SI flow model.
It was deduced that emerging latent heat rate is proportional to the decrease rate of the reactor core water level. In addition, CET increase rate can reasonably represent the rate of superheated steam mass under the severe accident conditions. For calculating , the idea gas equation was used in EquationEquation (8)
(8)
(8) . Using this observation, EquationEquation (7)
(7)
(7) can be modified as EquationEquation (9)
(9)
(9)
(8)
(8)
(9)
(9)
Heat removal by the injected flow typically at liquid phase should be considered. Thus the minimum injected flow rate can be estimated by dividing the total heat by the difference of the saturated steam enthalpy (hsat,g) and injected water enthalpy (hinj) and resulting formula is given in EquationEquation (10)(10)
(10)
(10)
(10)
Inserting EquationEquations (9)(9)
(9) and (Equation10
(10)
(10) ) into EquationEquation (8)
(8)
(8) results in EquationEquation (11)
(11)
(11) as a function of core water level decrease rate and CET increase rate, whose data are directly obtained from the MELCOR simulation. It should be noted that core water level decrease rate and CET increase rate are estimated in the time interval from the onset of core dry out to the maximum detectable CET by K-type thermocouple
(11)
(11)
Since the core inventory is assumed depleted, amount of water to refill the core inventory should be considered. Thus the final required flow rate for maintaining the core coolability becomes the superposition of minimum required flow rate (EquationEquation (11(11)
(11) )) and amount of refilling water as shown in EquationEquation (12)
(12)
(12) , where trefill is the time taken for refilling (0.66 hr), A is the cross sectional area of core, and Lo is the core total height
(12)
(12)
3.3.2. RCS safety injection flow map
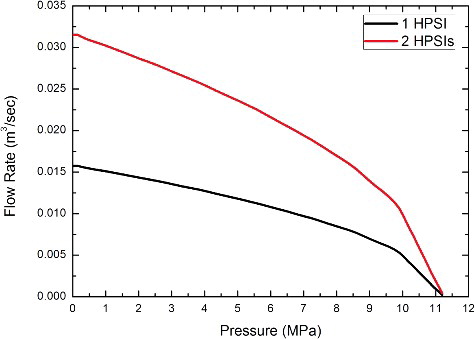
Development of the RCS SI flow map is aimed to guide the appropriate SI flow with realistic injection mean such as HPSI systems. For the feasible SI, on the other hand, RCS should be depressurized sufficiently to accommodate injection from one or two high pressure pumps. The amount of injection flow by the high pressure pump is determined by the characteristic pump curve. shows the characteristics pump curve by an HPSI and two HPSIs. Thus coupling the SI flow model developed with characteristic pump curve renders the information of target RCS depressurization. As such, RCS SI flow map consists of the SI flow rate associated with the target depressurization.
Figure 13. Characteristic pump curve by one and two HPSIs.
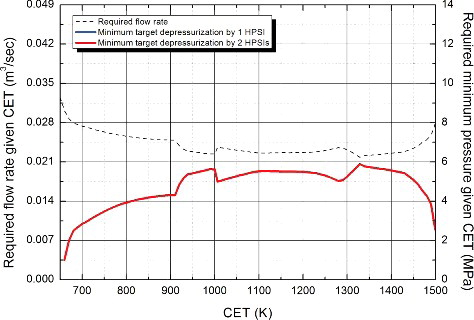
shows RCS SI flow map assisted by one and two HPSIs for the SBLOCA scenario. The required flow rates were estimated 0.017 m3/sec and the required RCS pressure was 8 MPa by operating two HPSIs, respectively, before the CET reached to 1300 K. After the oxidation reactions occurred, the required flow rate increased rapidly, at which one HPSI operation could not accommodate core recovery with CET exceeding 1500 K. Similarly to the SBLOCA scenario, shows the RCS SI flow map for SBO scenario. In this event, PSRV was the solely available component to remove the generated heat after the steam generators were dried out. Thus the required flow rates were estimated as 0.018–0.026 m3/sec, which is higher than that in SBLOCA scenario. To accommodate such flow rate with two HPSIs' actuation, RCS pressure needs to be depressurized below 4 MPa. Likewise the SBLOCA scenario, the oxidation heat increased rapidly since the CET reached 1500 K and thus the more RCS SI flow rate was needed to maintain the core cooling. Finally, shows the RCS SI flow map for the TLOFW scenario. In this event, the core was cooled down by the PSRV the same way as in the SBO scenario. The residual heat was estimated as the highest among the three cases. As a result, the required injection flow rate was the highest value of 0.035 m3/sec. Operation of one HPSI could not fulfill the core cooling and thus operation of two HPSIs was necessary to provide the required SI flow with target RCS depressurization below 6 MPa.
Figure 14. RCS SI flow map for SBLOCA scenario.
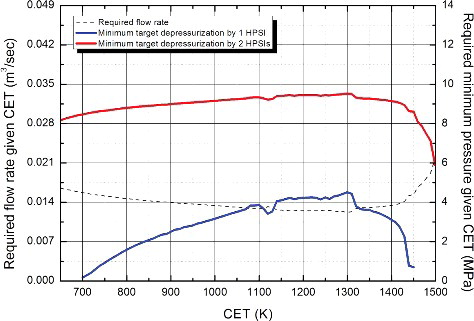
Figure 15. RCS SI flow map for SBO scenario.
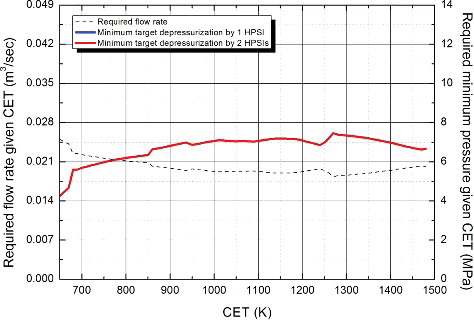
Figure 16. RCS SI flow map for TLOFW scenario.
The RCS injection flow model was verified using the MELCOR code. When the CET was 923 K, the coolant was injected into the core directly. The injection flow rates (IFR) were selected as 0.005, 0.015, 0.020, and 0.025 m3/sec for SBLOCA and SBO cases. In case of TLOFW, 0.028 m3/sec case was added to confirm the required IFR to recover the core level. shows the time of cladding melting and core recovery for the selected coolant injection. For SBLOCA case, the core was recovered and the cladding integrity was maintained when the IFR was 0.025 m3/sec. The verified IFR was higher than the RCS injection flow model because the model ignored released flow through the break. In the SBO and TLOFW cases, the required IFRs were 0.020 and 0.028 m3/sec. The results were similar to the RCS injection flow model.
Table 5. The time of cladding melting and core recovery for the selected coolant injection.
4. Conclusion
Severe accident analysis for SBLOCA, SBO, and TLOFW base cases for OPR1000 was performed using MELCOR 1.8.6. RCS SI flow map, which is a graphical mapping of the RCS SI flow model associated with target depressurization, was developed. Reactor core water level decrease rate and CET increase rate obtained from the MELCOR simulation with SBLOCA, SBO, and TLOFW were utilized in developing the RCS SI flow model. Developed RCS injection flow map is expected to contribute on assisting effective operator action over the course of severe accident management. Major findings and future work can be summarized as follows.
The RCS SI flow model was developed considering the decay heat and oxidation heat since the severe accident entrance condition. The model includes the parametric data of reactor core water level decrease rate and CET increase rate, which were calculated from MELCOR 1.8.6 simulation.
Amount of SI flow rate achievable by one or two HPISs was considered by employing characteristic pump curve. The target depressurization which enables the SI flow rate was estimated. As a result, RCS SI flow map, which is a resulting graphical combination of RCS SI flow model and target depressurization, was developed for the three cases of SBLOCA, SBO, and TLOFW.
RCS SI flow map developed in the current study is expected to assist the Technical Support Center (TSC) in effectively managing the severe accident because it utilizes the most reliable severe accident monitoring parameter of CET and RCS pressure.
In essence, the maps developed for respective SBLOCA, SBO, and TLOFW are expected to be useful in event-oriented severe accident management after the accident type is successfully diagnosed.
It cannot be ruled out that some of injected flow may bypass the reactor core. Thus as a future work, thermal-hydraulic behavior of the RCS needs to be investigated using the developed RCS SI flow map.
There exist some uncertainties not only in the numerical calculation of MELCOR code but also in some crucial models such as oxidation and cladding melting. Thus more vigorous sensitivity studies should be performed to use this model for official SAMG. Obviously this should be left for a future work.
| Nomenclature | ||
| Acronym description | = | |
| ADVs | = | atmospheric dump valves |
| BDBA | = | beyond data basis accident |
| BWR | = | boiling water reactor |
| CDVs | = | condenser dump valves |
| CEOG | = | Combustion Engineering Owners Group |
| CET | = | core exit temperature |
| CHG | = | charging pump |
| DBA | = | design basis accident |
| ECCS | = | emergency core cooling system |
| EPRI | = | electric power research institute |
| FCVS | = | filtered containment venting system |
| HPME | = | high pressure melt eject |
| HPSI | = | high pressure safety injection |
| IAEA | = | International Atomic Energy Agency |
| IFR | = | injection flow rate |
| IPE | = | Individual Plant Examination |
| LBLOCA | = | large break loss of coolant accident |
| LPSI | = | low pressure safety injection |
| MSIVs | = | main steam isolation valves |
| MSSVs | = | main steam safety valves |
| NRC | = | Nuclear Regulatory Committee |
| NSSS | = | Nuclear Steam Supply Systems |
| OPR1000 | = | Optimized Power Reactor 1000 |
| PSA | = | Probabilistic Safety Analysis |
| PSRV | = | pressurizer safety relief valve |
| PWR | = | pressurized water reactor |
| RCS | = | reactor coolant system |
| RPV | = | reactor pressure vessel |
| SAMG | = | Severe Accident Management Guidance |
| SBLOCA | = | small break loss of coolant accident |
| SBO | = | station black out |
| SDS | = | safety depressurization system |
| SITs | = | safety injection tanks |
| TLOFW | = | total loss of feed water |
| TSC | = | Technical Support Center |
Symbol subscript description unit
| A | = | cross sectional area of core (m2) |
| cp | = | specific heat (J/kg) |
| hfg | = | specific enthalpy of vaporization (J/kg) |
| hinj | = | specific enthalpy of injected coolant (J/kg) |
| hsat, g | = | specific enthalpy of saturated coolant (J/kg) |
| L | = | height of uncovered core (m) |
| = | decreasing rate of core water level (m/s) | |
| = | temporal vapor mass in the upper head and core (kg/s) | |
| = | minimum required flow rate (kg/s) | |
| = | required flow rate (kg/s) | |
| Mg | = | steam mass in core (kg) |
| = | molecular weight of water (kg/mol) | |
| PRCS | = | pressure of RCS (Pa) |
| = | total heat in the core (W) | |
| R | = | gas constant (J/Kmol) |
| trefill | = | refilling time (sec) |
| TCET | = | core exit temperature (K) |
| = | increasing rate of CET (K/s) | |
| ΔTCET | = | change of core exit temperature (K) |
| V0 | = | volume of upper head (m3) |
Greek symbol subscript description unit
| ρf | = | density of coolant (kgm3) |
Acknowledgements
This work was supported by the Nuclear Safety Research Program through the Korea Radiation Safety Foundation (KORSAFe); granted financial resource from the Nuclear Safety and Security Commission (NSSC), Republic of Korea [grant number 1403002]; National Research Foundation of Korea (NRF) grants funded by MISP [grant number NRF-2015M2A8A4021654].
Disclosure statement
No potential conflict of interest was reported by the authors.
References
- International Atomic Energy Agency. Operational limits and conditions and operating procedures for nuclear power plants. Vienna: International Atomic Energy Agency; 2000. (Report no. NS-G-2.2).
- International Atomic Energy Agency. Format and content of the safety analysis report for nuclear power plants. Vienna: International Atomic Energy Agency; 2004. (Report no. GS-G-4.1).
- Kim HC. Evaluation of the status of the accident management guidelines in Korea and foreign countries. Daejeon: Korea Institute of Nuclear Safety; 2013.
- Vierow K, Liao Y, Johnson J, et al. Severe accident analysis of a PWR station blackout with the MELCOR, MAAP4 and SCDAP/RELAP5 codes. Nucl Eng Des. 2004;234:129–145.
- Wang TC, Wang SJ, Teng JT. Comparison of severe accident results among SCDAP/RELAP5, MAAP, and MELCOR codes. Nucl Technol. 2005;150:145–152.
- Park R-J, Hong S-W. Effect of SAMG entry condition on operator action time for severe accident mitigation. Nucl Eng Des. 2011;241:1807–1812.
- Park R-J, Kim S-B, Hong S-W, et al. Detailed evaluation of coolant injection into the reactor vessel with RCS depressurization for high pressure sequences. Nucl Eng Des. 2009;239:2484–2490.
- Park R-J, Kim S-B, Kim H-D. Evaluation of the RCS depressurization strategy for the high pressure sequences by using SCDAP/RELAP5. Ann Nucl Energy. 2008;35:150–157.
- Huang IM, Ferng YM, Wang SJ. Validation of RCS bleed-and-feed strategy for the SAMG of the Kuosheng nuclear power plant. Nucl Technol. 2007;160:294–307.
- Martin-Fuertes F, Martin-Valdepenas JM, Mira J, et al. A MELCOR application to two light water reactor nuclear power plant core melt scenarios with assumed cavity flooding action. Nucl Technol. 2003;144:34–48.
- Song J, Huh C, Sun N. Improvement of molten core cooling strategy in a severe accident management guideline. Nucl Technol. 2012;178:258–266.
- Lee S, Ha KS, Kim H-Y, et al. Validation of RCS depressurization strategy and core coolability map for independent scenarios of SBLOCA, SBO, and TLOFW. J Nucl Sci Technol. 2014;51:181–195.
- Seo S, Lee Y, Lee S, et al. Effectiveness and adverse effects of reactor coolant system depressurization strategy with various severe accident management guidance entry conditions for OPR1000. J Nucl Sci Technol. 2015;52:695–708.
- Stefanova AE, Gencheva RV, Groudev PP. Analytical validation of operator actions based on SAMG for VVER 1000 with ASTECv2r3 computer code. Nucl Eng Des. 2015;281:131–141.
- Chatterjee B, Mukhopadhyay D, Lele HG, et al. Severe accident management strategy verification for VVER-1000 (V320) reactor. Nucl Eng Des. 2011;241:3977–3984.
- Atanasova BP, Stefanova AE, Groudev PP. VVER 1000 SBO calculations with pressuriser relief valve stuck open with ASTEC computer code. Ann Nucl Energy. 2012;46:121–127.
- Gauntt RO, Cole R, Hodge S, et al. MELCOR computer code manuals version 1.8.6. Washington (DC): US Nuclear Regulatory Commission; 2005.
- Boyack BE, Dhir VK, Gieseke JA, et al. MELCOR peer review (Report no. LA--12240). Los Alamos (NM): Los Alamos National Lab; 1992.
- Huh C, Suh N, Park G-C. Optimum RCS depressurization strategy for effective severe accident management of station black out accident. Nucl Eng Des. 2009;239:2521–2529.
- Wang T-C, Wang S-J, Teng J-T. Simulation of a PWR reactor vessel level indicating system during station blackout with MELCOR 1.8.5. Nucl Technol. 2006;156:133–139.
- Haste TJ, Birchley J, Richner M. Accident management following loss-of-coolant accidents during cooldown in a Westinghouse two-loop PWR. Nucl Eng Des. 2010;240:1599–1605.
- Bonelli A, Mazzantini O, Sonnenkalb M, et al. Station black-out analysis with MELCOR 1.8.6 code for Atucha 2 nuclear power plant. Sci Technol Nucl Install. 2012;2012:1–17.
- Birchley J, Haste TJ, Richner M. Accident management following loss of residual heat removal during mid-loop operation in a Westinghouse two-loop PWR. Nucl Eng Des. 2008;238:2173–2181.
- Sung G, Park J, Choi J. Development of the application scheme for the severe accident diagnosis/assessment code. Daejeon: Korea Institute of Nuclear Safety; 2013.
- Ahn K-I, Park S-Y. Development of a risk-informed accident diagnosis and prognosis system to support severe accident management. Nucl Eng Des. 2009;239:2119–2133.
- Park R-J, Kang K-H, Ha K-S, et al. Detailed analysis of a severe accident progression for an evaluation of in-vessel corium retention estimation in KSNP. Daejon: Korea Atomic Energy Research Institute; 2005. (Report no. KERI/TR/2959/2005).
- Korea Hydro & Nuclear Power. Shin Kori 1&2 final safety analysis report. Daejeon: Korea Hydro & Nuclear Power; 2008.
- International Atomic Energy Agency. Approaches and tools for severe accident analysis for nuclear power plants. Vienna: International Atomic Energy Agency; 2008.
- OECD/NEA. Core exit temperature effectiveness in accident management of nuclear power reactor. Paris: OECD/NEA; 2010.