
 ?Mathematical formulae have been encoded as MathML and are displayed in this HTML version using MathJax in order to improve their display. Uncheck the box to turn MathJax off. This feature requires Javascript. Click on a formula to zoom.
ABSTRACT
The sorption behavior of thorium (Th) onto granite and its major constituent minerals, feldspar, quartz and mica were investigated by batch sorption experiments. Experiments were carried out under variable pH and carbonate concentrations. Distribution coefficients (Kd) decreased with increased carbonate concentrations and showed the minimal value at around pH 10. This sorption tendency was seen for all the rock and mineral samples, and it was due to the formation of aqueous hydroxo–carbonate complexes of Th in the solutions. The order of sorbability for Th was mica > feldspar > quartz ≈ granite. The sorption behaviors of Th were analyzed by the non-electrostatic surface complexation model with the Visual Minteq computer program. The Kd for granite were calculated by component additivity approaches. The model calculations were able to explain the experimental results reasonably well. It was shown that the sorption behavior of Th onto granite can be explained by the complexation with the surface sites of mainly biotite and feldspar.
1. Introduction
For the geological disposal of radioactive waste, an implementer conducts the assessment and submits it to the regulator as a part of the application for obtaining a license to construct and operate a repository. The regulator is required to review the assessment efficiently and effectively. The Nuclear Safety Research Center of Japan Atomic Energy Agency, being responsible for supporting the regulatory activities, focuses research activities on features, events and processes that are highly correlated with the results of the safety analysis. Retardation of radionuclide migration by sorption onto a host rock in natural barrier systems is one of the important factors that influence the performance of a radioactive waste disposal system. Performance assessment calculations for hypothetical high-level radioactive waste (HLW) repositories [Citation1] show that 229Th which is a member of the neptunium series (4n+1) is one of the radionuclides dominating the long-term radiological hazard. Thorium exists only in the tetravalent oxidation state independent of the redox conditions of groundwater [Citation2,Citation3] and is often considered as an analog of other tetravalent actinide elements (U, Np and Pu) [Citation4,Citation5]. The dominant aqueous species of Th in reference groundwaters for the performance assessment [Citation1,Citation6] were estimated to be hydroxo–carbonate complexes from thermodynamic calculations [Citation7]. The carbonate concentrations in the modeled reference groundwaters are 3.4 × 10⁻³ mol dm−3 (fresh type) and 1.2 × 10⁻² mol dm−3 (saline type) [Citation6]. In the long term, the sorption behavior of Th would change because pH and carbonate concentration of groundwater is likely to be changed [Citation1,Citation7–10]. Hence, it is necessary to understand the sorption behavior of Th under variable groundwater conditions for a long-term safety assessment of geological disposal of HLW.
Granitic rock is considered as one of the candidate host rocks for the geological disposal of HLW [Citation1]. The sorption data of Th onto granitic rocks have been scarcely reported [Citation11], and the dependence of sorption on pH and carbonate concentration cannot be evaluated. For quartz, which is the major constituent mineral in granitic rocks, several sorption data for Th have been obtained [Citation12–14] and pH dependence of the sorption has been modeled [Citation4,Citation13]. However, the influence of carbonate on the sorption has not been clarified. For the other major constituent minerals of granitic rocks, feldspar and mica, sorption data of Th cannot be found.
In the present study, sorption data of Th onto granite were obtained by batch sorption experiments under variable pH and carbonate concentrations. The sorption data for major constituent minerals of granite were also obtained to discuss the sorption of Th onto granite. The sorption behaviors of Th onto the constituent minerals were analyzed by the surface complexation model (SCM) and those onto granite were analyzed by component additivity (CA) approaches [Citation15]. The sorption behaviors of Th onto some minerals have been analyzed by several SCMs such as the constant-capacitance model [Citation16,Citation17], the diffuse-layer model (DLM) [Citation13,Citation16,Citation18–20], the triple-layer model (TLM) [Citation21–26] and the non-electrostatic model (NEM) [Citation4,Citation16,Citation19,Citation27–30]. However, the model parameters for the constituent minerals of granite have been scarcely reported. In this study, the NEM assuming a 1-site surface complexation which needed the simplest parameters was employed.
2. Experimental
2.1. Experimental solutions
A Th stock solution was prepared by the following procedure. Thorium nitrate hydrate (232Th(NO3)4⋅nH2O, 4 ≤ n ≤ 5) was purchased from Fluka Chemika Co. One gram of Th(NO3)4⋅nH2O was dissolved in 10 cm3 volume of 0.1 mol dm−3 hydrochloric acid (HCl). Diluting 0.1 cm3 volume of the solution to 10 cm3 with 0.1 mol dm−3 HCl, Th stock solution was prepared (the concentration of Th is approximately 2 × 10⁻³ mol dm−3).
Three types of solutions, 0.01, 0.05 and 0.1 mol dm−3 sodium hydrogen carbonate (NaHCO3), were prepared in a controlled-atmosphere glove box under Ar to avoid dissolution of carbon dioxide gas from the atmosphere. The solubilities of Th in the NaHCO3 solutions were calculated by the Visual Minteq computer program using the existing thermodynamic data [Citation2,Citation3] () with the Davies equation for activity correction [Citation31]. The amorphous oxide (ThO2 (am, aged)) [Citation3] was assumed to be the solubility limiting solid. The calculation results for 0.01 and 0.1 mol dm−3 NaHCO3 solutions are shown in . Considering the solubility of Th, experimental solutions were prepared by adding the Th stock solution into the aforementioned NaHCO3 solutions, to get the concentration of 2 × 10⁻⁹, 4 × 10⁻⁹ and 2 × 10⁻⁸ mol dm−3 for the 0.01, 0.05 and 0.1 mol dm−3 NaHCO3 solutions, respectively. The initial concentrations of Th in the experimental solutions were determined by inductively coupled plasma mass spectrometry (ICP-MS, ELAN DRC, PerkinElmer Inc.) to be 2.0 × 10⁻⁹, 4.3 ×10⁻⁹ and 1.9 × 10⁻⁸ mol dm−3 for the 0.01, 0.05 and 0.1 mol dm−3 NaHCO3 solutions, respectively.
Figure 1. Solubility of Th in 0.01 mol dm−3 NaHCO3 solution (a) and 0.1 mol dm−3 NaHCO3 solution (b) calculated with existing thermodynamic data [Citation2,Citation3].
![Figure 1. Solubility of Th in 0.01 mol dm−3 NaHCO3 solution (a) and 0.1 mol dm−3 NaHCO3 solution (b) calculated with existing thermodynamic data [Citation2,Citation3].](/cms/asset/fa251835-aedc-4132-8a73-cead45d2c238/tnst_a_1138901_f0001_oc.jpg)
Prior to the sorption runs, blank tests were carried out to check for precipitation and colloid formation of Th at pH 8.5–11. A 10 cm3 volume of the Th solution was poured into a polypropylene test tube with a screw cap. After 2 weeks, a 2 cm3 aliquot was sampled and filtered through a 10,000 nominal molecular weight limit (NMWL) ultrafilter (USY-1, Toyo Roshi Kaisha, Ltd.) preconditioned with a small amount of the sample solution. The filtrate was sampled (0.5 cm3 for 0.01 and 0.05 mol dm−3 NaHCO3, or 0.2 cm3 for 0.1 mol dm−3 NaHCO3) and diluted to 3 cm3 with 5% HNO3. The concentrations of Th were determined by ICP-MS. It was confirmed that the Th concentration did not decrease from the initial concentration, indicating that precipitation and colloid formation [Citation25,Citation32] of Th were negligible.
2.2. Rock and mineral samples
The main constituent minerals of granite, such as feldspar, quartz and mica, were selected for sorption experiments. Feldspar and quartz were represented by commercially available samples of albite (NaAlSi3O8, Iwamoto Co., Ltd.) and quartz form silica (SiO2, Kanto Chemical Co., Inc.), respectively. The mica group minerals were represented by biotite (K(Mg, Fe(II))3(Al, Fe(III))Si3O10(OH, F)2, Nichika Inc.). These mineral samples were in powdered form (<100 μm). Inada granite sample in granulated form (a few hundred μm) was purchased from Nichika Inc. All of the solid samples were used without pretreatment. Scanning electron microscope images (JSM-6010, JEOL Ltd.) of these solids are shown in . Their specific surface areas were measured by the Brunauer–Emmett–Teller (BET) N2 gas adsorption method (NOVA 1200e, Quantachrome Instruments) [Citation33]. The measured specific surface areas were 1.0 m2 g−1 (albite), 0.7 m2 g−1 (quartz), 4.3 m2 g−1 (biotite) and 0.5 m2 g−1 (granite).
Figure 2. Scanning electron microscope images of the employed solids (×100 magnification).
2.3. Sorption experiments
Sorption experiments were performed in a controlled-atmosphere glove box under Ar. The experimental runs were made following the procedure of the ‘measurement method of the distribution coefficient on the sorption process’ compiled by the Atomic Energy Society of Japan [Citation34]. One week is recommended as the standard sorption period in this literature, and sorption runs were performed for longer period (2 weeks) in this study. The rock and mineral samples (0.1 g) were immersed in a 10 cm3 volume of the Th experimental solutions in polypropylene test tubes with a screw cap. The pH of the sample suspension was adjusted to 8.5–11 with NaOH solution. The pH of ground water generally ranges between 5 and 10 [Citation35], but it is difficult to adjust the pH to lower values because carbon dioxide is released from the solution by adding acid. The sample suspensions were agitated once a day. After two weeks, the pH and the concentration of Th were measured. The pH was measured with a Sure–Flow combination glass electrode (ROSS 8172BNWP, Thermo Fisher Scientific Inc.). The electrode was calibrated with standard pH buffer solutions of 7.00, 10.01 and 12.46.
A 1 cm3 aliquot was sampled and filtered through a 10,000 NMWL ultrafilter. The filtrate was sampled (0.5 cm3 for 0.01 and 0.05 mol dm−3 NaHCO3, or 0.2 cm3 for 0.1 mol dm−3 NaHCO3) and diluted to 3 cm3 with 5% HNO3. The concentrations of Th were determined by ICP-MS.
3. Results and discussion
3.1. Experimental results
The distribution coefficient, Kd (m3 kg−1), was calculated using the following equation:(1)
(1) where cini is the initial concentration of Th (mol dm−3), ceq the equilibrated concentration of Th (mol dm−3), Vini the initial volume of the solution (m3) and M the weight of the solid phase (kg). The obtained pH and Kd values are summarized in –. For the data obtained from the lower equilibrated concentrations than the lower limit of quantitation (2×10⁻¹¹ mol dm−3 for 0.01 and 0.05 mol dm−3, and 5×10⁻¹¹ mol dm−3 for 0.1 mol dm−3 NaHCO3 conditions, considering the dilution ratio), the lowest Kd values were shown in the tables.
Table 2. Experimental variables and data for Th sorption on albite.
Table 3. Experimental variables and data for Th sorption on quartz.
Table 4. Experimental variables and data for Th sorption on biotite.
Table 5. Experimental variables and data for Th sorption on granite.
The obtained Kd values for albite are plotted versus pH in a). All the Kd values for 0.01 mol dm−3 NaHCO3 were higher than 9.9 m3 kg−1 at pH 8.70–10.82. The Kd values for 0.05 mol dm−3 NaHCO3 were from 4.6 × 10⁻¹ to 3.0 m3 kg−1 at pH 8.71–10.59. The Kd values for 0.1 mol dm−3 NaHCO3 were from 8.7 × 10⁻² to 7.3 × 10⁻¹ m3 kg−1 at pH 8.67–10.39. The Kd values decreased with increasing NaHCO3 concentration and the local minimal value was seen at around pH 10.
Figure 3. Comparison of Kd values for Th obtained in this study and previously reported ones: (a) albite, (b) quartz [Citation12,Citation14], (c) biotite, and (d) granite [Citation11]. ‘0.01 M’ represents the 0.01 mol dm−3 NaHCO3 concentration. Previous data for albite and biotite are not available.
![Figure 3. Comparison of Kd values for Th obtained in this study and previously reported ones: (a) albite, (b) quartz [Citation12,Citation14], (c) biotite, and (d) granite [Citation11]. ‘0.01 M’ represents the 0.01 mol dm−3 NaHCO3 concentration. Previous data for albite and biotite are not available.](/cms/asset/f9c2e73c-b61f-4a4c-bc27-ed7783521b08/tnst_a_1138901_f0003_oc.jpg)
The obtained Kd values for quartz are plotted versus pH in b). The Kd values for 0.01 mol dm−3 NaHCO3 were from 2.9 to 9.5 m3 kg−1 at pH 8.63–10.18. The values are almost the same as the literature values obtained under the conditions of 0.01 mol dm−3 NaClO4 by Allard et al. [Citation12] and slightly higher than the values obtained under the conditions of 0.02 mol dm−3 KNO3 by Chen and Wang [Citation14]. The Kd decreased with increasing NaHCO3 concentration, the values for 0.1 mol dm−3 NaHCO3 were about two orders of magnitude lower than those for 0.01 mol dm−3 NaHCO3 (from 2.1 × 10⁻² to 5.5 × 10⁻² m3 kg−1). The Kd values for quartz were lower than those for albite, and the pH dependences of Kd for quartz showed the same tendency as those for albite.
The obtained Kd values for biotite are plotted versus pH in c). All the Kd values for 0.01 mol dm−3 NaHCO3 were higher than 9.9 m3 kg−1 at pH 8.96–10.67. The Kd values decreased with increasing NaHCO3 concentration, the Kd values for 0.1 mol dm−3 NaHCO3 were from 3.3 to 28 m3 kg−1 at pH 8.76–10.37. The Kd values for biotite were higher than those for albite and quartz, and the pH dependences of Kd for biotite showed the same tendency as those for albite and quartz.
The obtained Kd values for granite are plotted versus pH in d). The Kd values for 0.01 mol dm−3 NaHCO3 were from 3.9 to 9.4 m3 kg−1 at pH 8.61–10.23 and higher than 9.9 m3 kg−1 at the higher pH region. The values are almost the same as the literature values obtained under the conditions of 3.3 × 10⁻³ mol dm−3 HCO3− [Citation11]. The Kd decreased with increasing NaHCO3 concentration, the values for 0.1 mol dm−3 NaHCO3 were about two orders of magnitude lower than those for 0.01 mol dm−3 NaHCO3 (from 1.5 × 10⁻² to 9.2 × 10⁻² m3 kg−1). The pH dependences of Kd for granite were almost the same as those for the constituent minerals.
The dominant sorption mechanism of Th on the constituent minerals is considered to be surface complexation [Citation4,Citation18,Citation36]. Quartz has silanol sites (≡SiOH) on the edge surfaces. Albite, which is sodium aluminosilicate includes aluminol sites (≡AlOH) and ≡SiOH on the edge surfaces. Biotite that has Fe in its mineral structure has a possibility of including ferrol sites (≡FeOH) [Citation37] in addition to ≡AlOH and ≡SiOH. By considering the surface complexation of Th with such surface hydroxyl groups, the sorption behaviors were analyzed by the SCM [Citation38].
3.2. Analysis of the sorption behavior by the SCM
The sorption behaviors of Th were analyzed by the NEM with the Visual Minteq computer program using the thermodynamic data of all solution species summarized in . The NEM neglects the possible formation of outer-sphere complexes involving the background electrolytes such as ≡SO−_Na+ or ≡SOH2+_CO32− [Citation37–41]. The protonation and deprotonation reactions of surface hydroxyl groups (≡SOH) can be expressed by
(2)
(2)
(3)
(3)
Based on the dominant aqueous Th species (), the surface species were assumed as follows [Citation27–30,Citation36,Citation39]:
(4)
(4)
(5)
(5)
(6)
(6)
In addition, the formation of ≡SOTh(OH)4− species was also considered because the ≡SO− site was stable in the high pH regions [Citation4]. The reactions between ≡SOH sites and Th4+ which is the master species of Th(IV) for calculations were as follows:
(7)
(7)
(8)
(8)
(9)
(9)
(10)
(10)
The Kd values were calculated as
(11)
(11)
Nuclear Energy Agency (NEA) [Citation15] reported the indicative values for SCM parameters of important minerals. In the calculations for albite, the surface site density (ns = 4.05 sites nm−2) and the surface acidity constants (log Ka1 = 4.13 and log Ka2 = −8.46) of feldspar reported by the NEA [Citation15] were adopted. The measured surface area (S = 1.0 m2 g−1) by BET was adopted. The existing literature values of the equilibrium constants for surface complexation of Th are summarized in . The values for albite are not available. Instead, the model calculation was performed by using K1 and K2 values for the NEM for montmorillonite ((Na,Ca)0.33(Al,Mg)2Si4O10(OH)2·nH2O) [Citation27] and kaolinite (Al4Si4O10(OH)8) [Citation30] (). These minerals are aluminosilicate minerals formed by weathering or alteration of plagioclase [Citation42] and have ≡SiOH and ≡AlOH; similar sorption property to albite can be expected. The equilibrium constants of surface carbonato-complex species (K3 and K4) were tried to be estimated by linear free energy relationships (LFERs) which is based on the analogy of hydrolysis in solution to sorption onto surface hydroxyl groups. Bradbury and Baeyens [Citation27,Citation28] formulate the interrelation between the formation constants of aqueous hydroxo-complex species of metal ions (Mez)
(12)
(12) and that of surface species
(13)
(13) as
(14)
(14) and
(15)
(15) for montmorillonite and illite, respectively. shows the correlation of log surKx−1 with log aqKx for montmorillonite and illite reported by Bradbury and Baeyens [Citation27,Citation28]. The formation constants of surface carbonato-complex species of Th were only reported by Ervanne et al. [Citation30] (). The formation of ≡SOTh(OH)2CO3−
(16)
(16) was estimated from the aqueous carbonato-complex species
(17)
(17)
Table 6. Existing literature values of equilibrium constants for surface complexation of Th.
Figure 4. Correlation of surface complexation constants of metal species sorbing on the mineral surface with the corresponding aqueous hydrolysis constants (blue and green marks) summarized in Bradbury and Baeyens [Citation27,Citation28]. The blue line shows LFER for montmorillonite and the green dotted line for illite. Red marks are the data reported by Ervanne et al. [Citation30].
![Figure 4. Correlation of surface complexation constants of metal species sorbing on the mineral surface with the corresponding aqueous hydrolysis constants (blue and green marks) summarized in Bradbury and Baeyens [Citation27,Citation28]. The blue line shows LFER for montmorillonite and the green dotted line for illite. Red marks are the data reported by Ervanne et al. [Citation30].](/cms/asset/37cc3f16-8d2e-4cb8-b7bd-7fb5d19141c4/tnst_a_1138901_f0004_oc.jpg)
The formation constants of ≡SOTh(OH)2CO3−, ≡SOTh(OH)2+ and ≡SOTh(OH)2° for kaolinite and illite reported by Ervanne et al. [Citation30] were plotted in . The data points of surface hydroxo-carbonato complex species, ≡SOTh(OH)2CO3−, can be explained by the LFER. The log K3 and log K4 values were estimated from the formation constants of aqueous carbonate complex species (aqK'x) listed in as
(18)
(18)
(19)
(19)
(20)
(20) to be log K3 = -16.0 and log K4 = 27.5. a) shows the comparison of the predicted Kd values for albite with the experimentally measured ones. The model calculations with the values of log K1 = −9.8 and log K2 = −17.8 predicted the sorption tendency well. The employed SCM parameters are summarized in . a) shows the calculated mole fractions of Th species under 0.05 mol dm−3 NaHCO3 conditions. It is shown that the ≡SOThOH(CO3)22− and ≡SOTh(OH)4− are dominant sorption species. The mole fractions of aqueous species, ThOH(CO3)45− and Th(OH)2(CO3)22−, are shown at around pH10. The local minimal Kd value at around pH 10 was due to the stabilization of aqueous species by hydroxo–carbonate complexation.
Figure 5. Comparison of Kd values of Th predicted using the NEM (lines) with experimentally measured ones (marks).
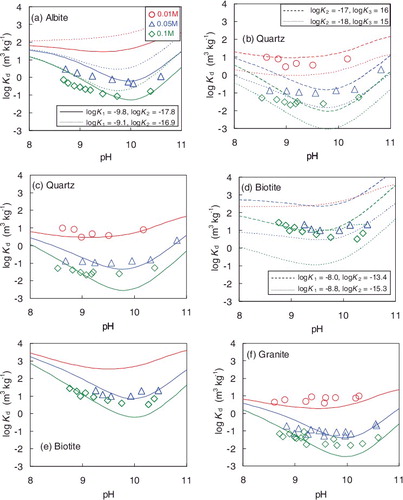
Table 7. Model parameters and equilibrium constants for the NEM calculation.
Figure 6. Calculated mole fraction of Th species under 0.05 mol dm−3 NaHCO3 condition. (a) Albite, (b) quartz, (c) biotite, (d) granite and (e) granite calculated using one order of magnitude lower K1–K7 values for feldspar. (F), feldspar; (Q), quartz; (B), biotite.
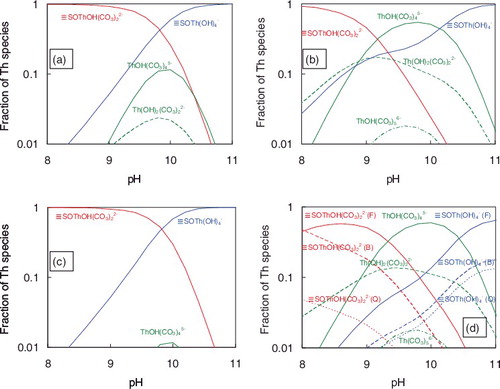
In the calculations for quartz, the measured surface area (0.7 m2 g−1), the surface acidity constants (log Ka1 = −1.26 and log Ka2 = −7.28) [Citation15] and the surface site density (5.67 sites nm−2) [Citation15] were adopted. For the formation constants of surface sorption species onto quartz, only the values for the TLM [Citation22] are available. In the TLM, the electrostatic terms are included in the set of components in order to correct for the effects of surface charge on equilibrium constants [Citation15]. On the other hand, the electrostatic terms are incorporated within equilibrium constants for sorption reactions in the NEM, it is difficult to adopt the equilibrium constants for the TLM to the NEM. The formation constants of surface species for quartz were estimated by optical fitting. The dominant surface species were assumed to be ≡SOThOH(CO3)22− and ≡SOTh(OH)4− from the calculated mole fractions of Th species for albite (a)), and the K2 and K3 values were estimated. Calculation results are shown in b). The log K2 value can be estimated from −18 to −17 and the log K3 can be from 15 to 16. The calculation results with the intermediate values (log K2 = −17.5 and log K3 = 15.5) explain the experimental results reasonably well (c)), and these values are similar to those for albite. b) shows the calculation results of Th species under 0.05 mol dm−3 NaHCO3 conditions. The mole fractions of ≡SOThOH(CO3)22− are smaller than the case for albite, which causes the lower Kd values than those for albite. It is due to the lower pKa2 value of quartz (7.28) than albite (8.46), and the concentration of ≡SOH for quartz is lower than that for albite at pH > 8.
In the calculations for biotite, the measured surface area (4.3 m2 g−1), the surface acidity constants (log Ka1 = 4.6 and log Ka2 = −6.4) [Citation43,Citation44] and the surface site density (3.81 sites nm−2) for mica [Citation15] were adopted. The formation constants of surface species for biotite are not available. Instead, the values for illite (K(Al,Mg,Fe)2(Si,Al)4O10(OH)2) [Citation28,Citation30] which belongs to the mica group [Citation45] and contains ≡SiOH, ≡AlOH and ≡FeOH were adopted. The formation constants of surface carbonato-complex species were estimated by LFER (EquationEquation (15)(15)
(15) ). The values of K3 and K4 were calculated from the formation constants of aqueous carbonate complex species () as
(21)
(21) to be log K3 = −15.2 and log K4 = 25.8. d) shows the comparison of the predicted Kd values for biotite with the experimentally measured ones. The calculation results using the values (log K1 = −8.0 and log K2 = 13.4) reported by Ervanne et al. [Citation30] overestimated the Kd values by about one order of magnitude. On the other hand, the model calculations using the values (log K1 = −8.8 and log K2 = 15.3) reported by Bradbury and Baeyens [Citation28] can explain the experimental results reasonably well at pH > 10, but underestimated the Kd values at lower pH and higher concentrations of carbonate. This is likely due to the underestimation of the formation constant of ≡SOThOH(CO3)22− species (log K3 = 15.2) which was expected to dominate the sorption at low pH and high carbonate concentration. The slope in the interrelation between aqK'x and surK'x-1 is expected to be nearly 1 by assuming simple exchange of ≡SO− and OH− in the surface complexation reaction as
(22)
(22) the slope of 0.83 might be too low. The log K3 value estimated by the extrapolation of data for some metal species [Citation28] using EquationEquation (21)
(21)
(21) would be also too low. Using least-squares fitting, with a slope of 1, to the data for illite shown in , the relationship between log surK'x-1 and log aqK'x was formulated as
(23)
(23) which gave the log K3 value to be nearly 19.2 (aqK'x = 8.798). e) shows that the recalculation results with log K5 = 18.5 (the formation of ≡SOTh(CO3)45−was ignored) explain the experimental results reasonably well. c) shows the calculated mole fractions of Th species under 0.05 mol dm−3 NaHCO3 conditions. The dominant surface species for biotite were the same as those for albite and quartz. The mole fractions of aqueous Th species are lower than the case for albite and quartz, which causes the higher Kd values.
Sorption behaviors of Th onto granite were analyzed by the CA approaches [Citation15]. The composition of granite was assumed as 45% feldspar, 50% quartz and 5% biotite [Citation46]. The specific surface area of granite was measured as 0.5 m2 g−1. However, surface areas below 1 m2 g−1 cannot be measured accurately by the N2–BET method [Citation47] and the particle size of the granite samples (a few hundred μm) was much larger than the powdered mineral samples (); the value of measured specific surface area is unreliable. André et al. [Citation48] reported the interaction between the particle size and specific surface area for crushed granite, and the particle size of 250–500 μm corresponds to the specific surface area of 0.111 m2 g−1. In this calculation, the specific surface area of 0.1 m2 g−1 was adopted. The surface area of each mineral was assumed to be proportional to its content. For the surface acidity constants (Ka1, Ka2) and the formation constants of the surface species (K1–K4), the values summarized in were adopted. f) shows the calculated Kd values for granite compared with the experimentally measured ones. The calculation results can explain the experimental results well. André et al. [Citation48] also reported that the Kd values for intact drill core of granite were about one order of magnitude lower than those for the crushed granite with the particle size of 250–500 μm. Byegård et al. [Citation49] reported the dependence of Kd on the particle diameter of granite and it supports the results of André et al. [Citation48]. In addition, Hakanen et al. [Citation50] reported that Kd values for crushed crystalline rocks were up to 30 times higher than those for intact rocks. Therefore, the Kd values for the intact granite rocks are expected to be about one order of magnitude lower than the experimental results. d) shows the mole fractions of Th species for granite under 0.05 mol dm−3 NaHCO3 conditions. It was suggested that biotite and feldspar dominate the sorption of Th in granite at near neutral pH and feldspar dominates at higher pH. Although the surface areas of the constituent minerals were assumed to be proportional to its content in this study, the sorption behavior of Th in granite is affected by the effective surface areas of the constituent minerals. Further studies are necessary to understand the effective surface area of each mineral in granite.
4. Conclusion
The Kd values of Th for granite and its major constituent minerals (albite, quartz and biotite) were obtained at pH 8.5–11 under 0.01, 0.05 and 0.1 mol dm−3 NaHCO3 conditions. The Kd values for granite under 0.01 mol dm−3 NaHCO3 conditions were from 3.9 to 9.4 m3 kg−1 at pH 8.61–10.23 and higher than 9.9 m3 kg−1 at higher pH regions. The Kd decreased with increased carbonate concentrations, the Kd values for 0.1 mol dm−3 NaHCO3 were from 1.5 × 10⁻² to 9.2 × 10⁻² m3 kg−1, and the local minimal value was shown at around pH10. These sorption tendencies were also shown for the constituent minerals.
The NEM calculations for the sorption of Th onto the constituent minerals were able to explain the experimental results well. The local minimal Kd value was due to the stabilization of aqueous species by hydroxo–carbonate complexations. Sorption behaviors of Th onto granite were analyzed by the CA approaches, and the calculation results agreed with the experimental results well. The calculation results for mol fractions of Th suggest that biotite and feldspar can be acting as the dominant sorbent minerals in granite.
Acknowledgments
The authors acknowledge Mr. M. Kamoshida and Mr. N. Terunuma for experimental measurements; Dr. L. Barr for reviewing the language. Part of this research is funded by the Secretariat of Nuclear Regulation Authority (NRA), Japan (formerly the Nuclear and Industrial Safety Agency, Ministry of Economy, Trade and Industry, Japan).
Disclosure statement
No potential conflict of interest was reported by the authors.
References
- Japan Nuclear Cycle Development Institute (JNC). H12: Project to establish the scientific and technical basis for HLW disposal in Japan. Second Progress Report on Research and Development for the Geological Disposal of HLW in Japan. Tokai: JNC; 2000.
- Rand MH, Fuger J, Grenthe I, et al. Chemical thermodynamics of thorium. Amsterdam: Elsevier; 2009.
- Kitamura A, Fujiwara K, Doi R, et al. Update of JAEA-TDB: additional selection of thermodynamic data for solid and gaseous phases on nickel, selenium, zirconium, technetium, thorium, uranium, neptunium, plutonium and americium, update of thermodynamic data on iodine, and some modifications. Tokai: Japan Atomic Energy Agency; 2012.
- Reiller P, Moulin V, Casanova F, et al. On the study of Th(IV)–humic acid interactions by competition sorption studies with silica and determination of global interaction constants. Radiochim Acta. 2003;91:513–524.
- Melson NH, Haliena BP, Kaplan DI, et al. Adsorption of tetravalent thorium by geomedia. Radiochim Acta. 2012;100:827–832.
- Yui M, Sasamoto H. Geostatistical and geochemical classification of groundwaters considered in safety assessment of a deep geologic repository for high-level radioactive wastes in Japan. Geochem J. 2004;38(1):33–42.
- Yamaguchi T, Takeda S, Nishimura Y, et al. An attempt to select thermodynamic data and to evaluate the solubility of radioelement with uncertainty under HLW disposal conditions. Radiochim Acta. 2014;102(11):999–1008.
- Japan Atomic Energy Agency (JAEA) and Federation of Electric Power Companies of Japan (FEPC). Second progress report on research and development for TRU waste disposal in Japan – repository design, safety assessment and means of implementation in the generic phase. Tokai: JAEA and FEPC; 2007.
- Sasamoto H, Yui M. Viewpoint of defining the groundwater chemistry for the performance assessment on geological disposal of high level radioactive waste. Tokai. JNC; 2000. [in Japanese].
- Sasamoto H, Yui M, Arthur RC. Estimation of in situ groundwater chemistry using geochemical modeling: a test case for saline type groundwater in argillaceous rock. Phys Chem Earth. 2007;32:196–208.
- Allard B, Rydberg J, Kipatsi H, et al. Disposal of radioactive waste in granitic bedrock. Am Chem Soc. 1979;4:47–73.
- Allard B, Olofsson U, Torstenfelt B, et al. Sorption of actinides in well-defined oxidation states on geologic media. Mater Res Soc Symp Proc. 1982;11:775–782.
- Östhols E. Thorium sorption on amorphous silica. Geochim Cosmochim Acta. 1995;59:1235–1249.
- Chen C, Wang X. Sorption of Th (IV) to silica as a function of pH, humic/fulvic acid, ionic strength, electrolyte type. Appl Radiat Isot. 2007;65:155–163.
- Nuclear Energy Agency (NEA). Thermodynamic sorption modelling in support of radioactive waste disposal safety cases: NEA Sorption Project Phase III. Paris: OECD-NEA; 2012.
- Rojo I, Seco F, Rovira M, et al. Thorium sorption onto magnetite and ferrihydrite in acidic conditions. J Nucl Mater. 2009;385:474–478.
- Xu D, Chen C, Tan X, et al. Sorption of Th(IV) on Na-rectorite: effect of HA, ionic strength, foreign ions and temperature. Appl Geochem. 2007;22:2892–2906.
- Karamalidis AK, Dzombak DA. Surface complexation modeling: gibbsite. Weinheim: Wiley; 2010.
- Cromieres L, Moulin V, Fourest B, et al. Sorption of thorium onto hematite colloids. Radiochim Acta. 1998;82:249–255.
- Romanchuk AY, Kalmykov SN. Actinides sorption onto hematite: experimental data, surface complexation modeling and linear free energy relationship. Radiochim Acta. 2014;102(4):303–310.
- Hunter KA, Hawke DJ, Choo LK. Equilibrium adsorption of thorium by metal oxides in marine electrolytes. Geochim Cosmochim Acta. 1988; 52:627–636.
- Riese AC. Adsorption of radium and thorium onto quartz and kaolinite: a comparison of solution/surface equilibria models [Ph.D. thesis]. Colorado School of Mines; 1982.
- La Flamme BD, Murray JW. Solid/solution interaction: the effect of carbonate alkalinity on adsorbed thorium. Geochim Cosmochim Acta. 1987;51:243–250.
- Olin M, Lehikoinen J. Application of surface complexation modelling: nickel sorption on quartz, manganese oxide, kaolinite and goethite, and thorium on silica. Finland: Posiva; 1997.
- Quigley MS, Honeyman BD, Santschi PH. Thorium sorption in the marine environment: equilibrium partitioning at the hematite/water interface, sorption/desorption kinetics and particle tracing. Aquat Geochem. 1996;1:277–301.
- Murphy RJ, Lenhart JJ, Honeyman BD. The sorption of thorium (IV) and uranium (VI) to hematite in the presence of natural organic matter. Colloid Surface A. 1999;157:47–62.
- Bradbury MH, Baeyens B. Modelling the sorption of Mn(II), Co(II), Ni(II), Zn(II), Cd(II), Eu(III), Am(III), Sn(IV), Th(IV), Np(V) and U(VI) on montmorillonite: linear free energy relationships and estimates of surface binding constants for some selected heavy metals and actinides. Geochim Cosmochim Acta. 2005;69:875–892.
- Bradbury MH, Baeyens B. Sorption modelling on illite. Part II: Actinide sorption and linear free energy relationships. Geochim Cosmochim Acta. 2009;73:1004–1013.
- Bradbury MH, Baeyens B. Predictive sorption modelling of Ni(II), Co(II), Eu(III), Th(IV) and U(VI) on MX-80 bentonite and Opalinus Clay: a “bottom-up” approach. Appl Clay Sci. 2011;52:27–33.
- Ervanne H, Puukko E, Hakanen, M. Modeling of sorption of Eu, Mo, Nb, Ni, Pa, Se, Sn, Th and U on kaolinite and illite in olkiluoto groundwater simulants. Finland: Posiva; 2013.
- Stumm W, Morgan JJ. Aquatic chemistry. 3rd ed. New York: Wiley; 1996.
- Baskaran M, Santschi PH, Benoit G, et al. Scavenging of thorium isotopes by colloids in seawater of the Gulf of Mexico. Geochim Cosmochim Acta. 1992;56(9): 3375–3388.
- Brunauer S, Emmett PH, Teller E. Adsorption of gasses in multimolecular layers. J Am Chem Soc. 1938;60:309–319.
- Atomic Energy Society of Japan (AESJ). Measurement method of the distribution coefficient on the sorption process. Tokyo: AESJ; 2006. [in Japanese].
- Oyama Y, Takahashi M, Tsukamoto H, et al. Relationship between water quality of deep-groundwater and geology in non-volcanic areas in Japan. J Nucl Fuel Cycle Env. 2011;18:25–34.
- Sakamoto Y, Ishii T, Inagawa S, et al. Measurement of distribution coefficients of U series radionuclides on soils under shallow land environment(II) -pH dependence of distribution coefficients. J Nucl Fuel Cycle Env. 2001;8:65–76. [in Japanese].
- Shibutani T, Nishikawa T, Inui S, et al. Study on sorption behavior of Se on rocks and minerals. Tokai: Power Reactor and Nuclear Fuel Development Corporation; 1994. [in Japanese].
- Dzombak DA, Morel FMM. Surface complexation modeling: hydrous ferric oxide. New York: Wiley-Interscience; 1990.
- Tachi Y, Ochs M, Suyama T. Integrated sorption and diffusion model for bentonite. Part 1: clay–water interaction and sorption modeling in dispersed systems. J Nucl Sci Technol. 2014;51:1177–1190
- Turner DR, Pabalan RT, Bertetti FP. Neptunium(V) sorption on montmorillonite: an experimental and surface complexation modeling study. Clays Clay Miner. 1998;46:256–269.
- Davis JA, Kent DB. Surface complexation modeling in aqueous geochemistry. Rev Mineral. 1990;23:177–260.
- Sasaki M. Geochemical features of groundwaters in granitoids. Bull Geol Surv Japan. 2004;55:439–446, [in Japanese].
- Chakraborty S, Wolthers M, Chatterjee D, et al. Adsorption of arsenite and arsenate onto muscovite and biotite mica. J Colloid Interface Sci. 2007;309:392–401.
- Iida Y, Tanaka T, Yamaguchi T. Sorption behavior of hydroselenide (HSe−) onto iron-containing minerals. J Nucl Sci Technol. 2014;51:305–322.
- Shirozu H. Nendo Kobutsu Gaku: Nendo Kagaku No Kiso. Tokyo: Asakura Shoten; 1988. [in Japanese].
- Idemitsu K, Furuya H, Murayama K, et al. Diffusivity of uranium(VI) in water-saturated Inada granite. Mater Res Soc Symp Proc. 1996;257:625–632.
- Michot L, Tracas D, Lartiges B, et al. Partial pillaring of vermiculite by aluminium polycations. Clay Miner. 1994;29:133–136.
- André M, Neretnieks I, Malmstrom ME. Measuring sorption coefficients and BET surface areas on intact drillcore and crushed granite samples. Radiochim Acta. 2008;96:673–677.
- Byegård J, Johansson H, Skålberg M, et al. The interaction of sorbing and non-sorbing tracers with different Äspö rock types. Sweden: SKB; 1998.
- Hakanen M, Ervanne H, Puukko E. Safety case for the disposal of spent nuclear fuel at Olkiluoto radionuclide migration parameters for the geosphere. Finland: Posiva; 2014.