
 ?Mathematical formulae have been encoded as MathML and are displayed in this HTML version using MathJax in order to improve their display. Uncheck the box to turn MathJax off. This feature requires Javascript. Click on a formula to zoom.
ABSTRACT
A new approach for generating nuclear data from experimental cross-section data is presented based on Gaussian process regression. This paper focuses on the generation of nuclear data for proton-induced nuclide production cross-sections with a nickel target. Our results provide reasonable regression curves and corresponding uncertainties and demonstrate that this approach is effective for generating nuclear data. Additionally, our results indicate that this approach can be applied in experimental design to reduce the uncertainty of generated nuclear data.
1. Introduction
Nuclear data play a vital role in the field of nuclear science and technology (i.e. nuclear energy, medical and industrial applications of radiation sources, radiation protection, and radioactive waste management). These data are most often evaluated via theoretical nuclear models based on nuclear data evaluation codes, such as CCONE [Citation1], EMPIRE [Citation2], and TALYS [Citation3], which fit experimental cross-section data and integrated experiments. Moreover, for energies above the applicable range of these codes (up to several hundred MeV), Monte Carlo spallation reaction simulations based on intranuclear cascade (INC) plus de-excitation models are applied to evaluate nuclear data (e.g. JENDL high-energy file [Citation4] and HEIR [Citation5]). Although it is generally accepted that these models describe spallation reactions fairly well, considerable discrepancies between the experiments and these nuclear models have been reported in the literature [Citation6–Citation9]. While it is desirable to resolve these discrepancies by improving the nuclear models or tuning the model parameters, this approach requires substantial amount of time and effort.
As an alternative to nuclear models, regression based on the least-squares method (e.g. GMA [Citation10] and SOK [Citation11]) is often applied to evaluate nuclear data. Regression based on Gaussian processes [Citation12], hereafter referred to as Gaussian process regression (GPR), has attracted widespread interest in fields such as pattern recognition, machine learning, and nuclear applications [Citation13–Citation17]. Because GPR models give predictive distributions for regression problems, this technique may be a powerful tool not only for evaluating nuclear data but also for determining the corresponding uncertainty.
In this paper, we apply GPR to generate nuclear data, focusing on the proton-induced nuclide production cross-sections at energies ranging from 100 MeV to 3 GeV. As an example, this study treats four individual spallation products for a nickel (Ni) target:
Ni(
)
Be,
Ni(
)
Na,
Ni(
)
Cr, and
Ni(
)
Co. The natural abundances of the nickel isotopes are assumed as 68.08% (
Ni), 26.22% (
Ni), 1.14% (
Ni), 3.63% (
Ni), and 0.93% (
Ni). Experimental cross-section data were taken from the EXchange FORmat (EXFOR) experimental nuclear reaction database [Citation18] (i.e. Titarenko et al. [Citation19], Budzanowski et al. [Citation20], Neumann [Citation21], Michel et al. [Citation22], Schiekel et al. [Citation23], and Rayudu [Citation24]). Furthermore, to investigate the impact of experimental data and their uncertainties on GPR results, experimental data recently measured at the Japan Proton Accelerator Research Complex (J-PARC) (Takeshita et al. [Citation25]) were employed. In this experiment, the cross-sections for 0.4-, 1.3-, 2.2-, and 3.0-GeV proton-induced reactions were measured using the activation method. Although the experimental uncertainty is currently being estimated by Takeshita et al., the uncertainty in the number of incident protons, which is the dominant source of the total uncertainty, is expected to be smaller than that of other experiments due to the precise intensity of the J-PARC proton beams and well-calibrated proton intensity monitors [Citation26]. Therefore, in this study, we assume that the total uncertainties are uniform at 6% (1
), which is smaller than the typical experimental uncertainties of approximately 10% measured in similar experiments (e.g. Titarenko et al. [Citation19], Michel et al. [Citation22]).
This paper is organized as follows. Section 2 describes our methodology for generating nuclear data using the GPR technique. In Section 3, we present GPR results for proton-induced nuclide production cross-sections, in addition to nuclear model calculations performed using the Liège INC model version 4.6 [Citation27] coupled to the generalized evaporation model [Citation28] (INCL4.6/GEM) and evaluated nuclear data from the JENDL high-energy file (JENDL-HE/2007). We also demonstrate the applicability of GPR to nuclear data generation. Finally, our conclusions are presented in Section 4.
2. Methodology
2.1. Generation procedure
Suppose that we have measured data points (measurement energy points
and corresponding cross-sections with uncertainties [one standard deviation, 1
]
) for a certain nuclear reaction and that we aim to generate a set of cross-sections for certain
energy points
(the generated cross-section set is written as
).
To avoid negative (non-physical) values for the generated cross-section set, we estimate as follows:
Take the logarithm of (
,
Calculate target variables
Take the exponential of (
where represents the standard deviation of
, and
and
indicate the upper and lower standard deviations, respectively.
Additionally, because the energy axis is often scaled logarithmically in graphic representation, the energy points were converted to
, and
values were used as input data points in GPR.
2.2. Gaussian process regression
Following the above assumptions and treatment, a zero-mean Gaussian process defines the joint probability distribution of and
as a multivariate Gaussian distribution with mean
and covariance
, which is given by
where the ()-th element of
is expressed as
The first term represents the kernel function, and the second term
is Gaussian noise, written as
where is the Kronecker delta. Note that the choice of the kernel function and that of the Gaussian noise affect the generation of
. The elements of the
matrix
,
matrix
, and
matrix
are of the form:
By applying the theorem for conditional Gaussian distributions (see Appendix A) to EquationEquation (4)(4)
(4) , we obtain the conditional probability distribution
, expressed as
where the mean and covariance
are expressed as follows:
2.3. Kernel function and hyperparameters
For the kernel function, this study uses the following radial basis function:
where is a set of hyperparameters, which is optimized by finding the solution that maximizes the log-likelihood function
, written as
In this study, we use the gradient method, in which we obtain an optimal set of by updating the parameter set using the following equation:
where is the iteration number and
is the learning rate. Applying EquationEquation B.1
(B.1)
(B.1) in Appendix B and EquationEquation B.2
(B.2)
(B.2) in Appendix B to EquationEquation (12)
(12)
(12) , we obtain the derivative of
as:
3. Results and discussion
shows nuclide production cross-sections for the Ni(
)
Be,
Ni(
)
Na,
Ni(
)
Cr, and
Ni(
)
Co reactions. In these figures, we plot two regression lines with their uncertainty bands, i.e. prior and posterior, in comparison with the JENDL-HE/2007 evaluations and the INCL4.6/GEM calculations. The prior and posterior lines present the GPR results given by using the experimental dataset without and with the inclusion of the experimental data of Takeshita et al., respectively, and the line and band represent the mean and
2
about the mean, respectively. The optimal
values for the GPR results are summarized in ; here, for the initial set of
and the learning rate for solving the optimization problem, we use
and
, respectively. We see that both sets of GPR results show reasonable agreement with each experimental dataset for all cases, and the curves are updated by the new experimental data. Although INCL4.6/GEM and JENDL-HE/2007 can account for the trends of nuclide production to some degree, these results do not agree with the experimental data. Furthermore, for JENDL-HE/2007, large gaps are observed at 250 MeV, which is attributed to a difference in the nuclear models employed in nuclear data evaluation below and above 250 MeV (see Watanabe et al. [Citation4]).
Figure 1. Nuclide production cross-sections for the Ni(
)
Be,
Ni(
)
Na,
Ni(
)
Cr, and
Ni(
)
Co reactions. The dashed blue line and the light blue band present the mean of the generated predictive distribution and
2
about the mean, respectively, generated from the experimental dataset without experimental data from Takeshita et al. The green line and the light green band present the mean of the generated predictive distribution and
2
about the mean, respectively, generated from the experimental dataset including the experimental data from Takeshita et al.
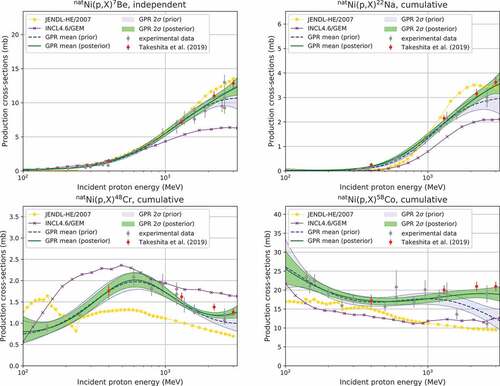
Table 1. Optimal hyperparameters.
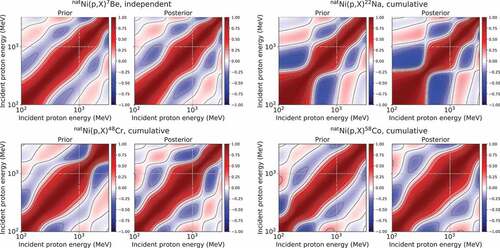
presents the relative standard deviations and
(1σ) for the four reactions, and depicts the correlation matrices of for the same reactions. Note that the information for these variables is explicitly derived from GPR as afunction of the incident proton energy, in contrast to traditional models such as the linear regression model. Acomparison between the prior and posterior results in and shows that the uncertainties are reduced by inclusion of new experimental data near measurement energies of 400 MeV and 1.3, 2.2, and 3 GeV. Accordingly, these data alter the correlation matrices, indicating that the experiment conducted by Takeshita etal. advances the generation of nuclide production cross-sections for a Ni target, particularly in the GeV range.
Figure 2. Relative uncertainties (1) in the generated cross-sections
for the
Ni(
)
Be,
Ni(
)
Na,
Ni(
)
Cr, and
Ni(
)
Co reactions. The solid and dashed blue lines present the upper and lower bounds of 1
, respectively, generated from the experimental dataset without the experimental data of Takeshita et al. The solid and dashed blue lines present the upper and lower bounds of 1
, respectively, generated from the experimental dataset with the experimental data from Takeshita et al.
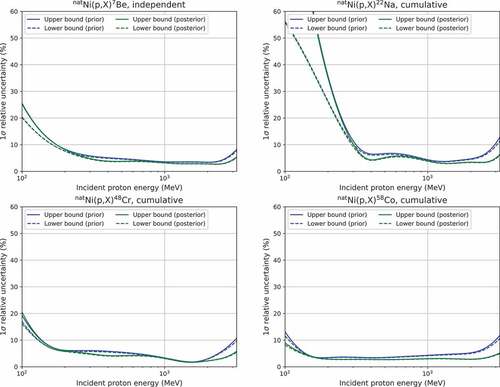
Figure 3. Correlation matrices among the target variables for the
Ni(
)
Be,
Ni(
)
Na,
Ni(
)
Cr, and
Ni(
)
Co reactions.
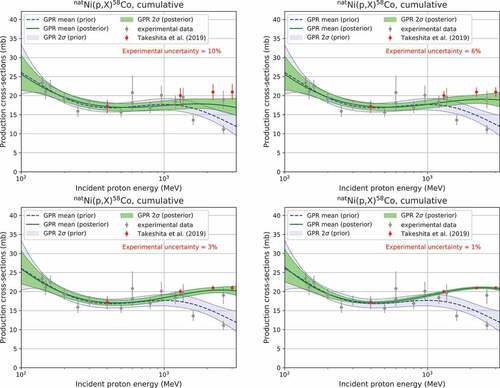
displays GPR results for the Ni(
)
Co reaction under different experimental uncertainties. Here the uncertainties for the experiments of Takeshita et al. were assumed to be 10%, 6%, 3%, and 1% (1
), whereas those of the other experiments were not changed. As intuitively anticipated, the mean GPR curves shift toward the experiment values as the experimental uncertainties decrease. Thus, the uncertainty of experimental values directly affects the regression curves, suggesting that the generation of nuclear data requires a careful estimation of the experimental uncertainty.
Figure 4. Comparison of GPR results for the Ni(
)
Co reaction under different experimental uncertainties.
4. Conclusion
We have applied the GPR technique to generate nuclear data, focusing on proton-induced nuclide production cross-sections for a Ni target. Reasonable curves with corresponding uncertainties were obtained, and the results indicate that this approach is effective for generating nuclear data. Moreover, our results suggest that this approach can be applied in experimental design to reduce the uncertainty of generated nuclear data. However, some limitations are worth noting. This study focused on proton-induced nuclide production cross-sections with relatively simple shapes. We did not examine nuclear data with complicated shapes, such as fission cross-sections for actinide nuclei. Furthermore, this study treated a relatively small experimental dataset. The dataset was sufficient; however, we did not apply large or small experimental nuclear datasets. Therefore, future work will explore the applicability of this approach for such types of nuclear data.
Acknowledgments
The author would like to thank Dr. K. Nishihara of the Japan Atomic Energy Agency for his review of the manuscript and his comments.
Disclosure statement
No potential conflict of interest was reported by the author.
References
- Iwamoto O. Development of a comprehensive code for nuclear data evaluation, CCONE, and validation using neutron-induced cross sections for uranium isotopes. J Nucl Sci Technol. 2007;44(5):687–697.
- Herman M, Capote R, Carlson BV, et al. EMPIRE: nuclear reaction model code system for data evaluation. Nucl Data Sheets. 2007;108(12):2655–2715.
- Koning AJ, Rochman D. Modern nuclear data evaluation with the TALYS code system. Nucl Data Sheets. 2012;113(12):2841–2934.
- Watanabe Y, Kosako K, Kunieda S, et al. Status of JENDL high energy file. J Korean Phys Soc. 2011;59(2):1040–1045.
- Fleming M, Eastwood J, Stainer T, et al. HEIR: A high-energy intra-nuclear cascade Liège-based residual nuclear data library for simulation with FISPACT-II. Nucl Instrum Meth A. 2018;908:291–297.
- Titarenko Y, Batyaev VF, Butko MA, et al. Verification of high-energy transport codes on the basis of activation data. Phys Rev C. 2011 Dec;84:064612.
- Iwamoto Y, Sato T, Hashimoto S, et al. Benchmark study of the recent version of the PHITS code. J Nucl Sci Technol. 2017;54(5):617–635.
- Stankovskiy A, Iwamoto H, Çelik Y, et al. High-energy nuclear data uncertainties propagated to MYRRHA safety parameters. Ann Nucl Energy. 2018;120:207–218.
- Iwamoto H, Meigo SI, Matsuda H. A comprehensive study of spallation models for proton-induced spallation product yields utilized in transport calculation. Proceedings of International Conference on Nuclear Data for Science and technology (ND2019). 2019 May 19–24; Beijing, (China).
- Poenitz WP, Aumeier SE. The simultaneous evaluation of the standards and other cross sections of importance for technology. USA: Argonne National Laboratory; 1997. ANL/NDM-139
- Kawano T, Matsunobu H, Murata T, et al. Simultaneous evaluation of fission cross sections of uranium and plutonium isotopes for JENDL-3.3. J Nucl Sci Technol. 2000;37(4):327–334.
- Rasmussen CF, Williams CKI. Gaussian process for machine learning. Cambridge: The MIT Press; 2006.
- Bishop CM. Pattern recognition and machine learning. New York: Springer-Verlag; 2006.
- Wilson A, Nickisch H. Kernel interpolation for scalable structured Gaussian processes (KISS-GP). Proceedings the 32nd International Conference on Machine Learning (ICML2015); 2015 Jul 6–11; Lille, (France).
- Lee J, Bahri Y, Novak R, et al. Deep neural networks as Gaussian processes. Proceedings the Eighth International Conference on Learning Representations (ICLR2018); 2018 Apr 26–30; Addis Ababa, (Ethiopia).
- Chilenski MA, Greenwald M, Marzouk Y, et al. Improved profile fitting and quantification of uncertainty in experimental measurements of impurity transport coefficients using Gaussian process regression. Nucl Fusion. 2015;55:023012.
- Schnabel G. Estimating model bias over the complete nuclide chart with sparse Gaussian processes at the example of INCL/ABLA and double-differential neutron spectra. EPJ Nucl Sci Technol. 2018;4:33.
- Otuka N, Dupont E, Semkova V, et al. Towards a more complete and accurate experimental nuclear reaction data library (EXFOR): international collaboration between nuclear reaction data centres (NRDC). Nucl Data Sheets. 2014;120:272–276.
- Titarenko Y, Batyaev VF, Titarenko A, et al. Measurement and simulation of the cross sections for nuclide production in 93Nb and natNi targets irradiated with 0.04- to 2.6-GeV protons. Phys At Nuclei. 2011;74(4):537–550.
- Budzanowski A, Fidelus M, Filges D, et al. Comparison of nonequilibrium processes in p + Ni and p + Au collisions at GeV energies. Phys Rev C. 2010 Sep;82:034605.
- Neumann S. Activation experiments with medium-energy neutrons and the production of cosmogenic nuclides in extraterrestrial matter. Thesis, Univ Hannover; 1999.
- Michel R, Bodemann R, Busemann H, et al. Cross sections for the production of residual nuclides by low- and medium-energy protons from the target elements C, N, O, Mg, Al, Si, Ca, Ti, V, Mn, Fe, Co, Ni, Cu, Sr, Y, Zr, Nb, Ba and Au. Nucl Instr and Meth in Phys Res B. 1997;129(2):153–193.
- Schiekel T, Sudbrock F, Herpers U, et al. Nuclide production by proton-induced reactions on elements (6≤Z≤29) in the energy range from 200 MeV to 400 MeV. Nucl Instr Methods Phys Res B. 1996;114:91–119.
- Rayudu GVS. Formation cross sections of various radionuclides from Ni, Fe, Si, Mg, O, and C for protons of energies between 130 and 400 MeV. Can J Chem. 1964;42(5):1149–1154.
- Takeshita H, Meigo SI, Matsuda H, et al. Nuclide production cross sections of Ni and Zr irradiated with 0.4-, 1.3-, 2.2-, and 3.0-GeV protons. Proceedings the 3rd J-PARC Symposium (J-PARC2019); 2019 Sep 23–26; Tsukuba, (Japan).
- Meigo SI, Matsuda H, Iwamoto H Cross section measurement in J-PARC for neutronics of the ADS. Proceedings 13th International Topical Meeting on Nuclear Applications of Accelerators (AccApp’17); 2017 Jul 13–Aug 4; Quebec, (Canada).
- Boudard A, Cugnon J, David J-C, et al. New potentialities of the Liège intranuclear cascade model for reactions induced by nucleons and light charged particles. Phys Rev C. 2013 Jan;87:014606.
- Furihata S. Statistical analysis of light fragment production from medium energy proton-induced reactions. Nucl Instrum Meth. 2000;B171:251–258.
Appendix A.
Theorem for conditional Gaussian distributions
The following theorem was used to derive EquationEquations (8)(8)
(8) –(Equation10
(10)
(10) ) from EquationEquation (4)
(4)
(4) . The proof can be found in the text by Bishop [Citation13].
If a joint probability distribution for two sets of variables and
is Gaussian
, where
and
then, the conditional distribution of is also Gaussian
, where
Appendix B.
Formulas for derivatives of the log-determinant and inverse of a matrix
The following mathematical formulas were used to derive EquationEquation (14)(14)
(14) from EquationEquation (12)
(12)
(12) .
• The derivative of the log-determinant of a square matrix with respect to a scalar
is given by
• The derivative of the inverse of a square matrix with respect to a scalar
is given by