
 ?Mathematical formulae have been encoded as MathML and are displayed in this HTML version using MathJax in order to improve their display. Uncheck the box to turn MathJax off. This feature requires Javascript. Click on a formula to zoom.
ABSTRACT
A tsunami probabilistic risk assessment (PRA) is an effective tool that reviews the safety margins for beyond-design-basis events and strengthens the application of the defense-in-depth philosophy. It is recognized that tsunami hazard levels, assumed margins, and assumed risks differ significantly between sites. This paper proposes a framework of risk-based graded approach for a tsunami PRA. Since the predominant sources of uncertainties in an overall tsunami PRA may stem from tsunami hazard analysis, the framework selects a methodology for incorporating the uncertainties of tsunami hazard analysis in subsequent analyses, by grade. The framework provides five grades depending on the level of detail in the assessment. This graded approach framework was experimentally applied to the tsunami PRA for a virtual nuclear power station.
1. Introduction
Following the accident at the Fukushima Daiichi nuclear power plant caused by the 2011 Tohoku earthquake and tsunami, there were discussions among regulatory bodies, utilities, and academic and engineering experts worldwide [Citation1] [Citation2,Citation3] about what could be learnt from the accident. One of the lessons learned was the importance of reviewing the safety margins for beyond-design-basis natural events, including tsunamis. To achieve this and strengthen the application of the defense-in-depth philosophy, probabilistic approaches, including probabilistic risk assessments (PRAs) that could compensate for the impacts of uncertainties, were reviewed [Citation1,Citation2,Citation4,Citation5].
The Japan Nuclear Energy Safety Organization conducted research on the methodology of tsunami PRAs before the accident at the Fukushima Daiichi nuclear power plant in 2011 in order to identify accident scenarios caused by tsunamis [Citation6,Citation7]. Since 2011, guidelines and standards on external flooding PRAs (EFPRAs), including tsunami PRAs, have been created by accumulating information from methodologies and technologies for each sub-analysis [Citation8–11] and issued. The EFPRA methodology is generally based on the methodologies of internal and seismic PRAs. However, compared to the seismic PRA – for which methodologies have been applied in practice [Citation12,Citation13] and all or parts of related guidelines have been endorsed by regulatory guides [Citation14]—knowledge and data on EFPRAs are limited, and the methodology of EFPRAs is underdeveloped. Thus, research and development on the technical elements of EFPRAs have been carried out over the last decade [Citation4,Citation5,Citation15–21] to aid with the development of their practical applications.
EFPRAs have been conducted for several US and Japanese nuclear power plants; the diversity of failure modes of structures, systems, and components (SSCs), and accident sequences caused by the diversity of flooding profiles dependent on flooding sources have rarely been considered. Here, information on inundations such as inundation area, and spatial and temporal distributions of inundation depth in sites is collectively referred to as flooding profile.
As specified in the ASME/ANS standard [Citation8], the major elements of the EFPRA methodology are flooding hazard analysis, flooding fragility analysis – involving the analysis of flooding pathways and water levels – and system analysis, which includes quantification. The history of research on the methodology of probabilistic tsunami hazard analysis (PTHA) is deeper than that of fragility and system analysis [Citation6,Citation22–26]. PTHA can calculate the relationship between the scale and frequency of future tsunamis. Based on the probabilistic seismic hazard analysis (PSHA) method proposed by Cornell [Citation26], a logic-tree approach is often used for PTHA. This approach systematically incorporates both epistemic (lack of knowledge or data) and aleatory (nature randomness or variability) uncertainties regarding future tsunami predictions into the analysis. The former is expressed by branches of the logic tree, whereas the latter is usually incorporated by assumed probability models.
Conversely, research on tsunami fragility analysis – which focuses on the application of tsunami PRAs in nuclear power plants – is not sufficiently mature enough to be applied widely in practice [Citation5,Citation27]. Haraguchi et al. [Citation28] developed a simple methodology for analyzing the tsunami fragility of components, with reference to the Zion method for seismic fragility analysis [Citation29]. The methodology of Haraguchi et al. [Citation28] adopted a simple approach for taking the uncertainties of flooding profiles empirically into account. Furthermore, they concluded that there were many assumptions based on engineering judgments in their approach, and that the accumulation of data and knowledge on the relationship between tsunami heights and flooding profiles could pose an important technical issue.
Kaida et al. [Citation30] carried out a fragility analysis case study of a reinforced concrete seawall that faced tsunami impact. The study noted the importance that the uncertainties in tsunami forms should be appropriately incorporated into fragility analysis because flooding profiles strongly depend on tsunami forms. Sugino et al. [Citation6] proposed a methodology for tsunami PRA using a case study of a virtual nuclear power station. Inundation depths near important components in the site were used as response parameters for the fragility analysis, and Monte Carlo simulations were carried out to consider uncertainties in tsunami forms and calculate inundation depths for tsunami scenarios with sinusoidal forms of various wave lengths. Tsunami scenarios denote tsunamis which were used evaluation of flooding profiles to calculate tsunami loads for fragility analysis.
As suggested by the above-mentioned studies, a flooding profile in a site depends strongly on tsunami form, which is characteristic to the tsunami source. Even if offshore tsunami heights are identical, volumes of overflow into a site vary greatly depending on the tsunami sources. Furthermore, inundation depths are inhomogeneous and depend on the volume and location of the overflow. Consequently, inundated areas also vary with tsunami sources. This means that expected tsunami risks are strongly dependent on tsunami sources, especially for tsunami heights whose sensitivities to core damage probability are expected to be high. Thus, uncertainties in tsunami sources need to be incorporated into the flooding analysis in the tsunami PRA.
In seismic PRA, seismic fragility analysis of a component installed on the floor or wall of a building requires the relationship between the peak ground acceleration (PGA) defined at the outcrop of the bedrock and the seismic load effect on the component [Citation31]. This relationship can generally be obtained by dynamic soil-structure interaction analysis. This analysis quantifies the seismic load effects on components by calculating the responses of a structure with surrounding soils subjected to earthquake ground motion, characterized by a given PGA. This earthquake ground motion, matched with the target response’s spectrum characteristics, is used for dynamic soil-structure interaction analysis. A uniform hazard spectrum (UHS) is commonly used for the target’s response spectrum characteristics [Citation31]. A UHS is constructed to envelope spectral amplitudes at several periods corresponding to a specific annual exceedance frequency with a given reliability. Thus, a UHS concurrently considers the spectral amplitudes for all seismic sources by referring to a seismic hazard curve. However, the approach of a seismic hazard cannot be similarly applied to tsunami hazards, and it is not possible to construct a tsunami scenario which concurrently considers tsunami forms for all tsunami sources.
The Atomic Energy Society of Japan (AESJ)’s tsunami PRA [Citation10] standard and Kihara et al. [Citation32,Citation33] proposed methodologies for determining tsunami scenarios based on PTHA results obtained by hazard deaggregation. The hazard deaggregation techniques applied in these studies were based on that had been used in PSHA [Citation34–36]. In tsunami hazard deaggregation, the contribution of the hazard curve of each tsunami source to the mean hazard curve is calculated for a given tsunami height. Tsunami sources with dominant hazard contributions are selected and used for modeling tsunami scenarios. By adopting this approach and using PTHA-based tsunami scenarios in flooding analyses, a variety of flooding profiles dependent on tsunami sources can be incorporated into fragility analysis.
As mentioned by Bensi et al. [Citation15], it is recognized that potential external flooding hazard levels, assumed margins, and the approaches and strategies used to protect against external flooding differ significantly between sites. The US Nuclear Regulatory Commission [Citation37] adopted a graded-approach framework depending on site characteristics and information needed for decisions for the integrated assessment of a plant to identify vulnerabilities due to external flood hazards by considering both the protection and mitigation capabilities of the plant. It is also recognized that the assumed risk of external flooding differs significantly between sites. Thus, it would be preferable to apply the concept of the risk-based graded-approach framework in flood and fragility analysis in tsunami PRAs.
In this study, a tsunami flooding analysis graded-approach framework for tsunami PRAs is proposed and it was applied to a case study of a virtual nuclear power station. This paper is organized as follows. Section 2 describes the general methodology and analysis process of tsunami PRAs. Next, in section 3, a tsunami flooding analysis graded-approach framework for tsunami PRAs is proposed. Section 4 presents the application of the graded-approach framework to a virtual nuclear power case study.
2. Methodology of a tsunami probabilistic risk assessment
Tsunami PRAs adopt a similar methodology and analysis process to those of seismic PRAs [Citation9,Citation10]. As specified in the ASME/ANS [Citation8] and AESJ [Citation9,Citation10] standards, the major tasks of the tsunami PRA procedure are composed of surveys of the configuration and characteristics of the plant and the status of the site, and hazard, fragility, and accident sequence analyses (). For an easier understanding of the process and the relationship between tsunami hazard analysis, fragility analysis, and accident sequence analysis, we can subdivide the procedure into the following five sub-tasks ():
Figure 1. Flowchart of tsunami PRA procedure.
tsunami hazard analysis,
tsunami failure part and mode analysis,
tsunami flooding and load analysis,
tsunami fragility analysis, and
tsunami accident sequence analysis.
The graded approach framework proposed in this study focuses mainly on determining the methodology for tsunami flooding and load analysis; the methodology is related to those of fragility analysis, and tsunami accident sequence analysis. In this section, the outlines of these analyses and the relationships between them are explained, and in the next section, a graded-approach framework for determining a methodology for tsunami flooding and load analysis is proposed. In this study, the term ‘tsunami load’ represents an acting force that is caused by a tsunami when evaluating a tsunami response in fragility analysis.
In tsunami hazard analysis, the relationship between the frequency of a tsunami and its height at a given site (called the hazard curve) is calculated. For all nuclear power stations in Japan, PTHAs are performed by adopting the logic-tree approach proposed by the Japan Society of Civil Engineers (JSCE) [Citation24] and AESJ [Citation9,Citation10], which is based on the methodology of the seismic hazard analysis of Cornell [Citation26]. In PTHA, epistemic uncertainties about the magnitude of earthquakes, mean earthquake recurrence intervals, etc., are modeled as branches with weights in logic trees. For aleatory uncertainties about the locations of large slip zones, etc., probability models are used. A family of tsunami sources is prepared corresponding to the logic trees, and the tsunami height near a nuclear power station is calculated by using a tsunami simulation for each source. The calculated tsunami height is used as the median value of the probability model for each tsunami source. By aggregating the probabilities, individual hazard curves whose total number is identical to that of the branches are obtained. A mean hazard curve is calculated using the weighted average of the individual hazard curves with weights corresponding to the weights of the branches.
There are various tsunami impacts that need to be considered regarding the risk of nuclear power plants, including the submersions of electrical equipment such as emergency diesel generators, tsunami wave pressures, and water-borne debris [Citation38] collisions on tsunami protective measures such as seawalls and watertight doors [Citation11,Citation39]. The evaluation of tsunami impacts requires information on the tsunami flooding profiles near structures and components. Here, tsunami flooding profiles denote the water surface elevations and velocities of tsunami flooding. The tsunami flooding analysis predicts the relationship between the tsunami height at a hazard control point and the tsunami flooding profile near structures and components. The hazard control point is defined in the AESJ tsunami PRA standard [Citation9,Citation10] as the point at which the hazard curves are calculated and is located at an offshore site of a nuclear power station. The tsunami load analysis evaluates tsunami loads on structures and components using the tsunami flooding profile near the structures and components, specifically the information based on inundation depths and velocities.
Inundation simulations using non-linear shallow water equation (NSWE) models are often adopted for flooding analyses. Inundation simulation by NSWE is mature technology and has been used practically for the development of hazard maps for disaster prevention and mitigation [Citation40]. Of course, there are other simulation techniques such as the smoothed particle hydrodynamics (SPH) model that has been used for flooding analysis in risk assessment [Citation20,Citation41]. In the numerical approach, inundation simulations for tsunami scenarios are carried out for each discrete tsunami height, and the temporal and spatial distributions of inundation depths and velocities are calculated. Here, tsunami scenario refers to the condition of a tsunami in inundation simulation, especially the tsunami source in this study. The advantage of this approach is that the results of the inundation simulations provide a visual understanding of how a site will be flooded by a tsunami, which is helpful for deep discussions about accident scenarios. The inundation depths and velocities vary considerably depending on the tsunami source, and this variability should be incorporated into the evaluation of tsunami loads. Consequently, the tsunami scenarios to be used in an inundation simulation should be appropriately determined by considering the multiplicity of the flooding profiles dependent on epistemic and aleatory uncertainties related to the tsunami sources.
The failure modes of structures and components produced by tsunami impacts are diverse, as evidenced by the 2011 Tohoku earthquake and tsunami [Citation39]. It is important to discuss the dominant failure parts and modes of each structure and component and the related accident scenarios by considering the configurations of the structures and components, tsunami measures, and expected flooding profiles. Accordingly, during a tsunami failure mode analysis, the failure parts, modes, and accident scenarios are discussed through a plant walkdown. This plant walkdown is carried out with plant information, which includes the design information of related SSCs. The results of the tsunami flooding analysis for the design-basis tsunami provide this design information. In addition, the tsunami fragility analysis determines the capacity of the structures and components for tolerating expected failure modes and calculates their failure probabilities. These conditional probabilities are calculated as a function of the tsunami height at the control point by evaluating these capacities and the relationship between the tsunami loads and tsunami heights at the hazard control point.
In the tsunami accident sequence analysis, the core damage accident sequences produced by the failures of structures and components are identified through plant walkdowns, and event trees and fault trees are developed. For each accident sequence, the conditional core-damage probability (CCDP) is calculated for each discrete tsunami height by the event trees and fault trees with the failure probabilities of the structure and component. Through integration of the CCDP with the derivative of the hazard curve with the tsunami height, the core-damage frequency (CDF) can be obtained. Then, important analysis is performed, and critical accident sequences/accident scenarios, mitigation systems, components, and structures contributing to the CDF are identified. Finally, an uncertainty analysis of the core damage can be performed.
3. Graded-approach framework
Based on PTHAs performed in Japanese nuclear power stations, it is well known that the extent of epistemic uncertainties in tsunami hazard curves is broad. This indicates that the epistemic uncertainties in a PTHA may become one of the predominant sources of uncertainties in the overall analyses of tsunami PRAs. Appropriately incorporating the uncertainties in the PTHA within the overall analyses is expected to increase the reliability of the acquired risk information. Consequently, it is important to develop a practical methodology that incorporates the uncertainties of tsunami sources in the PTHA into tsunami flooding and load analysis, which is a post analysis of the PTHA in the PRA.
Using tsunami hazard deaggregation, tsunami sources that have the potential to become the risk of a nuclear power plant are identified for each discrete tsunami height. Based on such tsunami sources, tsunami scenarios for flooding analysis are determined [Citation32,Citation33]. It is likely that many such tsunami sources may be identified. By performing inundation simulations individually for tsunami scenarios corresponding to each tsunami source, the variability of flooding profiles depending on tsunami scenarios can be incorporated into the probabilities of flooding profiles in the flooding analysis. This results in the main uncertainties in the PTHA being incorporated into the post-analyses, that is, the tsunami load, fragility, and accident sequence analyses. However, such inundation simulations are burdensome and expensive, and further, it is difficult to review all the numerical results for identifying accident scenarios. Conversely, the performances of inundation simulations for a limited number of tsunami scenarios cannot completely encompass the aleatory and epistemic uncertainties of flooding profiles. In such cases, it is necessary to incorporate these uncertainties in different ways, such as through simple modeling based on expert opinions. Here, the ‘expert opinion’ does not coincide with the expert judgement as strictly defined in the SSHAC process [Citation42]. Of course, as in the SSHAC process, it is desirable to aggregate expert opinions to determine the center, body, range of the uncertainty.
As mentioned above, the methodology of incorporating the uncertainties of tsunami sources into tsunami flooding analysis has a significant impact on the quality of risk information obtained by the tsunami PRA. Conversely, because the potential tsunami hazard levels, assumed margins, and approaches and strategies used to protect against tsunamis differ significantly between sites, the quality of the risk information required differs among plants. Thus, a risk-based graded approach should be adopted for the methodology selection. This study proposes methodologies with five grades that differ in their methods of incorporating uncertainties in tsunami sources into tsunami flooding analysis. Among the five grades, the methodologies of the tsunami flooding, fragility, and accident sequence analyses depend on the grade. Key differences between the five grades are described in , and a flowchart of the tsunami PRA adopting the risk-based graded approach is shown in . A grade with a higher number corresponds to one with a more detailed analysis. Each analysis dependent on the grade is explained below according to the flowchart shown in .
Figure 2. Flowchart of tsunami PRA adopting a risk-based graded approach.
Table 1. Key differences among five grades.
3.1. Tsunami flooding and load analyses
A methodology that incorporates the uncertainties of tsunami sources into predicting tsunami flooding profiles depends on grades. Grade 1.0 is a methodology that predicts tsunami flooding profiles in a simple way. At this grade, inundation simulations are not performed, and the relationships between tsunami flooding profiles and the tsunami heights at the hazard control point are empirically given. This approach was proposed by Haraguchi et al. [Citation28] and is often adopted in tsunami PRAs for nuclear power stations in Japan. Since tsunami flooding profiles depend on tsunami sources and vary spatially in a site, it is difficult to predict the flooding profiles near each structure and component with a high degree of accuracy in this grade. Consequently, both epistemic and aleatory uncertainties for predicted flooding profiles should be set wide enough.
Grade 2.0 and higher grades adopt a methodology in which the tsunami flooding profiles are predicted numerically by inundation simulations for tsunami scenarios, with the number of tsunami scenarios being dependent on the grade. To ease the understanding of the readers, the methodologies are explained in order, from the higher grades – which adopt detailed analyses – to the lower grades – which adopt simpler analyses.
Using hazard deaggregation technique, the hazard contribution or fraction of the mean hazard for each tsunami source to that of the total tsunami sources is calculated. The ranking of hazard contribution means the ranking of annual frequency of occurrence in a discretized tsunami height interval. Therefore, by ranking hazard contribution at each tsunami height, the tsunami sources with high annual frequency for a given tsunami height can be identified. Tsunami sources with significant hazard contributions are used for modeling tsunami scenarios for flooding analysis. This task is commonly applied to Grades 2.0–5.0.
At Grade 5.0, the tsunami scenarios corresponding to tsunami sources with hazard contributions higher than a negligibly small value are determined. Tsunami flooding profiles corresponding to tsunami scenarios are obtained by carrying out inundation simulations for those tsunami scenarios. Detailed reviews of the numerical results of the inundation simulations are performed for identifying structures and components that may be affected by tsunamis without overlooking them. In this task, the numerical results are compared with physical quantities such as inundation depth and velocity related to failure parts and modes of structures and components
However, in cases where there are too many tsunami sources with non-negligible hazard contributions, even if inundation simulations can be performed for the tsunami scenarios corresponding to such tsunami sources, it can be difficult to review numerical results; reviewing numerical results for so many tsunami scenarios can be laborious. On the other hand, some tsunami scenarios whose sources belong to the same earthquake source zone have similar forms. For these tsunami scenarios, flooding profiles may be similar because the current directions and durations are similar.
At Grades 3.0 and 4.0, tsunami sources are grouped based on similarity of tsunami waveforms in tsunami scenarios. The similarity is determined by information of tsunami simulation of PTHA. This method is unique in that the similarity can be determined not by carrying out tsunami inundation simulations for tsunami scenarios. A tsunami scenario representative of each group is determined by comparing the hazard contributions among the tsunami sources in each group. Tsunami scenarios for these grades are regarded as ‘selected and limited tsunami scenarios.’ This grouping method was proposed by Kihara et al. [Citation33] and Takahashi et al. [Citation43].
At these grades, two kinds of uncertainties are separately considered as uncertainties on predictions of tsunami flooding profiles. The first is the uncertainty on the difference in tsunami flooding profiles among tsunamis belonging to a group. This uncertainty relates to the uncertainty about the difference in predicted tsunami heights among tsunami sources in PTHA and is incorporated into the PTHA as both epistemic and aleatory uncertainties. Similarly, this framework incorporates both epistemic and aleatory uncertainties in different tsunami flooding profiles. The second is the uncertainty on the representativeness of the tsunami scenario representative of a group. It should be noted that the tsunami flooding profile predicted by the tsunami scenario is not necessarily the median among the tsunamis belonging to the group. This means that results depend on the selection of the tsunami scenario. Thus, epistemic uncertainties in the selection of a tsunami scenario representative for the group are considered in this framework.
At Grade 2.0, a characteristic tsunami is determined to be the tsunami scenario. Therefore, there is only one tsunami scenario. Here, the uncertainties of flooding profiles should be considered widely enough as only the tsunami flooding profile for a single tsunami scenario is evaluated, even though tsunami flooding profiles are strongly dependent on tsunami sources. It should be noted that the hazard contribution of the tsunami scenario must be checked at each discrete tsunami height because appropriately determining the tsunami scenario is necessary for confidently evaluating the fragilities of structures and components and identifying major accident sequences. If the hazard contribution of the selected tsunami scenario is significantly lower than those of other tsunamis at the tsunami height where the core damage frequency (CDF) is expected to be high, the tsunami scenario must be selected again based on its hazard contributions.
3.2. Fragility analysis
Failure probabilities of a structure and component are obtained by calculating the conditional probability with which tsunami response exceeds capacity of the structure and component. In general, both the tsunami response and the capacity are assumed to be expressed as log-normal distributions whose parameters are median values and logarithmic standard deviations for aleatory and epistemic uncertainties. The log-normal distribution for the capacity is given as a function of physical quantity such as inundation depth, velocity, and pressure related to failure mode of the structure and component. The log-normal distribution for the tsunami response is given as a function of the same physical quantity as the capacity. In this study, the physical quantity is called tsunami load.
For Grades 1.0 and 2.0, tsunami loads on structures and components are evaluated from a tsunami flooding profile at each discrete tsunami height. At these grades, the tsunami loads evaluated from the tsunami flooding profile are set as the median value of the log-normal distribution for the tsunami response. The logarithmic standard deviations of the log-normal distribution are set by considering both epistemic and aleatory uncertainties. Failure probabilities are obtained by calculating the conditional probability with which the tsunami response exceeds the capacities of the structures and components.
For Grades 3.0–5.0, tsunami loads on structures and components are evaluated from the tsunami flooding profiles dependent on tsunami scenarios at each discrete tsunami height. At Grades 4.0 and 5.0 (excepting Grade 3.0), tsunami loads evaluated from the tsunami flooding profiles dependent on the tsunami scenarios are set as the median values of the log-normal distribution for the tsunami responses. The logarithmic standard deviations of the log-normal distribution are set by considering both epistemic and aleatory uncertainties. Failure probabilities dependent on tsunami scenarios are obtained by calculating the conditional probability with which the tsunami response exceeds the capacities of the structures and components. In other words, there are failure probabilities for multiple tsunami scenarios, as described in . At Grade 3.0, the failure probabilities dependent on the tsunami scenarios calculated at Grade 4.0 are aggregated by considering the hazard contributions. The failure probability at Grade 3.0 is a weighted average of the failure probabilities at Grade 4.0, and here the hazard contribution is the assigned weight. This process is referred to as ‘aggregation of failure probabilities’ in . This aggregation of failure probabilities is expressed as EquationEquation 33(33)
(33) in section 3.4.
In summary, in Grades 1.0–3.0, failure probabilities are calculated at a given tsunami height. Conversely, in Grades 4.0 and 5.0, failure probabilities at a given tsunami height are calculated dependent on tsunami scenarios, and there are multiple failure probabilities corresponding to multiple tsunami scenarios.
3.3. Accident sequence analysis
In Grades 1.0–3.0, a set of fragility values for each structure and component at each tsunami height is applied in the accident sequence analysis. This process is the same as that of a traditional seismic PRA. Consequently, the same methodology and tools for seismic accident sequence analysis can be applied in a tsunami PRA. The fragility value is applied to the tsunami accident sequence analysis at a given tsunami height, resulting in a conditional core damage probability (CCDP). By integrating the product of the CCDP and the gradient of the tsunami hazard with tsunami height, the CDF can be obtained.
Conversely, in Grades 4.0 and 5.0, a set of fragility values for each structure and component is calculated for each tsunami scenario at a given tsunami height. The fragility value is applied to the tsunami accident sequence analysis for each tsunami scenario, resulting in a CCDP for each tsunami scenario. Now, there are multiple CCDPs corresponding to multiple tsunami scenarios. A weighted average of the CCDPs is calculated by using the hazard contribution as the assigned weight. By integrating the product of the weighted average of CCDP and the gradient of the tsunami hazard with tsunami height, the CDF can be obtained.
3.4. Mathematical comparison among grades
Here, the annual failure frequencies of a component predicted by Grades 2.0–5.0 are mathematically compared. As explained in section 2, individual annual frequencies and a mean annual frequency of tsunamis are obtained, by carrying out tsunami hazard analysis. The individual annual frequency of a tsunami of height
in the range of
at a site for a logic tree branch k is expressed as:
where denotes values of
for logic tree branch k, and
and
are the lower and upper limits of a discrete tsunami height, respectively. Subscripts i,
, and j denote the earthquake source zone, number of the earthquake source zone, and the tsunami source, respectively, and
denotes that the tsunami source j is involved in the earthquake source zone i.
denotes the joint probability density function of a set of parameters whose aleatory uncertainties are considered for tsunami source j. Aleatory uncertainties regarding future tsunami predictions are incorporated by assumed probability models.
is calculated as the product of the probabilities given by assumed probability models for some parameter/model settings on aleatory uncertainties.
denotes the mean annual rate of earthquake occurrences for tsunami source j.
The mean annual frequency is calculated using the weighted average of the individual frequency
with the logic tree branch weight
and is expressed as:
The summation of the logic tree branch weight becomes 1, that is,
Here, in order to help readers to understand the mean of the mean annual frequency ,
we explain the relationship between the mean annual frequency and mean hazard curve or mean annual frequency of exceedance
. In the case that the difference between
and
is minute,
can be expressed by using
as
where . In practical applications,
would not be set to be sufficiently minute, and thus
is calculated by
The hazard contribution of tsunami source
in the tsunami height range of
for the mean annual frequency is calculated as:
Obviously, the summation of the hazard contributions for all tsunami sources becomes 1, that is:
Conversely, the hazard contribution of tsunami source for the individual annual frequency for logic tree branch k,
is calculated as:
A comparison between EquationEquation 6(6)
(6) and EquationEquation 8
(8)
(8) shows that the hazard contribution for the mean annual frequency
differs from that for the individual annual frequency
. The former hazard contribution is likely to be close to the latter hazard contribution of high reliability. This is because individual annual frequencies vary by more than an order of magnitude depending on the confidence level; thus, individual annual frequencies with high reliability have a major impact on the mean annual frequency.
Before comparing the annual frequency of failure predicted among Grades 2.0–5.0, we explain the methodology to calculate failure probabilities in the most reliable manner. To calculate them, individual annual frequencies and failure probabilities for various reliabilities are used. Given the failure probability of a component for the tsunami scenario in the tsunami height range of
for reliability
by
, the annual frequency of failure for reliability
can be calculated by using the individual annual frequency for a logic tree branch k as:
where denotes the values
for reliability
. Here, by sorting
from the smallest to the largest, the fractile fragility values are obtained, and the average of
is the mean failure probability
. The mean annual frequency of failure
is calculated using the average of the individual frequencies, becoming:
EquationEquation 9(9)
(9) and EquationEquation 10
(10)
(10) can be regarded as predictions in the most reliable manner, as uncertainties in the PTHA are reflected as accurately as possible. However, in practice, it is not easy to use hazard contributions for individual annual frequencies in tsunami flooding and fragility analyses because they contain a large volume of information. Thus, the methodologies of Grades 2.0–5.0, which will be discussed later, are assumed to be practical, although they are approximations.
From here, the annual frequencies of failures predicted in Grades 2.0–5.0 are compared. To do this, the mean failure probability is calculated from the composite fragility curve that is expressed as a log-normal distribution, which is conventionally used in seismic fragilities [Citation29], as follows:
where denotes the cumulative normal distribution function for
,
denotes a tsunami response parameter
under the condition of tsunami height
for tsunami scenario
, and
denotes the median value of the capacity of the component.
and
are the log-normal standard deviations of variation due to the uncertainties of the tsunami response and the capacity of the component, respectively. These are the composites of the log-normal standard deviations for uncertainties of various model parameters/setting:
where ,
, and
denote the log-normal standard deviations for both epistemic and aleatory uncertainties for various model parameters/settings, 1, 2, … , and N on the tsunami response, and
,
, and
denote the log-normal standard deviations for both epistemic and aleatory uncertainties for various model parameters/settings, 1, 2, … , and M, on the capacity. These composite of the log-normal standard deviations for uncertainties have been applied to seismic fragility analysis [Citation44]. The failure probability for a confidence level is calculated from the fractile fragility curve that is also expressed as a log-normal distribution [Citation9,Citation10],
where denotes the failure probability for
% confidence levels,
and
are the composite log-normal standard deviations for aleatory and epistemic uncertainties, respectively, both for the tsunami response and the capacity of the component, and
is calculated from
. The composite log-normal standard deviations for aleatory and epistemic uncertainties are obtained by
where (
) and
(
) are the log-normal standard deviations for aleatory (epistemic) uncertainties for the tsunami response and the capacity of the component.
In Grade 5.0, the tsunami scenario is determined for each tsunami source whose hazard contribution is not a negligibly small value. The mean annual frequency of failure of the component in the range of ,
, is expressed by the following equation:
The mean annual frequency of failure calculated from Equationequation (17)(17)
(17) agrees with the one calculated from Equationequation (10)
(10)
(10) . Conversely, the annual frequency of failure for reliability
is calculated using the hazard contribution for the mean annual frequency
as:
A comparison between Equationequations (9)(9)
(9) and (Equation18
(18)
(18) ) shows that the frequency of failure for reliability
in Grade 5.0 is not equal to that calculated from Equationequation (9)
(9)
(9) , because
is not equal to
. However,
is likely to be close to
for
with a high degree of reliability, especially when the epistemic uncertainty is wide, and thus, this indicates that
is likely to become a good approximation for
in a high-reliability regime. However, if conservative solutions are required, one opinion is that the maximum of the tsunami response parameters among tsunami scenarios should be used as the representative to calculate the failure probability. In other words, the median values of the tsunami loads for the tsunami responses are set as the values of the maximum tsunami loads among the tsunami scenarios. Using this approach, the mean annual frequency of failure and the annual frequency of failure for reliability
are conservatively calculated by:
and
In Grade 4.0, the mean annual frequency of failure of the component is calculated by the following equation:
where denotes a tsunami group and
denotes the hazard contribution of group
; it is calculated by:
denotes the mean failure probability of a component for group
in the tsunami height range of
and is calculated by:
where denotes the tsunami response parameter
under the condition of the tsunami height
for group
and is given by the tsunami response parameter of a tsunami scenario
representative of the group
. The log-normal standard deviations of variation due to uncertainties in the tsunami response
are a composite of
due to uncertainties in the different response parameters among tsunami scenarios in group
,
, and in the selection of a tsunami scenario representative for group
,
, that is:
The first term on the right-hand side of EquationEquation 33(33)
(33) expresses the failure probability due to the tsunami scenario
, representative of group
, and the second term expresses the probability due to the other tsunami scenario included in group
. When comparing EquationEquation 33
(33)
(33) and EquationEquation 33
(33)
(33) , it is not clear whether the results predicted in Grade 4.0 will always be higher than those in Grade 5.0, because
is not always the largest among
for tsunami scenarios in the group
. Thus, the latter two uncertainties
and
in EquationEquation 33
(33)
(33) must be carefully determined so that the uncertainty of the result becomes sufficiently wide.
In Grade 3.0, the mean annual frequency of failure is expressed as:
where denotes the mean failure probability of a component in the tsunami height range of
and is expressed as:
Substituting Equationequation (26)(26)
(26) into Equationequation (25)
(25)
(25) produces the same form as Equationequation (23)
(23)
(23) , showing that the results in Grade 3.0 are similar to those of Grade 4.0. For Grade 3.0, one opinion is that the maximum tsunami response parameter in each group should be used as the representative to calculate the failure probability if conservative solutions are required:
In Grade 2.0, the mean annual frequency of failure is expressed by the following equation:
where denotes the mean failure probability of a component in the tsunami height range of
and is calculated by:
where denotes the tsunami response parameter
under the condition of tsunami height
for a tsunami scenario j = 0 representative of all tsunami scenarios. The log-normal standard deviations of uncertainties in the tsunami response
is a composite of
, uncertainties in different response parameters in all the tsunami scenarios,
, and uncertainties of selection of a tsunami scenario representative for all the tsunami scenarios,
, that is:
The latter two uncertainties and
must be carefully determined so that the uncertainty of the result becomes sufficiently wide, because it is not obvious that the results predicted in Grade 2.0 will necessarily be higher than those of Grades 3.0, 4.0, and 5.0.
In Grade 1.0, the mean annual frequency of failure is expressed by the following equation:
where denotes the mean failure probability of a component in the tsunami height range of
and is calculated by:
where denotes the tsunami response parameter under tsunami height
. In the methodology of Haraguchi et al. [Citation28], the probability of the elevation of the water surface in the site is determined by the tsunami height just in front of the site, and the probability is assumed to be distributed lognormally. The median of probability of elevation of the water surface at the site was set as the tsunami height just in front of the site with a composite log-normal standard deviation of 0.3. The tsunami response parameter
is evaluated from the elevation of the water surface near the structures and components, and then the log-normal standard deviation
for the response is also evaluated.
3.5. Application of the graded approach framework
When using the proposed graded approach, which is a risk-based approach, the respective site’s characteristics, essential information needed to identify vulnerabilities due to tsunamis, and related protective measures should be considered. For some plants, the results of the PTHA and assumed margins against the tsunamis clearly showed the tsunami risk to be much lower than that of other external events. For those plants, Grade 1.0 analysis, which simply evaluates a tsunami’s CDF, may be sufficient if the CDF is confirmed to be much lower than the CDFs for other external events. Conversely, for other plants, it may not be clear from the results of the PTHA and assumed margins against the tsunamis whether the tsunami risk is much lower than that of other external events. For those plants, the tsunami PRA should be repeatedly quantified from a low grade with a step-by-step increase. At the beginning, a low grade is adopted, and the CDF and risk information are obtained. Furthermore, from analyzing this, analysts can find out the range of the tsunami height for which the CDF is susceptible. If the obtained CDF is not sufficiently lower than a decision criterion of CDF as one of the performance goals of the plant, the fragility and the accident sequence analyses should be carried out again with a higher grade. If the obtained CDF at the higher grade is not sufficiently lower than the criterion of the performance goals of the plant., additional measures for structures and components, that are engineering tsunami resistant facilities, are to be discussed by considering difference between the obtained CDF and the criterion. By considering the effects of the additional measures, the CDF is evaluated again, and the risk reduction done by the additional measures are checked.
4. Case study — application of the tsunami pra for a virtual site
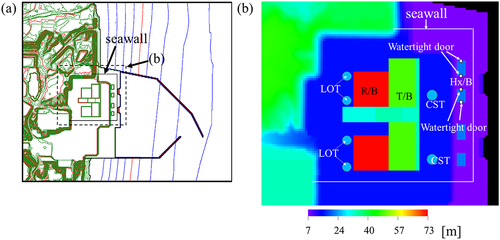
A fragility analysis for a tsunami PRA was experimentally conducted for a virtual nuclear power station, and the graded approach proposed in this study was applied to the analysis. The nuclear power station is located along the Pacific coast, as shown in . This site has a high tsunami hazard level due to the direct arrival of tsunamis generated by earthquakes along the Japan Trench. The layout of the buildings at the power station is shown in . These hypothetical configurations were determined based on the publicly available information of several Japanese nuclear power stations. The site can be divided into two areas based on the ground level differences. The ground level of the seaward side resides at an elevation of 7 m, where the heat exchange buildings are located whereas that of the landward side resides at an elevation of 15 m, where the reactor and turbine buildings are located. The elevation at the top of the seawall is 27 m. The nuclear power station consists of twin plants, the northern plant being analyzed in this study.
Figure 3. Location of virtual nuclear power station analyzed in this study. Site was hypothetically determined at non-existent location.
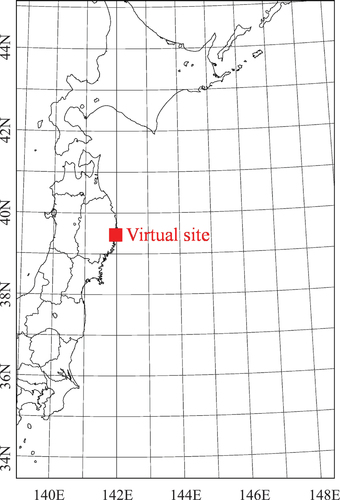
Figure 4. Layout of virtual nuclear power station. Elevations around virtual nuclear power station. Interval of contour lines of (a) is 10 m. Area of (b) is depicted with dashed lines in (a). R/B, T/B, Hx/B, LOT, and CST denote reactor building, turbine building, heat exchanger building, light oil tank, and condensate storage tank. The color contour in (b) denotes the elevations at the ground and buildings.
One of the major accident sequences potentially caused by tsunamis is a sequence in which a tsunami overflows the seawall, the watertight door of the heat exchanger building is physically damaged by the tsunami wave pressure, and the buildings are flooded, resulting in the loss of seawater cooling system functionality for auxiliary equipment, leading to core damage. In this case study, the failure probability of the watertight doors of the heat exchanger building due to the tsunami wave pressure, which is a key fragility factor in this sequence, was evaluated. There are four watertight doors, which are shown as white rectangles in .
The failure of the watertight door of the heat exchanger building was assumed to be caused by the deformation of the entire door by the tsunami wave pressure. The inundation depth in front of the door was adopted as a response parameter for the capacity of the door of the heat exchanger building because inundation depth is one of the most predominant parameters that determine the magnitude of tsunami wave pressure [Citation45–48]. In this study, it was assumed that the epistemic and aleatory uncertainties of the capacity could be expressed as a log-normal distribution. The median of the capacity was set to 10.1 m, and the composite log-normal standard deviation for the uncertainties was hypothetically determined and set to 0.4. The epistemic uncertainty and the aleatory uncertainty were assumed to be equivalent, and thus the log-normal standard deviation for both uncertainties was 0.28.
First, by adopting the logic-tree approach proposed by the JSCE [Citation24], a PTHA was conducted. There were seven earthquake source zones: three multi-segment inter-plate earthquakes (KTC, JTC1, and JTC2), an intra-plate earthquake (JTNR), inter-plate earthquakes (JTT and JTN1), and a multi-segment tsunami earthquake (JTN2 + JTN3) (). The logic tree was determined by following that of a PTHA at the Pacific coast near the Japan Trench shown in the JSCE [Citation24]. Branch points were set for the interlocking of the inter-plate earthquakes, range of stress drops, and return periods, etc., to incorporate these epistemic uncertainties into the analysis. The location of large slip areas and the size of the earthquakes were determined by the probability models as aleatory uncertainties. There was an opinion that these uncertainties were epistemic and not aleatory. However, we treated these uncertainties as aleatory uncertainties, following the method of JSCE [Citation24]. Furthermore, the probability distributions of the tsunami heights were used to incorporate the random variability of the differences between the predicted and real tsunami heights, which were modeled from the comparison between predicted and measured tsunami heights for past tsunamis.
Figure 5. Earthquake source zones used for tsunami hazard analysis.
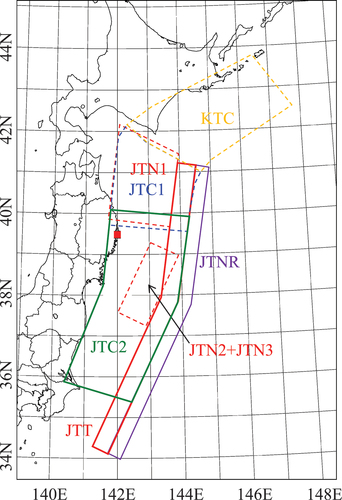
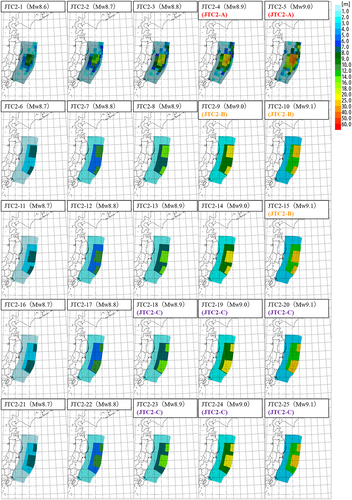
We conducted tsunami simulations for 165 cases using different fault models following the logic tree: 15 for KTC, 15 for JTC1, 25 for JTC2, 41 for JTT, 43 for JTNR, 16 for JTN1, and 10 for JTN2 + JTN3. The results of the long-term predictions were used in this study. The spatial distributions of the slips of 25 tsunami sources for JTC2, which is the most important earthquake source zone in this study, are shown in . In the following discussion, the name of the tsunami source is described using a combination of the earthquake source zone and tsunami source number for each source zone; thus, JTC2–25 denotes a tsunami source whose number is defined as 25, generated from the earthquake source zone JTC2. The tsunami sources from JTC2–1 to JTC2–5 were based on the model of the Cabinet Office, Government of Japan [Citation49], and those from JTC2–6 to JTC2–25 were characterized tsunami source models. Groups which will be used in Grades 3.0 and 4.0 are also shown in .
Figure 6. Spatial distributions of slips of 25 tsunami sources for JTC2. The color contour denotes slip and the unit is in meters. Groups which will be used in Grades 3.0 and 4.0 are also shown.
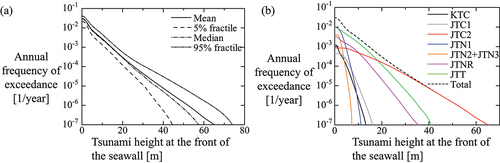
The hazard control point was defined at the front of the seawall. The relationships between the mean and 5, 50, and 95% fractile annual frequencies of exceedance and the tsunami height, which are called hazard curves, are shown in . The mean annual frequency of exceedance was 10−3 (1/year) for 14.35 m, 10−4 (1/year) for 25.47 m, 10−5 (1/year) for 38.35 m, and 10−6 (1/year) for 50.88 m, respectively. In current nuclear regulation in Japan, the mean annual frequency of exceedance of a design-based tsunami is less than or approximately 10−4 (1/year). Based on these hazard levels, the annual frequency of exceedance of the design-based tsunami at this site was determined to be 1.1 × 10⁻⁴ (1/year), and the height of the reference tsunami in front of the seawall was determined to be 25 m. Based on the design-based tsunami, the elevation at the top of the seawall was determined to be 27 m. shows the mean annual frequency of exceedance for each earthquake source zone, the sum of these curves forming the mean hazard curve. At tsunami heights lower than 7 m, tsunamis generated from all source zones contributed to the mean hazard curve. Conversely, as the tsunami height increased, the number of source zones contributing to the mean hazard curve decreased – regarding zones corresponding to tsunami heights >42 m, only tsunamis generated from JTC2 contributed to the mean hazard curve.
Figure 7. (A) Mean, 5% fractile, median, and 95% fractile hazard curves. (b) Mean hazard curve for each earthquake source zone.
Next, to determine tsunami scenarios that could be used in inundation simulations in the tsunami flooding analysis, the hazard contribution for each tsunami source was calculated using the hazard deaggregation technique. Here, the hazard contribution of each tsunami source to the mean hazard curve was calculated for each discretized tsunami height, dividing the tsunami height above 29 m – at which point tsunamis would overflow the seawall and cause significant inundations at the site – at 4 m intervals. The discretized tsunami height was called the average value of the interval; for example, the interval between 29 and 33 m is called 31 m. The hazard contributions for 31, 35, 39, 43, and 47 m are listed in . The summation of the hazard contributions in order from the source with the highest hazard contribution, and the hazard contributions of the sources included when the summation became 0.99, are listed in .
Table 2. List of tsunami sources with high hazard contributions for 31, 35, 39, 43, and 47 m. Hazard contributions C are also described.
In the tsunami flooding analysis, tsunami flooding profiles are empirically evaluated in Grade 1.0 but numerically evaluated in grades higher than 2.0. In these grades, the inundation simulation should be performed at the interval of the tsunami height needed to develop the fragility curve. In this study, inundation simulations were conducted for five tsunami heights (31, 35, 39, 43, and 47 m) corresponding to the discretized tsunami heights for which the hazard contribution of tsunami sources was calculated. In the following sections, tsunami flooding and load analysis, and fragility analysis are performed consecutively from Grade 1.0.
4.1. Grade 1.0
In Grade 1.0, tsunami flooding profiles are evaluated empirically in a simple way. For the evaluation of tsunami flooding profiles at the site, we adopted a methodology based on the concept of Haraguchi et al. [Citation28]. In this methodology, the probability distribution of elevation of the water surface in the site was determined by the tsunami height just in front of the site, and the probability distribution was assumed to be lognormally. The median of this log-normal distribution was set as the tsunami height just in front of the site with a log-normal standard deviation of 0.3. Although the sites in the study of Haraguchi et al. [Citation28] did not have seawalls, our study’s site has a seawall. Behind the seawall, the probability of elevation of the water surface below the top of the seawall can be regarded as negligibly small. As such, in this study, the probability distribution of the water surface elevation at the site was given by a log-normal distribution with the tsunami height just in front of the site as the median and a composite log-normal standard deviation of 0.3; but, the probability of the water surface elevation was set to zero below the top of the 27 m seawall.
The failure probability calculated from EquationEquation 33(33)
(33) is shown in at 10% intervals. The mean failure probability is also shown in the figure. Here, the probability distribution of the capacity with the median of 10.1 m and the composite log-normal standard deviation of 0.4 was used for the calculation of the failure probability. Since the probability of the water surface elevation was zero below the top of the 27 m seawall as described above, the mean failure probability became also zero.
Figure 8. Failure probability of watertight doors of heat exchanger buildings at each tsunami height is shown with reliabilities at intervals of 10% from 5 to 95% with 10 solid circles for Grade 1.0. Line shows mean fragility curve.
4.2. Grade 2.0
In Grade 2.0, the tsunami scenario was determined using a representative tsunami source. In this study, JTC2–25 was selected as the representative tsunami source. In , JTC2–25 has the second largest hazard contribution for tsunami heights of 31, 35, and 39 m and the largest hazard contribution for tsunami heights of 43 and 47 m. The hazard contribution of JTC2–25 was the highest even among tsunami heights higher than 47 m.
The methodology of the AESJ standard [Citation10] was adopted to determine the spatial distributions of the initial displacement of the water level for the generation of the tsunami scenario. Here, we explain the methodology used to create a tsunami scenario from the tsunami source JTC2–25, which is the characterized tsunami source model shown in . In this methodology, the slip of the tsunami source was amplified from that of JTC2–25 to artificially generate a higher tsunami. However, the amplification of the slip was allowed to affect only the initial displacement of the water level, but not the ground displacement. The tsunami height at the hazard control point was numerically calculated by conducting a tsunami simulation for the tsunami source with slip amplification. The degree of the amplification was adjusted so that the tsunami height at the hazard control point would be almost equal to a target tsunami height (31, 35, 39, 43, and 47 m). Then, the spatial distributions of the initial displacement of the water level for the tsunami scenario having tsunami heights of 31, 35, 39, 43, and 47 m were determined.
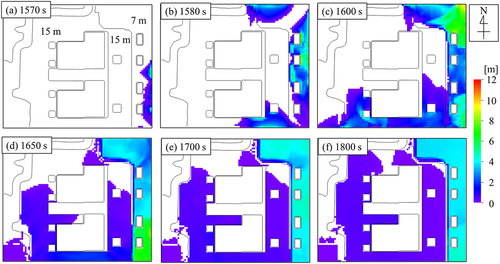
By performing inundation simulations for the tsunami scenario at tsunami heights of 31, 35, 39, 43, and 47 m, temporal and spatial distributions of the inundation depths were obtained. As an example of the numerical results, spatial distributions of the inundation depth for tsunami heights of 39 m are shown in . They are the snapshots between 1570 s and 1800 s and the distributions when the inundation area expanded immediately after the overflow occurred. The figure shows the distributions inside the seawall. The overflow started from the eastside. The inundation depth initially became deep at the seaside area with 7 m elevation, and then inundation expanded at the landside area with 15 m elevation.
Figure 9. Spatial distributions of Inundation depth in the site calculated by the inundation simulation for the tsunami scenario of JTC2–25 at 39 m. Snapshots between 1570 s (a) and 1800 s (f) are shown. The color contour denotes the inundation depth. The white area is the non-inundated area. The number written in (a) denotes the elevation of the ground level.
The maximum inundation depths in front of the doors of the heat exchanger buildings were found to be 0.04, 1.22, 5.38, 8.74, and 16.86 m, respectively. These values were the maximum inundation depths among the four doors of the heat exchanger buildings. The maximum inundation depths were set as the median values of the response parameter. We recognize that it is not strictly appropriate to use the maximum value among the four doors as the median, but we set it this way to simplify the evaluation. Regarding the uncertainty of the tsunami response, the aleatory and epistemic uncertainties of the tsunami flooding profiles in a site dependent on the tsunami source were considered. Furthermore, the epistemic uncertainties in the selection of a tsunami scenario representative for all tsunami sources were also considered. The model empirically presented by Takahashi et al. [Citation43] was preliminarily used for the quantification of these uncertainties. We recognized the technical challenge of quantifying these uncertainties with a high degree of confidence and believe it would be desirable to use a more grounded model in the future.
In the model presented by Takahashi et al. [Citation43], the aleatory and epistemic uncertainties of tsunami flooding profiles in a site dependent on the tsunami source were assumed to be distributed lognormally. The composite log-normal standard deviation for the uncertainties was set as
for inundation depths less than 5 m and
for those greater than 5 m, as proposed by Takahashi et al. [Citation43]. This model assumed that the epistemic uncertainty and aleatory uncertainties,
and
, were equivalent and thus given as
and
for inundation depths less than 5 m and
and
for inundation depths greater than 5 m. In the model of Takahashi et al. [Citation43], the width of the uncertainty differs between cases where the inundation depth is less than 5 m and cases where the inundation depth is greater than 5 m. The cause of the difference in the width of the uncertainty dependent on the inundation depth can be understood as follows. As the tsunami height at the front of the seawall became higher, the inundation depth in the site became deeper. Then, the elevation of the water surface in the site would approach a uniform level, and finally it would equal the tsunami height at the front of the seawall. This means that the higher the tsunami height, the closer the elevation of the water surface in the site approaches the tsunami height. Thus, the uncertainties of prediction for the deeper inundation depths are smaller than those for the shallower inundation depths.
The model also assumed that the epistemic uncertainty associated with the representativeness of the tsunami scenario was distributed lognormally; so, the standard deviation on the logarithmic scale was assumed as
for inundation depths less than 5 m and
for those greater than 5 m, as proposed by Takahashi et al. [Citation43].
The mean failure probability was calculated by using EquationEquation 33(33)
(33) , and the fractile failure probabilities were evaluated at 10% intervals based on the methodology of [Citation9,Citation10], and Kennedy et al. [Citation44]. The median and the epistemic and aleatory uncertainties of the capacity of the watertight door were given as 10.1 m, 0.28, and 0.28, respectively. The epistemic and aleatory uncertainties of the response,
and
, were calculated by
and
and were given as
and
for inundation depths less than 5 m and
and
for inundation depths greater than 5 m. The results are shown in . also shows the fragility curves for the mean and the 5, 50, and 95% confidence levels, which were the cumulative log-normal distributions approximated to the mean and fractile failure probabilities. The approximated distributions were calculated as follows. First,
was calculated from EquationEquation 33
(33)
(33) for 95% confidence level, using the least-squares method. Next, the median and
were calculated by the least-squares method using the failure probabilities for 50% confidence level. The median, the aleatory uncertainty
, and the epistemic uncertainty
of the approximated distribution were 45.4 m, 0.14, and 0.18, respectively. The same approach for the calculations of the approximated cumulative log-normal distributions was also used for Grades 3.0–5.0. It should be noted that the medians and uncertainties of capacity of the watertight door and the response are the ones for the functions of the inundation depth, but the failure probabilities are functions of the tsunami height.
Figure 10. Failure probability of watertight doors of heat exchanger buildings at each tsunami height is shown with reliabilities at intervals of 10% from 5 to 95% with 10 solid circles for Grade 2.0. Solid line denotes approximated mean fragility curve. Dashed, chain dashed, and chain double-dashed lines denote the approximated fractile fragility curves for 5, 50, and 95% reliabilities. Response is evaluated by flood profiles of tsunami scenarios corresponding to JTC2–25.
As shown in below, the inundation depths for JTT-36 and JTT-37 were deeper than those for JTC2–25. Thus, JTT-36 and JTT-37 are more important sources in terms of risk contribution. However, in Grade 2.0, the tsunami scenario is selected before inundation simulations are conducted, and the selected tsunami scenario may not necessarily be the most risk-contributing tsunami scenario. This means that there is a wide epistemic uncertainty in the fragility analysis, and the uncertainty should be considered carefully.
Figure 11. Relationships between latitude of the tsunami energy center and ratio of the tsunami heights at seawall to those at offshore site for tsunami heights of 35 and 43 m. Color contours and sizes of circles denote hazard contributions.
4.3. Grade 3.0
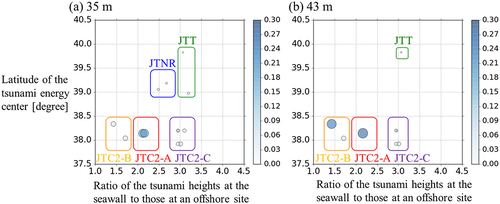
In Grade 3.0, tsunami scenarios with similar forms were grouped, and a tsunami scenario representative for each group was determined by comparing the hazard contributions among the tsunamis in each group. The groups and tsunami sources belonging to each group are listed in . There were five groups: three groups for JTC2 and one group each for JTNR and JTT. The tsunami source representative of each group was selected by considering its hazard contribution. To determine the groups, the earthquake source zone, location of the center of the potential energy of the tsunami – that shows where the large tsunami was generated – and the tsunami height ratio between the offshore and coastal area were considered, as done by Kihara et al. [Citation33]. The location of the center of the potential energy of the tsunami was defined as:
Table 3. List of groups and tsunami sources belonging to each group.
where denotes the vertical displacement of the water level at grid i due to an earthquake and
denotes the position of grid i.
The relationship between the latitude of the center of the potential energy and the ratio of the tsunami heights at the seawall to those at an offshore site for tsunami heights of 35 and 43 m are shown in . Here, the center location of the potential energy is expressed by its latitude because the tsunami sources considered in this study were more widely distributed in the north-south direction than in the east-west direction. shows that the centers of the sources of JTT and JTNR are located around latitudes of 39–40°, although the earthquake source zones of JTT and JTNR are distributed in a long north-south direction as shown in . This is because the large slip zones of the sources of JTT and JTNR shown in the figure are located at north areas in the earthquake source zones. The figure shows only sources which have significant hazard contributions at 35 and 43 m tsunami heights at the front of the seawall. Thus, it was found that only the sources whose large slip zones were located at north areas contributed to the mean hazard curve at 35 and 43 m tsunami heights.
Figure 12. Time series of the inundation depths at the watertight door of the heat exchanger building (the yellow circle in (f)) for 39 m.
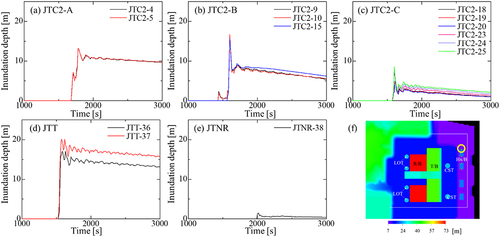
Representative tsunami source for each group is shown in red in . Time-series of the numerically calculated inundation depths in front of a door of a heat exchanger building at 39 m for each group is shown in . The figure shows that the time-series of the inundation depth is similar among tsunami scenarios belonging to the same group, and it was confirmed the processes of the grouping and the selection representative tsunami sources were valid. Using each representative tsunami source, tsunami scenarios were generated using the same methodology as for Grade 2.0, and inundation simulations were performed for tsunami heights of 31, 35, 39, 43, and 47 m.
The numerically calculated inundation depths in front of the doors of the heat exchanger buildings are shown in Appendix A1. In the appendix, not only the inundation depths for the tsunami scenarios in Grade 3.0 are shown, but also those for Grade 5.0. These values were the maximum inundation depths among the four doors of the heat exchanger buildings. The inundation depth was assumed as the median of the response for each tsunami scenario. Although the maximum inundation depth is assumed for the median here, there are opinions that it is more appropriate to assume the averaged inundation depth for the median. The determination of the median is one of the future discussion points. Considering the uncertainty of the tsunami response, the aleatory and epistemic uncertainties of the tsunami flooding profiles in a site dependent on the tsunami source belonging to each group, and the epistemic uncertainty in the selection of a tsunami scenario representative for each group were considered, as described in the next paragraph.
As with Grade 2.0, the model empirically presented by Takahashi et al. [Citation43] was used to quantify the uncertainties in this study. In this model, the aleatory and epistemic uncertainties of the tsunami flooding profiles in a site dependent on the tsunami source belonging to each group were assumed to be distributed lognormally. The composite log-normal standard deviation for the uncertainties was set as
for inundation depths less than 2.5 m and
for those greater than 2.5 m, as proposed by Takahashi et al. [Citation43]. The aleatory and epistemic uncertainties in
were assumed to be equivalent.
The model also assumed that the epistemic uncertainty associated with the representativeness of the flooding profile for the tsunami scenario in each group was lognormally distributed; so, the log-normal standard deviation of the epistemic uncertainty was set as
for inundation depths less than 2.5 m and
for those greater than 2.5 m, as proposed by Takahashi et al. [Citation43].
Although these tsunami-scenario-dependent failure probabilities were used in Grade 4.0, the combined failure probability was used in Grade 3.0. The mean combined failure probability was calculated from EquationEquation 33(33)
(33) . By replacing the mean failure probability
with fractile failure probability in the right-hand side of EquationEquation 33
(33)
(33) , the fractile failure probability in Grade 3.0 was calculated. The hazard contribution in this equation was specified by the summation of the hazard contributions of the tsunami sources belonging to each group, as shown in EquationEquation 33
(33)
(33) . Unlike Grade 1.0 and 2.0, uncertainties due to tsunami-scenario dependent effects are explicitly incorporated by combining the tsunami-scenario-dependent failure probabilities in grades larger than this grade.
The mean failure probability was calculated by EquationEquation 33(33)
(33) is shown in . The fractile failure probabilities were calculated as explained above and are shown in the figure at 10% intervals. The figure also shows the mean and fractile fragility curves for the 5, 50, and 95% confidence levels, which were the cumulative log-normal distribution approximated to the mean and the fractile failure probabilities. The same approach for the calculations of the approximated cumulative log-normal distributions used for Grade 2.0 was also applied here. The median, the aleatory uncertainty
, and the epistemic uncertainty
of the approximated distribution was 42 m, 0.08, and 0.05, respectively.
Figure 13. Failure probability of watertight doors of heat exchanger buildings at each tsunami height is shown with reliabilities at intervals of 10% from 5 to 95% with 10 solid circles for Grade 3.0. Solid line denotes approximated mean fragility curve. Dashed, chain dashed, and chain double-dashed lines denote the approximated fractile fragility curves for 5, 50, and 95% reliabilities.
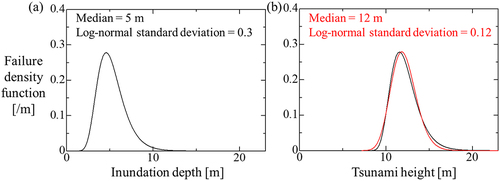
The uncertainties of the fragility curve were very small. These small uncertainties were due to the differences between the abscissa of the fragility curve and that of the capacity. The capacity is a function of the inundation depth, as defined at the beginning of this chapter. On the other hand, the fragility curve is a function of the tsunami height. The inundation depth is the distance from the ground level, but the tsunami height is the distance from the sea surface level. We explain the effect of the difference in the abscissa by using a conceptual diagram shown in . shows the failure density function with a function of the inundation depth. The failure density function is given as a log-normal distribution with a median of 5 m and log-normal standard deviation of 0.3. We replot the distribution as a function of the tsunami height as the black solid line in . The tsunami height is a 7 m higher value than the inundation depth because the ground level is 7 m from the sea surface level. Compared with , the distribution in is shifted to the positive direction of abscissa. The red solid line in is the approximation of the black line to the log-normal distribution. This approximated line is lognormally distributed with a median of 12 m and log-normal standard deviation of 0.12. It is found that the log-normal standard deviation of the red solid line in became smaller, compared with that of .
Figure 14. Conceptual diagram for the explanation on the difference in failure probability due to the difference of the abscissa. (a) Failure density function as a function of inundation depth. (b) Black solid line is the same failure density function as a function of tsunami height. Red solid line is the approximation of the black line in (b).
4.4. Grade 4.0
In Grade 4.0, the same process in Grade 3.0 was used to set the response for each tsunami scenario representing a group. In contrast to Grade 3.0, fragility analysis was performed for each group in Grade 4.0.
The mean failure probability was calculated by EquationEquation 33(33)
(33) is shown in . The fractile failure probabilities were calculated as explained above and are shown in the figure at 10% intervals. The median and log-normal standard deviation for the epistemic and aleatory uncertainties of the capacity are set to 10.1 m, 0.28, and 0.28, respectively, as mentioned above. The figure also shows the mean and fractile fragility curves for the 5, 50, and 95% confidence levels, which were the cumulative log-normal distribution approximated to the mean and the fractile failure probabilities. The median, the aleatory uncertainty
, and the epistemic uncertainty
for the approximated cumulative log-normal distributions are shown in . The failure probabilities for JTNR were very low at tsunami heights of 31–47 m because the inundation depth for this tsunami scenarios was very low as shown in , and thus, the results are not shown in . The median,
and
for JTNR could not be obtained and consequently, they are not shown in .
Figure 15. Failure probability of watertight doors of heat exchanger buildings at each tsunami height for each tsunami scenario is shown with reliabilities at intervals of 10% from 5 to 95% with 10 solid circles for Grade 4.0. Solid line denotes approximated mean fragility curve. Dashed, chain dashed, and chain double-dashed lines denote the approximated fractile fragility curves for 5, 50, and 95% reliabilities.
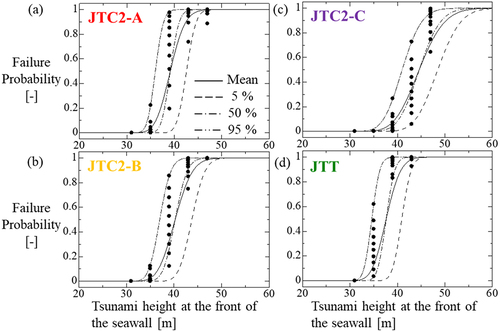
Table 4. Median, , and
of fragility curves for failure of doors of heat exchanger buildings for Grade 4.0. Tsunami sources which tsunami scenarios correspond to are described in the first column.
4.5. Grade 5.0
For Grade 5.0, the tsunami scenarios corresponding to all tsunami sources listed in were used. These scenarios were generated using the same methodology used for Grade 2.0, and inundation simulations were performed for tsunami heights of 31, 35, 39, 43, and 47 m. The numerically calculated inundation depths in front of the doors of the heat exchanger buildings, which are shown in Appendix A1, were set as the median values of the response parameters for each tsunami scenario. Unlike Grades 2.0–4.0, the uncertainties of the tsunami flooding profiles in the site dependent on the tsunami source, and the epistemic uncertainty associated with the representativeness of the flooding profile for the tsunami scenario were not considered in Grade 5.0. This is because this study focuses on the impact of the volume of information on tsunami scenarios on fragility of structures and components, the uncertainties associated with the tsunami flooding profile are not considered in Grade 5.0.
The mean failure probability was calculated by EquationEquation 11(11)
(11) is shown in . The fractile failure probabilities were calculated as explained above and are shown in the figure at 10% intervals. The figure also shows the mean and fractile fragility curves for the 5, 50, and 95% confidence levels, which were the cumulative log-normal distribution approximated to the mean and the fractile failure probabilities. The median, aleatory uncertainty
, and epistemic uncertainty
for the approximated cumulative log-normal distributions for each tsunami scenario are listed in . The epistemic uncertainty of the fragility curves is attributed to that of the capacity. The failure probabilities for some tsunami scenarios were very low at tsunami heights of 31–47 m because the water volume due to the overflow of the seawall in those tsunami scenarios was very low, and thus, the results are not shown in . The median,
and
for JTNR could not be obtained and consequently, they are not shown in .
Figure 16. Failure probability of watertight doors of heat exchanger buildings at each tsunami height for each tsunami scenario is shown with reliabilities at intervals of 10% from 5 to 95% with 10 solid circles for Grade 5.0. Solid line denotes approximated mean fragility curve. Dashed, chain dashed, and chain double-dashed lines denote the approximated fractile fragility curves for 5, 50, and 95% reliabilities.
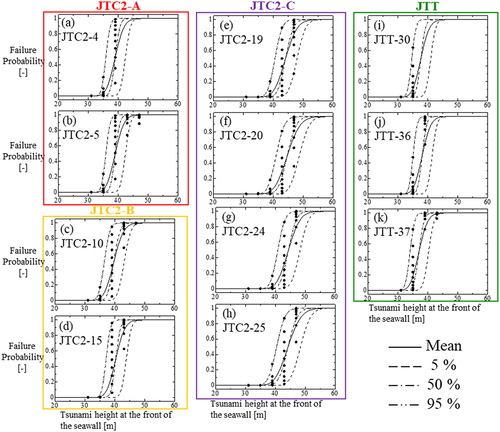
Table 5. Median, , and
of fragility curves for failure of doors of heat exchanger buildings for Grade 5.0. Tsunami sources which tsunami scenarios correspond to are described in the first column.
4.6. Comparison of predicted failure probability at each grade
A comparison of the results mentioned above showed two characteristic differences between the grades. The first was the width of the uncertainty. The uncertainty of failure probabilities at Grades 1.0 and 2.0 was wider than that at Grades 3.0, 4.0, and 5.0. For the higher grades, inundation simulations for multiple tsunami scenarios were carried out for flooding analyses, and the aleatory and epistemic uncertainties of the tsunami flooding profiles were incorporated using numerical predictions. At these grades, predicted inundation depths at the watertight door dependent on tsunami scenarios could be considered in evaluations. Conversely, for the lower grades, the inundation depth at the watertight door was not explicitly known; so, the uncertainty of the tsunami flooding profiles was widely incorporated using engineering judgement. In this study, the uncertainty was set by using the model of Takahashi et al. [Citation43], resulting in wider uncertainty of the failure probabilities as the grade decreased. Thus, this trend is the natural result. It should be noted that more knowledge on the uncertainty of flooding profiles should be accumulated more in order to develop more generalized modellings.
The second characteristic difference was the failure probability at low tsunami heights. The mean failure probability at low tsunami heights (less than 30 m) for the lower grades was higher than that for the higher grades. This characteristic was related to the first one; the wider uncertainty of failure probabilities resulted in higher mean probabilities for the lower grades.
Here, we compared the annual frequencies of failures of the watertight doors evaluated by each grade, since these results were more related to the CDF. The annual frequencies of failure of the watertight doors for each tsunami height were calculated and shown in . The annual frequencies were calculated by integrating the ranges of each discretized tsunami height from EquationEquation 33(33)
(33) , EquationEquation 33
(33)
(33) , EquationEquation 33
(33)
(33) , EquationEquation 33
(33)
(33) , and EquationEquation 33
(33)
(33) for Grades 1.0, 2.0, 3.0, 4.0, and 5.0, respectively. In , the mean values and widths of reliability between 10% and 90% are shown and those of the tsunami hazard are also shown. The hazard shown in is not the same as the hazard curve shown in , and the hazard of was calculated by the integrating the hazard curve in the ranges of each discretized tsunami height.
Figure 17. Annual frequencies of failure of watertight doors of heat exchanger buildings evaluated by Grades 1.0–5.0. Mean values are denoted by solid circles, and width of reliability between 10 and 90% are denoted by error bars. Those of tsunami hazards are also shown.
At a height of 31 m, the annual frequency of failure for Grade 5.0 did not appear because it was much lower than the range of the vertical axis of . For Grade 1.0, the mean annual frequency of failure was close to the mean tsunami hazard because the mean failure probability was over 0.9 at these tsunami heights. For Grade 2.0, the annual frequency was much higher than those for higher grades at 31 m, although it was slightly lower at higher tsunami heights.
It was found that the annual frequency for Grade 3.0 was almost the same as that for Grade 4.0; this was mathematically mentioned in section 3.3. Compared with Grade 5.0, the uncertainties of the annual frequencies for these grades had a little wider. For these grades (Grades 3.0 and 4.0), the tsunami scenarios representative for each group with similar wave forms were used for predicting the flooding profiles. This result showed that these grades would provide reasonable results, although the evaluation cost was lower than that for Grade 5.0.
4.7. Discussion on advantages of adopting high-grade methodology
In Grades 4.0 and 5.0, a set of tsunami fragility and tsunami accident sequence models, including event tree and fault tree analyses, were required for each tsunami scenario and tsunami height, making the evaluation process expensive. However, the adoption of these higher grades provided several advantages. Since tsunami flooding profiles in sites depend strongly on the tsunami scenarios, major accident sequences would depend not only on event tree, fault tree, and fragility, but also on these tsunami scenarios. Consequently, the preparation of a set of fragility, event tree, and fault tree analyses specific to each tsunami scenario could quantify the major accident sequences in more detail, efficiently increasing the reliability of the CDF and PRA models. In these grades, the CCDP and CDF could be evaluated for each tsunami scenario, identifying the tsunami scenarios which may cause major accident sequences. The dominant tsunami scenario evaluated in the tsunami PRA could be used as the beyond-design- basis tsunami scenario for designing additional measures against major accident sequences and reasonably implementing risk reduction measures.
For the plants where it is not obvious that CDF is not sufficiently lower than the criterion of the performance goals of the plant, tsunami PRAs should be repeated from a low grade with a step-by-step increase until necessary risk information is obtained. For these plants, risk information provided by evaluations in Grades 4.0 and 5.0 would be useful.
5. Conclusions
This paper proposed a framework of risk-based graded approach for a tsunami PRA. The framework selects a methodology for incorporating the uncertainties of tsunami hazard analysis in a tsunami PRA, by grade. The framework provides five grades depending on the level of detail in the assessment. Grade 1.0 adopts the simplest methodology, where the relationship between tsunami flooding profiles and the tsunami height at the hazard control point is empirically specified. Grades 2.0 and higher adopt a methodology in which the tsunami flooding profiles are numerically predicted using inundation simulations for tsunami scenarios. At Grade 2.0, a characteristic tsunami – such as the design-basis tsunami – is determined to be the tsunami scenario. At Grades 3.0 and 4.0, tsunami scenarios with similar forms are grouped, and a tsunami scenario representative for each group is determined. At Grade 5.0, the tsunami scenarios corresponding to tsunami sources with hazard contributions higher than a negligibly small value are determined.
The graded approach was experimentally applied to the fragility analysis of a tsunami PRA for a virtual nuclear power station located along the Pacific coast. A comparison of the predicted failure probabilities for each grade showed two characteristic differences between the grades. The first was the width of uncertainty, the uncertainty of failure probabilities at Grades 1.0 and 2.0 being wider than those at Grades 3.0, 4.0, and 5.0. The second was the failure probabilities at low tsunami heights, the mean failure probability at low tsunami height for the lower grades being higher than that for the higher grades.
Tsunami risks differ significantly between sites, and risk information needed to identify vulnerabilities due to tsunamis and related measures is site-dependent. The risk-based graded approach considers both the characteristics and circumstances of sites and we believe it is a practical framework.
Acknowledgments
We would like to thank Dr. Toshiaki Sakai and Dr. Masato Nakajima for useful discussions on the concepts of good PRA.
Disclosure statement
No potential conflict of interest was reported by the author(s).
References
- Japan Association for Earthquake Engineering (JAEE). Tsunami resistant engineering for nuclear safety, association for earthquake engineering (JAEE. Tsunami Resistant Engineering For Nuclear Safety – Toward On Integrated Framework For Earthquake-Tsunami Protection. 2015;283: in Japanese.
- International Atomic Energy Agency (IAEA), 2012. IAEA report on protection against extreme earthquakes and tsunamis in the light of the accident at the Fukushima Daiichi nuclear power plant, IAEA. Available from: https://www-pub.iaea.org/MTCD/Publications/PDF/IEM-3_web.pdf.
- Miller C, Cubbage A, Dorman D et al., July 12, 2011. Recommendations for enhancing reactor safety in the 21st century: the near-term task force review of insights from the fukushima dai-ichi accident, U.S. Nuclear Regulatory Commission. Available from: http://pbadupws.nrc.gov/docs/ML1118/ML111861807.pdf.
- Bensi M, Ferrante F, Philip J Assessment of flood fragility for nuclear power plants: Challenges and next steps. Proceedings of 23rd Conference on Structural Mechanics in Reactor Technology. Manchester, UK; 2015; paper ID 533.
- Bensi M, Kanney F Development of a framework for probabilistic storm surge hazard assessment for United States nuclear power plants. Proceedings of 23rd Conference on Structural Mechanics in Reactor Technology. Manchester, UK; 2015; paper ID 534.
- Sugino H, Iwabuchi Y, Nishio M et al. Development of probabilistic methodology for evaluating tsunami risk on nuclear power plants, The 14th World Conference on Earthquake Engineering. Beijing, China; 2008.
- Ebisawa K, Sugino H, Iwabuchi Y et al. Usability of tsunami PRA based on accidents of Fukushima Dai-ichi NPP under 2011 Tohoku tsunami, The 15th World Conference on Earthquake Engineering. Lisbon, Portugal; 2012.
- American Society of Mechanical Engineers/American Nuclear Society. Addenda to ASME/ANS RA-S-2008 standard for level 1/large early release frequency probabilistic risk assessment for nuclear power plant applications, standard ASME/ANS RA-Sb–2013. Washington DC: American National Standards Institute (ANSI); 2013.
- Atomic Energy Society of Japan (AESJ). Implementation standard concerning the tsunami probabilistic risk assessment of nuclear power plants. Tokyo: AESJ; 2013.
- Atomic Energy Society of Japan (AESJ). AESJ-SC-RK004:2016. Implementation standard concerning the tsunami probabilistic risk assessment of nuclear power plants. Tokyo: AESJ; 2019. in Japanese.
- Rebour V, Georgescu G, Leteinturier D et al. Guidance document on practices to model and implement external flooding hazards in extended PSA, IRSN-PSN-RES-SAG-PSN-RES-SAG. ASAMPSA_E. 2017;22, 111.
- EPRI. December 2003. Seismic probabilistic risk assessment implementation guide, epri tr. electric power research institute (EPRI), Palo Alto, California, p. 1002989.
- EPRI. December 2009. Seismic fragility applications guide update, epri. electric power research institute (EPRI), Palo Alto, California, p. 1019200.
- American Society of Mechanical Engineers/American Nuclear Society. External-Events PRA Methodology, Standard ANSI/ANS-58.21-2007. Washington DC: American National Standards Institute (ANSI); 2007.
- Bensi M, Cook C, Chokshi N Integrated assessment of flooding hazards at us nuclear power plants. Proceedings of 22nd Conference on Structural Mechanics in Reactor Technology. San Francisco, USA; 2013; paper ID 694.
- Kim MK, Choi IK. A tsunami PSA methodology and application for NPP site in Korea. Nucl Eng Des. 2012;244:92–99. doi: 10.1016/j.nucengdes.2011.12.001
- Smith C, Mandelli D, Prescott S et al. Analysis of pressurized water reactor station blackout caused by external flooding using the RISMC toolkit. Idaho, USA: Idaho National Laboratory; 2014. pp. INL/EXT-14–32906.
- Smith C, Bhandari B, Muchmore C et al. Flooding fragility experiments and prediction. Idaho, USA: Idaho National Laboratory; 2016. pp. INL/EXT-16–39963.
- Smith C, Rabiti C, Martineau R et al. Risk-informed safety margins characterization (RISMC) pathway technical program plan. Idaho National Lab. 2016;INL/EXT-11–22977.
- Prescott SDM, Sampth R, Smith C. 3D simulation of external flooding events for the RISMC pathway. Idaho National Lab. Idaho, USA. 2015;INL/EXT-15–36773, 38.
- Bodda SS, Gupta A, Dinh N. Risk informed validation framework for external flooding scenario. Nucl Eng Des. 2020;356:110377. doi: 10.1016/j.nucengdes.2019.110377
- Geist EL, Parsons T. Probabilistic analysis of tsunami hazards. Nat Hazards. 2006; 37(3):277–314. DOI:10.1007/s11069-005-4646-z.
- Annaka T, Satake K, Sakakiyama T et al. Logic-tree approach for probabilistic tsunami hazard analysis and its applications to the Japanese coasts. Pure Appl Geophys. 2007;164(2–3):577–592. doi: 10.1007/s00024-006-0174-3
- Japan Society of Civil Engineers (JSCE); 2016. Tsunami assessment method for nuclear power plants in Japan 2016. Available from: http://committees.jsce.or.jp/ceofnp/system/files/NPP_TNMT_2016_main_20170814.pdf. [in Japanese]
- Mori N, Muhammad A, Goda K et al. Probabilistic tsunami hazard analysis of the Pacific coast of Mexico: Case study based on the 1995 Colima earthquake tsunami. Frontiers In Built Env. 2017;3:34. doi: 10.3389/fbuil.2017.00034
- Cornell CA. Engineering seismic risk analysis. Bull Seismol Soc Am. 1968;58(5):1583–1606. doi: 10.1785/BSSA0580051583
- Basu PC, Ravindra MK, Mihara Y. Component fragility for use in PSA of nuclear power plant. Nucl Eng Des. 2017;323:209–227. doi: 10.1016/j.nucengdes.2016.10.018
- Haraguchi R, Togashi T, Kunimasa T et al. Development of a fragility evaluation methodology for the Tsunami PRA. ASRAM. Yokohama, Kanagawa, Japan; 2017;ASRAM2017–1051.
- Kennedy RP, Campbell RD, Hardy G et al. Subsystem Fragility: seismic safety margins research program (Phase I). NUREG/CR-2405. CA, USA: Lawrence Livermore National Lab. (LLNL), Livermore. 1981:pp. UCRL–15407.
- Kaida H, Miyagawa Y, Kihara N Methodology for fragility evaluation of a seawall against tsunami effects - part 1: overflow and physical damage associated with tsunami wave pressure, Proceeding of 24th International Conference of Nuclear Engineering (ICONE24), North Carolina, USA, ICONE24–60927; 2016.
- Atomic Energy Society of Japan (AESJ). A standard for procedure of seismic probabilistic risk assessment for nuclear power plants, AESJ-SC-P006E. Tokyo, Japan: AESJ: 2015.
- Kihara N, Kimura T, Kaida H et al. A methodology of determination of scenario tsunami for fragility assessment based on hazard deaggregation - Determination method of tsunami conditions arriving at a site with a specific scale. in Japanese J JAEE. 2016;18(1):_1_35–_1_58. doi: 10.5610/jaee.18.1_35
- Kihara N, Kaida H, Kimura T et al. A tsunami scenario determination methodology for risk assessment of coastal industrial facilities. The. Proc. 29th International Ocean and Polar Engineering Conference. Honolulu, Hawaii, USA; 2019; pp. 3292–3296.
- McGuire RK. Probabilistic seismic hazard analysis and design earthquakes: closing the loop. Bull Seismol Soc Am. 1995;85(5):1275–1284. doi: 10.1785/BSSA0850051275
- Bazzuro P, Cornell C. Disaggregation of seismic hazard. Bull Seismol Soc Am. 1999;89(2):501–520. doi: 10.1785/BSSA0890020501
- Ishikawa Y, Kameda H Hazard-consistent magnitude and distance for extended seismic risk analysis, Proceedings of the 9th World Conference on Earthquake Engineering. Tokyo-Kyoto, Japan; 1988; 11, pp. 89–94.
- US Nuclear Regulatory Commission; November 2012; ADAMS Accession No. ML12311A214. (U.S.NRC), JLD-ISG-2012-05. guidance for performing the integrated assessment for external flooding 2012.
- Budnitz RJ. Current status of methodologies for seismic probabilistic safety analysis. Reliab Eng Syst Saf. 1998;62(1–2):71–88. doi: 10.1016/S0951-8320(97)00158-0
- Kameda H Engineering agenda on nuclear safety from the 2011 Tohoku-Pacific earthquake. Proceedings of International Symposium Engineering Lessons Learned from the 2011 Great East Japan Earthquake, Mar 1–4, 2012, Tokyo, Japan, pp. 102–121.
- Ministry of Land, Infrastructure, Transport and Tourism (MLIT). Guide to Determining the Potential Tsunami Inundation, 2.00 version. Seacoast Office, Water And Disaster Management Bureau, Ministry Of Land, Infrastructure, Ministry Of Land, Infrastructure, Transport And Tourism. 2012.
- Montanari N, Sampath R, Weglian JE et al. Coupling smoothed-particle hydrodynamics and torricelli’s law-based hydraulic models for flooding risk analysis. Proceedings of International Topical Meeting on Probabilistic Safety Assessment and Analysis. Pennsylvania, USA; 2017; pp. 146–155.
- U.S.NRC, Updated Implementation Guidelines for SSHAC Hazard Studies. 2018. (NUREG-2213), NUREG-2213, https://www.nrc.gov/docs/ML1828/ML18282A082.pdf.
- Takahashi Y, Mihara Y, Kaida H et al. Uncertainty quantification of tsunami parameters for tsunami fragility assessment based on tsunami hazard assessment and inundation simulation. Proceedings of 15th International Conference on Probabilistic Safety Assessment & Management (PSAM); 2020; doi: 10.3850/981-973-0000-00-0 esrel2020psam15–paper.
- Kennedy RP, Cornell CA, Campbell RD, et al. Probabilistic seismic safety study of an existing nuclear power plant. Nucl Eng Des. 1980;59(2):315–338. doi: 10.1016/0029-5493(80)90203-4
- Asakura R, Iwase K, Ikeya T et al. Experimental study on wave force acting on on-shore structures due to overflowing tsunamis. Proceedings of Coastal Engineering, JSCE. Kobe, Hyogo, Japan. 2020; 47, pp. 911–915 [in Japanese]
- Koshimura S, Oie T, Yanagisawa H et al. Developing fragility functions for tsunami damage estimation using numerical model and post-tsunami data from Banda Aceh, Indonesia. Coast Eng J. 2009;51(3):243–273. doi: 10.1142/S0578563409002004
- Ando K, Itoi T, Takada T. Collapse mode-based fragility curves against tsunami for low- and medium- rise reinforced concrete buildings. J Struct Constr Eng. 2013;78(693):1851–1857. doi: 10.3130/aijs.78.1851 in Japanese.
- Suppasri A, Mas E, Koshimura S et al. Developing tsunami fragility curves from the surveyed data of the 2011 Great East Japan tsunami in Sendai and Ishinomaki plains. Coast Eng J. 2012;54(1):1250008–1250016. doi: 10.1142/S0578563412500088
- Cabinet Office of Japan. On the tsunami source model of the 2011 off the Pacific coast of Tohoku earthquake. Report of 12th meeting on the source model of the giant earthquake along the Nankai Trough. 2012. [in Japanese]
Appendix.
Table A1. Inundation depth in front of watertight door of heat exchanger building calculated using inundation simulation for each tsunami scenario at tsunami heights of 31, 35, 39, 43, and 47 m. The tsunami sources which tsunami scenarios corresponds to are described. The tsunami sources with non-zero hazard contributions are listed, and [-] are described if there are not such tsunami sources corresponding to the ranks.