
 ?Mathematical formulae have been encoded as MathML and are displayed in this HTML version using MathJax in order to improve their display. Uncheck the box to turn MathJax off. This feature requires Javascript. Click on a formula to zoom.
ABSTRACT
This study investigated the feasibility of reducing the uncertainty associated with fast-reactor-core design by sharing an experimental database between different fields (e.g. reactor physics and radiation shielding) using data assimilation techniques. As the first step in this study, we focused on the ORNL sodium shielding experiment and investigated the possibility of using the experimental data to reduce the uncertainty in sodium void reactivity (SVR), which is the most important safety parameter for sodium-cooled fast reactors. A sensitivity analysis based on the Generalized Perturbation Theory was performed for the sodium shielding experiment. Using the sensitivity coefficients evaluated here and those of the sodium void reactivity previously evaluated by the JAEA, we showed that sodium shielding experimental data can contribute to the uncertainty reduction of SVR by adopting the cross-section adjustment method. Based on this study, the uncertainty reduction effect is expected to be significant, especially for SVR dominated by neutron-leakage phenomena. Although new reactor physics experimental data on SVR may be difficult to obtain, the results of this study suggest that data from sodium shielding experiments can partially substitute for this role. This study demonstrated the value of the mutual use of integral experimental data in fast reactor designs.
Graphical Abstract
1. Introduction
Since the Fukushima Daiichi Nuclear Power Plant accident in 2011, reliability of numerical calculations has become increasingly important for nuclear reactor safety. Data assimilation is one of the most promising techniques for improving reliability. Historically, studies on nuclear data-sensitivity analysis and data assimilation (e.g. the cross-section adjustment method) based on first-order perturbation theory have been performed in the field of reactor physics for fast reactors. To improve the reliability of fast-reactor-core design, the Japan Atomic Energy Agency (JAEA) developed a database of integral experimental data and an adjusted cross-section set for fast reactor cores [Citation1–3]. However, further extension of the experimental database for fast reactors is becoming difficult owing to the challenges in constructing new facilities for reactor physics experiments. To address this issue, we investigate the possibility of adding shielding experimental data to the database. If the shielding experimental data are effective in reducing the uncertainty of fast-reactor-core characteristics, it would be meaningful to develop a common database for core and shielding designs.
In this study, we focus on a sodium shielding experiment [Citation4,Citation5] conducted at the Tower Shielding Facility (TSF) of the Oak Ridge National Laboratory (ORNL). We aimed to reduce the uncertainty of sodium void reactivity (SVR) using data from this sodium shielding experiment. The SVR is one of the most important parameters for reactor core safety in the design of sodium-cooled fast reactor (SFR) cores. Reducing this uncertainty using data assimilation techniques typically requires experiments to simulate sodium-voided cores. However, because a sodium-voided core is an abnormal condition that deviates from normal reactor operation, it is difficult to obtain data during the operation of an actual nuclear power reactor. Therefore, these experiments were primarily conducted at critical facilities. However, based on past experience, because sodium void experiments with small void regions have relatively larger experimental errors than the nuclear data-induced uncertainty, large-scale experimental facilities are required to obtain high-quality data that can be used to validate nuclear data. Therefore, it is impractical to obtain new data useful for reducing SVR uncertainty in the future. If it is possible to show that the uncertainty of SVR can be reduced using sodium shielding experimental data, the sodium shielding experimental data can be substituted for sodium void experiments, for which it is very difficult to obtain data. Consequently, this study will motivate the development of a common database to improve the safety and reliability of SFR designs.
In recent years, sensitivity analyses of shielding experiments and evaluations of nuclear-data-induced uncertainty have been actively performed [Citation6,Citation7]. The main objective of these studies was to create a shielding database for application in radiation-shielding design. To the best of our knowledge, there has been no quantitative discussion on the effectiveness of using shielding experimental data for uncertainty reduction in fast-reactor-core design. Therefore, in this study, we aim to clarify the effectiveness of sodium shielding through an analysis of experimental data and its application to SVR evaluation.
The remainder of this paper is organized as follows: Section 2 briefly describes the methodology of sensitivity analysis for the sodium shielding experiment and the data assimilation technique used to apply the results to uncertainty reduction in SVR; in Section 3, sodium shielding experiments and their calculation conditions are explained; the numerical results of sensitivity analysis and data assimilation, followed by a discussion of the data assimilation results, are presented in Section 4. Finally, concluding remarks are presented in Section 5.
2. Methodology
2.1. Sensitivity coefficients
Conventional nuclear data sensitivity analysis of the reactor physics experiment for fast reactors was performed by diffusion calculations using the generalized perturbation theory (GPT) [Citation8] at JAEA. This is because the diffusion calculation can be expected to achieve sufficient accuracy in uncertainty quantification in fast-reactor-core analysis. However, diffusion calculations are not always suitable for shielding analyses. Therefore, we discuss a sensitivity analysis method based on transport theory that can be applied not only to reactor physics experiments but also to shielding experiments.
The multigroup neutron transport equation applied to shielding analysis is expressed as follows:
where is a neutron flux and
is an external neutron source. These vectors have dimensions equal to the number of energy groups. The operator
is
where denotes the real spherical harmonic. Here,
and
are diagonal matrices. Note that the total cross-section
acquires moment dependence when energy discretization is performed. To eliminate moment dependence on the total cross-section,
is introduced as a collision term in the transport Equation [Citation9]. The terms related to
in the operators
and
cancel each other out when
. In practice,
is truncated to a finite number and, for example, the transport cross-section is used as
. On the other hand, the adjoint of Equation (1) is
where, is the adjoint operator of
,
is the (generalized) adjoint flux, and
is an adjoint source (e.g. normalized detector response in this study). If we want to know the sensitivity for a parameter
(e.g. reaction rate), we assume
Consequently, the sensitivity coefficient with respect to nuclear data (e.g. infinite dilution cross-section) is represented as follows:
where the bracket notation ‘< >’ indicate the integrals of all phase spaces, and the superscript ‘‘ indicates the transpose.
In the shielding analysis, the forward and adjoint transport equations in Equations (1) and (5) frequently deal with point sources located in a low-density medium. In this situation, the singular behavior of the numerical solution caused by point sources, called the ray effect [Citation10], is a concern in Sn transport calculations. To mitigate the ray effect, we employed the First Collision Source (FCS) technique [Citation11–13] in the Sn transport calculation. In the FCS technique, the neutron flux is evaluated from the uncollided and collided fluxes,
and
, respectively, as follows:
The distribution of the uncollided flux produced by the point source obeys the following equation:
The uncollided flux distribution was evaluated semi-analytically using the ray-trace technique [Citation13]. Once is evaluated, the distribution of the collided flux
can be calculated as follows:
From Equations (8)–(11), it was found that the total neutron flux of Equation (8) satisfied the original transport in Equation (1). The same discussion is possible for the adjoint flux,
. Using
and
evaluated by the FCS technique expressed by the equations (8)–(11), the sensitivity coefficients are evaluated based on Equation (7).
2.2. Data assimilation technique
Historically, the cross-section adjustment method [Citation14], based on first-order perturbation theory, has been used as a data assimilation technique in the field of reactor physics analysis for fast reactors. We assume that the perturbation theory is still valid for the shielding analysis, and the conventional cross-section adjustment is applied as a data assimilation technique. The effects of nonlinearity were not considered in this study.
Let be the a priori nuclear data set and
be its covariance. When the experimental data (experimental values
and their calculated values
) used for data assimilation are obtained, the adjusted nuclear dataset
and its covariance
after adjustment are represented as follows:
where is the sum of the experimental covariance
and the analytical modeling covariance
.
Let the sensitivity coefficient of the target parameter of the uncertainty reduction be . The variance after the adjustment is given by
The first term on the right-hand side of Equation (15) represents the nuclear data-induced uncertainty before adjustment. The second term represents the amount of the variance reduction. When the number of experimental data points is one, Equation (15) becomes
Here, denotes the representativity factor [Citation15], which indicates the correlation of the nuclear data-induced uncertainties between the experimental data and the target parameter, and
is the fraction of the variance associated with nuclear data-induced uncertainty in the total variance. The variance-reduction effect obtained by cross-section adjustment depends on these two factors when one experimental data point is used for data assimilation.
3. Experiment and calculational conditions
3.1. ORNL sodium shielding experiment
This subsection provides an overview of the ORNL sodium shielding experiment conducted at the TSF. This experiment was conducted using up to four 66-inch-radius cylindrical aluminum containers filled with sodium (hereafter referred to as sodium tanks), stacked axially. The aluminum containers were 1/2-inch-thick at the top and bottom, and 1/4-inch-thick on the sides. The sides of the sodium tanks were surrounded by at least 18 inches of concrete. Tanks 1 and 4 were approximately 30 inches thick (height in the z-direction), and tanks 2 and 3 were approximately 60 inches thick. The sodium tanks were used individually or in combination during the experiments. The total thickness of the sodium shield ranged from 30 to 180 inches. The configuration of the experimental system when the measurement was performed 24 inches behind 180 inches of the sodium shield is shown in .
Figure 1. Configuration of the ORNL sodium shielding experiment.
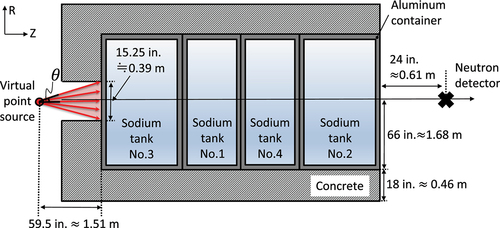
A collimated neutron beam from a Tower Shielding Reactor (TSR) was used as the neutron source for the shielding experiment. Based on the original reports [Citation4,Citation5], this neutron source can be modeled as a point source emitting neutrons only in the exit direction of the collimator (the emission angle is .). This source provides a beam of uniform intensity at the surface of the collimator exit. The intensity and spectrum at the surface were fed as digital values in a 100-group energy structure used in GAM-II [Citation16] (hereafter referred to as GAM-II 100-group structure). Digital values of the neutron source spectrum used in this sensitivity analysis study are presented in Supplementary Material A.
The neutron detectors used in this experiment were Bonner spheres or balls (BBs), an NE-213 spectrometer, and a Benjamin spectrometer (BS). BBs were cadmium coated spherical BF3 proportional counters surrounded by 3–12 inches of polyethylene (hereafter, BB with x inches of polyethylene is written as ‘x” BB‘, BB without polyethylene is written as ‘Cd BB‘). The response to the neutron spectrum varies with the thickness of polyethylene. In this study, measurement data using 3˝, 6˝, 12˝ BBs, and Cd BB were selected for the analysis. The other type of BB was 10B-wrapped 3 inches BB (‘Mod BB’). The response functions of BBs are presented in the form of graphs [Citation4,Citation5]. The digital values of the response functions used in this sensitivity analysis study are provided in Supplementary Material A. These digital values were determined to reproduce the graphs presented in Refs [Citation4,Citation5] based on Refs [Citation17,Citation18].
The NE-213 was a liquid scintillator spectrometer designed to obtain spectra in the range of 0.8 to 15 MeV using an unfolding code. The BS is a spherical proton recoil counter designed to obtain spectra in the range of ~70 keV to 1.5 MeV using an unfolding code. The unfolding results of the BS measurements used the unfolded neutron spectrum of the NE-213 measurements as the input for the neutron flux in the high-energy region [Citation19]. Because unfolding can be a large source of error, we excluded the measurement data using BS from the analysis targets because of concerns associated with large uncertainties. To reduce the error caused by the unfolding of the NE-213 measurement, the energy-integrated value for the flux was used in this study. In Ref [Citation4], the upper and lower limits of the unfolded fluxes are discretely given in the MeV range. We calculated the intermediate values of these upper and lower limits and connected each point linearly (). The area comprising the solid line in was used as the experimental value for the NE-213 measurement.
Figure 2. Result of neutron flux obtained by NE-213 measurement.
The measurement data selected as the analysis targets of this study are summarized in along with the experimental values of described in Ref [Citation4]. The experimental uncertainty is described in Section 4.3.
Table 1. Target measurements for analysis and their experimental values [4].
The data listed in were measured approximately 24 inches behind the shield on the central axis of the tank. According to Refs [Citation4,Citation5], although some data were measured at different distances from the shield and at different offset positions from the central axis, these data were not considered in this study.
3.2. Calculational conditions
The continuous-energy Monte Carlo (MC) code MCNP5 [Citation20] was used to evaluate the calculated value , and validate the deterministic calculations for the evaluation of the sensitivity coefficients. The neutron cross-section library in the ACE format, FSXLIB-J40 [Citation21], based on the Japanese evaluated nuclear data library, JENDL-4.0 [Citation22], was used in this calculation. CADIS [Citation23], a variance-reduction technique for statistical errors due to MC calculations, was used to reduce the computational cost. The parameters related to the source bias and weight window were evaluated via preliminary calculations using ADVANTG [Citation24]. The number of histories was set such that the statistical errors were less than 1% in order to be deemed negligible.
The procedure for evaluating the sensitivity coefficients with respect to the nuclear data is illustrated in . First, we prepared a 200-group energy structure for the sensitivity analysis of the shielding experimental data. This structure is suitable for investigating the effectiveness of the shielding experiments in reducing the uncertainty of SVR. Because the structure has the energy boundaries of the UFLIB 70-group structure [Citation25], which was used for reactor physics sensitivity analysis at the JAEA [Citation1–3]. The 200-group structure was constructed based on the VITAMIN-B6 [Citation26] 199-group structure, which has been used as a shielding library (200n-47g library) in the SCALE code system [Citation27]. In order to obtain the 200-group structure, the following two modifications were made to the VITAMIN-B6 199 group structure: (1) the upper energy of the first group was extended to 20 MeV (19.64 MeV for VITAMIN-B6), (2) the group in the range of 1.11–1.00 MeV was divided into two groups. Thus, the 200-group structure had the energy boundary of the UFLIB 70-group structure. In addition, the 200-group structure also contained the energy boundaries of the GAM-II 100-group structure used to express the source spectrum.
Figure 3. Procedure for evaluating the sensitivity coefficients with respect to nuclear data.
Using NJOY-2016 [Citation28], we created a multigroup library in the UFLIB format [Citation25] from the evaluated nuclear data library JENDL-4.0. The UFLIB is a set of group constants for fast-reactor-core analysis provided by JAEA. In this study, a self-shielding factor table with a wider range of background cross-sections was prepared for shielding analysis. The range of the background cross-section was 10−6 −106 barns. The weight function option in GROUPR is set to iwt = 4 (1/e + fission spectrum + thermal Maxwellian). The self-shielding factors were evaluated using SLAROM-UF [Citation29], a cell calculation code for fast-reactor-core analyses. To evaluate the self-shielding factors, infinite homogeneous cell models were used for each material region.
The flux and adjoint flux used to evaluate the sensitivity coefficients were calculated using PARTISN [Citation30]. The flux moments were taken from the ‘rmflux‘ (‘amflux’) and ‘ucflux’ files. Note that the higher moments of the uncollided flux were taken from the ‘ucflux’ files. The source program was improved to treat point-source-emitting neutrons only at a limited angle. Using the function to perform ray-trace calculations for a beam source with a given emission angle, we added the function to perform the following calculations: (1) The in Equation (11) is evaluated for the beam source with a certain emission angle
; (2) calculations of procedure (1) were repeated for different emission angles; and (3) the sum of
was calculated for all
. Consequently, the collided flux
was evaluated using only one Sn-transport calculation.
The spatial meshes in the sodium-shielding region were radially (r-direction in ) divided by approximately 2.0-cm width and axially (z-direction in ) by approximately 1.0-cm width, respectively. For the angular meshes, was used for the 30˝- and 60˝-thick sodium shield analyses, and
was used for the other analyses using a triangular Chebyshev–Double Legendre quadrature. Thinner shield systems require more angular meshes because of the strong anisotropy of the flux. The convergence criteria of the inner iterations were set so that the maximum pointwise flux change was less than 10−5. Using the flux and adjoint flux obtained here, the previously evaluated self-shielding factor, and infinite dilution cross-sections, the sensitivity coefficients were evaluated by the transport calculation with GPT, as shown in the previous section.
Next, we discuss the assumptions used to evaluate the sensitivity coefficients and nuclear data-induced uncertainty. The main assumptions are as follows: (1) the sensitivity with respect to the cross-section , which disappears when
, was not considered. (2) The sensitivity coefficients for the cross-sections were evaluated for infinite dilution cross-sections, and the ‘implicit effect‘ on the sensitivity coefficients [Citation31,Citation32] was not considered. (3) The sensitivity coefficients of the scattering cross-sections were summed for the scattering out-scatter group. (4) The nuclear data-induced uncertainty with respect to
(P1 scattering cross-section) was evaluated from the covariances for
(P0 scattering cross-section) and
(the average cosine of the scattering angle) based on the relationship
. (5) Because the covariances of
for the inelastic scattering and (n, 2n) reactions were not given, they were substituted by the covariance of
for the elastic scattering reaction.
The nuclear data-induced uncertainty and cross-section adjustment based on Equations (12) and (13) were evaluated using the MARBLE code system [Citation33] with Python. The covariance of the 70-group structure in the JAEA database [Citation1] based on JENDL-4.0 was used as the nuclear data covariance in these equations.
4. Numerical results
4.1. Calculated values
summarizes the numerical results of the values calculated using MCNP5 and PARTISN for the measurement data listed in . Note that, for the neutron source spectrum used in the MCNP calculations, we used the digital values from Ref [Citation4]. as they are (i.e. not the 200-group spectrum processed for the sensitivity analysis). Statistical errors in the MCNP5 results were less than 1%. The magnitudes of the relative differences between the MCNP5 and PARTISN results were 1.1% on average and 3.0% at maximum. These differences are comparable to the target value of the statistical error in the MC calculations, as shown in Section 4.3, which is sufficiently small compared to the experimental uncertainty. Consequently, the calculation results of ,
, and effective cross-sections used to evaluate the sensitivity coefficients in Equation (7) were validated as reasonable. We employed the MCNP5 results as
in the cross-section adjustment method.
Table 2. Numerical results for calculated values.
4.2. Sensitivity coefficients
shows the representative relative sensitivity coefficients of the BB reaction rate or neutron flux with respect to the nuclear data for Na-23 (microscopic cross-section of the capture reaction: , elastic scattering reaction:
, inelastic scattering reaction:
, and the average cosine of the elastic scattering angle:
). In the legend of , the values in square bracket ‘[and]‘ indicate the energy-integrated values of the corresponding sensitivity coefficients (one-group sensitivity coefficients).
Figure 4. Relative sensitivities for different measurements with respect to Na-23.
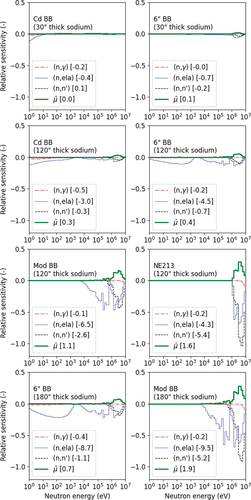
Cd BB showed relatively higher sensitivity in the low-energy range. Conversely, Mod BB showed a relatively higher sensitivity in the high-energy range among the different BBs. The 6˝ BB showed intermediate characteristics. The sensitivity of NE-213 is limited to the megaelectronvolt (MeV) energy range. The magnitude of the sensitivity increased with the thickness of the sodium shield. The highest sensitivity was due to the elastic scattering cross-section. The sensitivity of the inelastic scattering cross-section and the average cosine of the elastic scattering angle were higher in the MeV region.
4.3. Uncertainty quantification
The sources of experimental uncertainties considered in this study are listed in . The experimental uncertainties due to these uncertainty sources in the measurement data were evaluated based on the original report [Citation5] and related references [Citation19]. The results of the sensitivity analysis were also used to evaluate the uncertainty. The total experimental uncertainties were evaluated, as shown in (see Supplementary Material B for details). The main contributions came from uncertainties owing to the neutron source and detectors. In addition, in the case of the 180˝ sodium shield with the Mod BB measurement, the uncertainty due to background correction also contributed significantly.
Table 3. Sources of uncertainty in experimental and analytical modeling.
Table 4. Quantification results of experimental and analytical modeling uncertainties.
On the other hand, the sources of the analytical modeling uncertainties considered in this paper are also listed in . The upper limit of the MCNP statistical error of 1% was used as the uncertainty. In addition, the uncertainties due to missing nuclear data covariance were also considered as uncertainties in this study (see Supplementary Material B for details). Consequently, the total analytical modeling uncertainties were evaluated, as listed in .
These experimental and analytical modeling uncertainties were used to set the covariance . In the absence of sufficient information to evaluate the correlations between the uncertainties, we tentatively assumed that there were no correlations. The validity of this assumption is discussed later in this study.
4.4. Validity of uncertainty quantification
We quantified the major uncertainties in the previous subsection. However, some uncertainties may be difficult to recognize or quantify. To confirm the validity of uncertainty quantification, this study employed the two approaches described below.
The first uses the following indicator [Citation34]:
where is the number of experimental data points used for the data assimilation. When the data follow a Gaussian distribution, this indicator is called ‘reduced chi-squared statistic‘. This indicator can be used to check the statistical consistency between the deviations of the experimental and calculated values and the uncertainty provided by analysts. If
, it suggests an underestimation of the uncertainty, and therefore, the covariance should be improved. On the contrary,
suggests the sufficiency of the uncertainty, i.e. the uncertainty is not underestimated.
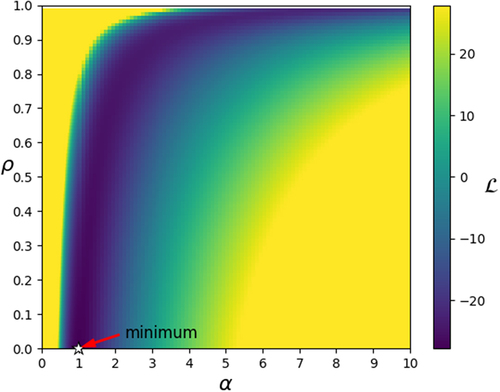
The second approach is to use the following indicator called ‘logarithmic marginal likelihood‘ [Citation35,Citation36]:
where is the determinant of the matrix
. This indicator is often used for covariance modeling. The covariance model was determined such that
was minimal. For example, using the two free parameters
and
, the covariance associated with the experimental and analytical modeling uncertainties can be modeled as follows:
where is a diagonal matrix with the square roots of the diagonal elements of
, and
is a correlation matrix. Parameter
tunes the magnitude of the covariance
, and
tunes the value of the correlation. We use this indicator to discuss the sufficiency of uncertainties and the validity of the
assumption.
First, we evaluated the indicator in Equation (19) as using the
obtained from the uncertainties in . This indicates that the uncertainties listed in are sufficient. On the other hand, based on Equation (20), each
was parametrically evaluated in the range of
, which yielded the map shown in . The minimum point of
is
. This result indicates that the evaluated covariance
is favorable. Based on the results obtained using the two different indicators, we decided to use
as is for the cross-section adjustment.
Figure 5. Logarithmic marginal likelihood map.
4.5. Data assimilation
In this subsection, we discuss the effectiveness of data assimilation using sodium shielding experimental data to reduce SVR uncertainty. The target core for uncertainty reduction should be set as a candidate for the reactor cores to be designed in the future. However, in this study, to investigate the effectiveness of the shielding experimental data comprehensively, we used actual cores whose sensitivity coefficients had already been evaluated in the JAEA database. Seventy-one pieces of experimental SVR data from a database were used in this study.
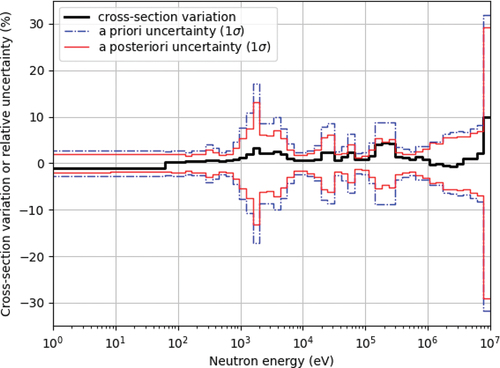
shows the variation in the microscopic elastic scattering cross-section of Na-23 with cross-section adjustment. The uncertainty reduction was mainly observed in the 103–106 eV energy range. For example, around 200 keV, the a priori uncertainty of 9% is reduced to the a posteriori uncertainty of 4%. The uncertainty reduction in the inelastic scattering cross-section and the were relatively small compared to that of the elastic scattering cross-section.
Figure 6. Results of cross-section adjustment.
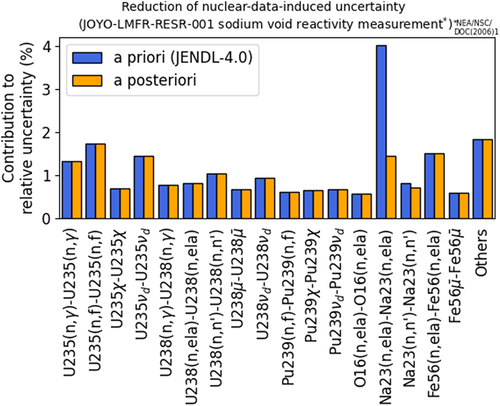
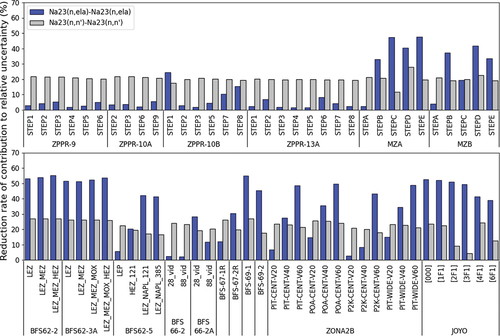
shows the uncertainty reduction effect on the various SVRs in the JAEA database when the adjusted cross-section is used. The labels on the horizontal axis indicate the names of experimental systems in the database. The details of these experiments are provided in Refs [Citation1–3]. The reduction rate of the contribution of Na-23 to the relative uncertainty is shown in this figure. The reduction rate is defined by the relative decrease in the contribution between before and after data assimilation. The uncertainty reduction effect of the inelastic scattering cross-section was small, regardless of the data. However, for the elastic scattering cross-section, larger effects were observed in some cases.
Fig 7. Reduction rate of contribution to relative uncertainties for SVRs.
shows the uncertainty components before and after the cross-section adjustment for the JOYO MK-I SVR, which exhibits the most significant uncertainty reduction effect in . Although the contribution from the elastic scattering cross-section of Na-23 was dominant before adjustment, it was reduced to the same level as the other major contributions by the adjustment. Therefore, data from sodium shielding experiments can contribute to a reduction in the uncertainty of the SVR.
Figure 8. Uncertainty reduction in a JOYO MK-I SVR measurement (void pattern: [000]).
![Figure 8. Uncertainty reduction in a JOYO MK-I SVR measurement (void pattern: [000]).](/cms/asset/79319a00-ee53-4152-aea4-a79a210388cb/tnst_a_2244512_f0008_oc.jpg)
4.6. Discussion of data assimilation results
First, we analyzed which data would be advantageous for uncertainty reduction in the sodium void reactivity using ,
, and
in Equations (17) and (18). shows the evaluation results when the target was the JOYO MK-I SVR. The deviation of
from 1 is mainly due to the uncertainties for nuclides other than Na-23. The higher values in
were observed in the 6˝ BB measurement. In particular, the data with the 30˝-thick sodium shield were the highest. However, the value of
is too low to contribute to variance reduction. To obtain the benefit of variance reduction, data from deep penetration experiments with a relatively large
are required to increase the sensitivity to nuclear data. The maximum value of
in is
. Considering that
when all 25 experimental data in are used for cross-section adjustment, it is expected that even single data points will be sufficient in reducing the uncertainty.
Table 5. Evaluation results of the effectiveness of measurement data against JOYO MK-I SVR.
Although the reactivity contribution is divided into non-leakage (mostly positive reactivity) and leakage (negative reactivity) components in the SVR analysis, we next analyzed which components of the uncertainty can be reduced by the sodium shielding experimental data. We focused on the data from the experiments labeled ‘MZA‘ and ‘JOYO’ in . Information from these experiments is also provided in the International Handbook of Evaluated Reactor Physics Benchmark Experiments Project (IRPhEP) [Citation37]. The ‘MZA’ was a core used for the fast reactor critical assembly experiments in the Zebra Mozart program, which were conducted as mock-up experiments of the Japanese prototype fast reactor MONJU. In the JAEA database, experimental analyses of SVR were performed when the void region was changed stepwise (STEP A–E) in the core axial direction. In the measurement called STEP A, only the central core region was voided, and the void region gradually moved outward in STEPs B and C. In STEP D, the void region moves to the axial blanket region. Finally, in STEP E, all the void regions in STEPs A–D were voided. The breakdown of the SVR components into leakage and non-leakage components is presented in [Citation1]. The values in the table were evaluated using deterministic perturbation calculations. In STEPs A and B, the non-leakage component was larger than the leakage component. In contrast, the leakage component becomes larger in STEPs C and D. In addition to the MZA core, we present the breakdown of the SVR components of the JOYO core in . The JOYO is a fast Japanese experimental reactor. In the JOYO experiments, sodium in the core fuel region of the assembly was excluded. In . the three-digit number in the ‘Void pattern’ column represents the radial core position of the sodium-voided assembly. That is, ‘000’ means the sodium-voided assembly was located at the core center position. The JOYO core is smaller than the MONJU and MZA cores and uses MOX fuel with enriched uranium. Thus, the leakage component was dominant in the JOYO. Based on the results, we infer that the uncertainty reduction effect for the elastic scattering cross-section is related to the magnitude of the leakage components of the SVR. To visualize this inference, the relationship between the uncertainty reduction rate for Na-23 elastic scattering cross-section; the ratio of the leakage and non-leakage components of the SVR is shown in . As the value of the horizontal axis approaches 1, the value of the vertical axis increases sharply. Consequently, we demonstrated that the sodium shielding experimental data can reduce the uncertainty in evaluating the leakage component of the SVR.
Figure 9. Relationship between the uncertainty reduction rate for Na-23 elastic scattering cross-section and the ratio of SVR components.
Table 6. Breakdown of SVR components (MZA and JOYO MK-I cores) [1]
5. Conclusions
To clarify the effectiveness of shielding experiments in reducing the uncertainty of fast-reactor-core-design, a sensitivity analysis for sodium shielding experiments based on transport calculations with GPT was performed in this study. Using the sensitivity coefficients evaluated herein and those of the sodium void reactivity in the JAEA database, it was found that the sodium shielding experiment can contribute to a reduction in the uncertainty of the SVR. Based on the discussion in this study, the uncertainty reduction effect was expected to be significant, especially for the sodium void reactivity dominated by neutron-leakage phenomena, that is, the sodium shielding experimental data can be useful for reducing the uncertainty of the SVR for small SFRs and/or SFRs with an enhanced neutron-leakage mechanism in sodium void accidents. Consequently, shielding experimental data should be valuable as a common database for experimental data in reactor-physics. If we also aim to reduce the uncertainty in the non-leakage (positive reactivity) component, experiments to validate the inelastic scattering cross-section of Na-23 may be required.
In this study, the conventional cross-section adjustment method was adopted as the data assimilation technique based on the assumption that the first-order perturbation theory is valid. To confirm the validity of this assumption, further investigations using random sampling methods that do not rely on this assumption are necessary [Citation38–41]. Another research topic is the development of a continuous-energy MC-based GPT calculation for shielding analysis to investigate the implicit effects, which is neglected in this study. Regarding the issue related to the quality of the experimental data, although the analysis in this study was performed using the response functions given in the references, it is expected that the quality of the experimental analysis will be significantly improved if the analysis is performed on a model that represents the configuration of the BB as it is.
Supplemental Material
Download PDF (339.9 KB)Supplemental Material
Download PDF (209 KB)Disclosure statement
No potential conflict of interest was reported by the author(s).
Supplemental data
Supplemental data for this article can be accessed online at https://doi.org/10.1080/00223131.2023.2244512.
Correction Statement
This article was originally published with errors, which have now been corrected in the online version. Please see Correction (http://doi.org/10.1080/00223131.2024.2351855)
Additional information
Funding
References
- Yokoyama K, Sugino K, Ishikawa M, et al. Development of the unified cross-section set ADJ2017. JAEA-Research 2018-11. Tokai-mura (Japan):Japan Atomic Energy Agency; 2019. doi: 10.11484/jaea-research-2018-011
- Yokoyama K, Maruyama S, Taninaka H, et al. Development of the unified cross-section set ADJ2017R. JAEA-Data/Code 2021-019. Tokai-mura (Japan): Japan Atomic Energy Agency; 2022. doi: 10.11484/jaea-data-code-2021-019
- Yokoyama K. Development of adjusted nuclear data library for fast reactor application. EPJ Web Conference. 2023;281:00004. doi: 10.1051/epjconf/202328100004
- Maerker RE, Muckenthaler FJ, Childs RL, et al. Final report on a benchmark experiment for neutron transport in thick sodium. ORNL-4880. Oak Ridge (Tennessee): Oak Ridge National Laboratory; 1974. doi: 10.2172/4333466
- Maerker RE, Muckenthaler FJ, Childs RL, et al. The ORNL benchmark experiment for neutron transport in thick sodium. Nucl Technol. 1973;22(2):275–297. doi: 10.13182/NT74-A31409
- Kodeli I. Multidimensional deterministic nuclear data sensitivity and uncertainty code system: Method and application. Nucl Sci Eng. 2001;138:45–66. doi: 10.13182/NSE00-43
- Kodeli IA, Enrico S. SINBAD – radiation shielding benchmark experiments. Ann Nuc Energy. 2021;159:108254. doi: 10.1016/j.anucene.2021.108254
- Hara A, Takeda T, Kikuchi Y. SAGEP: two-dimensional sensitivity analysis code based on generalized perturbation theory. JAERI-M 84-027. Tokai-mura (Japan): Japan Atomic Energy Research Institute; 1984. doi: 10.11484/jaeri-m-84-027
- Bell GI, Glasstone S. Nuclear reactor theory. MALABAR (FL): ROBERT E. KRIEGER PUBLISHING CO., INC; 1970. pp. 237–242.
- Lathrop KD. Ray effects in discrete ordinates equations. Nucl Sci Eng. 1968;32(3):357–369. doi: 10.13182/NSE68-4
- Masukawa F, Kadotani H, Hoshiai H, et al. GRTUNCL-3D: an extension of the GRTUNCL code to compute R-θ-Z first collision source moments. J Nucl Sci Technol. 2000;37(1):471–474. doi: 10.1080/00223131.2000.10874930
- Kosako K, Konno C. FNSUNCL3: first collision source code for TORT. J Nucl Sci Technol. 2000;37(1):475–478. doi: 10.1080/00223131.2000.10874931
- Alcouffe RE, O’Dell RD, Brinkley Jr FW. A first-collision source method that satisfies discrete sn transport balance. Nucl Sci Eng. 1990;105(2):198–203. doi: 10.13182/NSE90-A23749
- Takeda T, Yoshimura A, Kamei T. Prediction uncertainty evaluation methods of core performance parameters in large liquid-metal fast breeder reactors. Nucl Sci Eng. 1989;103(2):157–165. doi: 10.13182/NSE89-1
- Palmiotti G, Salvatores M. Use of integral experiments in the assessment of large liquid-metal fast breeder reactor basic design parameters. Nucl Sci Eng. 1984;87(3):333–348. doi: 10.13182/NSE87-333
- JoanouGD, Dudek JS. GAM-II: a B3 code for the calculation of fast neutron spectra and associated multigroup constants. GA-4265. San Diego (California): General Dynamics Corporation; 1963.
- SINBAD. Shielding integral benchmark archive and database, version December 2013 [CD-ROM]. Issy-les-Moulineaux (France): OECD Nuclear Energy Agency Data Bank; Oak Ridge (Tennessee): Oak Ridge National Laboratory; 2013.
- JASPER Sub-Working Group and Reactor Technology Group. JASPER experimental data book (I) –radial shield attenuation experiment–. PNC TN2410 88-005. Tokai-mura (Japan): Japan Nuclear Cycle Development Institute; 1988.
- Muckenthaler FJ, Rooney BD, Drischler JD. Measurements for the JASPER program radial shield attenuation experiment. ORNL/TM-10371. Oak Ridge (Tennessee): Oak Ridge National Laboratory; 1987.
- X-5 monte carlo team. MCNP – a general Monte Carlo n-particle transport code, version 5 – vol. I: overview and theory. LA-UR-03-1987. Los Alamos (New Mexico): Los Alamos National Laboratory; 2008.
- Okumura K. Nuclear data for prediction of isotope generation and depletion. Harada H, Yokoyama K, Iwamoto N, et al. Proceedings of the 2011 Symposium on Nuclear Data. JAEA-Conf. 2012-001:pp. 39–44. Tokai-mura (Japan): Japan Atomic Energy Agency; 2012. doi:10.11484/jaea-conf-2012-001
- Shibata K, Iwamoto O, Nakagawa T, et al. JENDL-4.0: A new library for nuclear science and engineering. J Nucl Sci Technol. 2011;48(1):1–30. doi: 10.1080/18811248.2011.9711675
- Wagner JC, Haghighat A. Automated variance reduction of Monte Carlo shielding calculations using the discrete ordinates adjoint function. Nucl Sci Eng. 1998;128(2):186–208. doi: 10.13182/NSE98-2
- Mosher SW, Johnson SR, Bevill AM. ADVANTG– an automated variance reduction parameter generator. ORNL/TM-2013/416 (Rev.1). Oak Ridge (Tennessee): Oak Ridge National Laboratory;2015.
- Sugino K, Jin T, Hazama T, et al. Preparation of fast reactor group constant sets UFLIB.J40 and JFS-3-J4.0 based on the JENDL-4.0 data. JAEA-Data/Code 2011-017. Tokai-mura (Japan): Japan Atomic Energy Agency; 2012. doi: 10.11484/jaea-data-code-2011-017
- Ingersoll DT, White JE, Wright RQ, et al. Production and testing of the VITAMIN-B6 fine group and the BUGLE-93 broad-group neutron/photon cross-section libraries derived from ENDF/B-VI nuclear data. ORNL-6795. Oak Ridge (Tennessee): Oak Ridge National Laboratory;1995.
- Rearden BT, Jessee MA, editor.SCALE code system. ORNL/TM-2005/39 Version 6.2.3. Oak Ridge (Tennessee): Oak Ridge National Laboratory; 2018.
- MacFarlane RE, Muir DW, Boicourt RM, et al. The NJOY nuclear processing system, version 2016. LA-UR-17-20093. Los Alamos (New Mexico): Los Alamos National Laboratory;2019.
- Hazama T, Chiba G, Sato W, et al. SLAROM-UF: ultra fine group cell calculation code for fast reactor -version 20090113- (translated document). JAEA-Review 2009-003. Tokai-mura (Japan): Japan Atomic Energy Agency; 2009. doi: 10.11484/jaea-review-2009-003
- Alcouffe RE, Baker RS, Dahl JA, et al. PARTISN: time-dependent, parallel neutral particle transport code system. LA-UR-08-07258. Los Alamos (New Mexico): Los Alamos National Laboratory;2008.
- Williams ML, Broadhead BL, Parks CV. Eigenvalue sensitivity theory for resonance-shielded cross sections. Nucl Sci Eng. 2001;138(2):177–191. doi: 10.13182/NSE00-56
- Chiba G, Tsuji M, Narabayashi T. Resonance self-shielding effect in uncertainty quantification of fission reactor neutronics parameters. Nucl Eng Technol. 2014;46(3):281–290. doi: 10.5516/NET.01.2014.707
- Yokoyama K, Jin T, Hirai Y, et al. Development of the versatile reactor analysis code system, MARBLE2. JAEA-Data/Code 2015-009. Tokai-mura (Japan): Japan Atomic Energy Agency;2015. doi: 10.11484/jaea-data-code-2015-009
- Maruyama S, Endo T, Yamamoto A. An estimation method for an unknown covariance in cross-section adjustment based on unbiased and consistent estimator. J Nucl Sci Technol. 2023;[cited 2023 June 12]. doi: 10.1080/00223131.2023.2203707
- Siefman D, Hursin M, Schnabel G, et al. Development and application of marginal likelihood optimization for integral parameter adjustment. Ann Nuc Energy. 2021;159:108255. doi: 10.1016/j.anucene.2021.108255
- Maruyama S, Endo T, Yamamoto A. Applicability evaluation of Akaike’s Bayesian information criterion to covariance modeling in the cross-section adjustment method. EPJ Web Conference. 2023;281:00008. doi:10.1051/epjconf/202328100008
- OECD Nuclear Energy Agency. International handbook of evaluated reactor physics benchmark experiments. NEA/NSC/DOC(2006)1. Paris (France): OECD Nuclear Energy Agency; 2019.
- Watanabe T, Endo T, Yamamoto A, et al. Cross section adjustment method based on random sampling technique. J Nucl Sci Technol. 2014;51(5):590–599. doi: 10.1080/00223131.2014.882801
- Hoefer A, Buss O, Hennebach M, et al. MOCABA: A general Monte Carlo–Bayes procedure for improved predictions of integral functions of nuclear data. Ann Nucl Energy. 2015;77:514–521. doi: 10.1016/j.anucene.2014.11.038
- Endo T, Yamamoto A, Watanabe T. Bias factor method using random sampling technique. J Nucl Sci Technol. 2016;53(10):1494–1501. doi: 10.1080/00223131.2015.1126541
- Koning AJ. Bayesian monte carlo method for nuclear data evaluation. Eur Phys J A. 2015;51(12):184. doi: 10.1140/epja/i2015-15184-x