
ABSTRACT
High-energy beta-ray sources generate bremsstrahlung photons in the building materials, generated by the radioactive nuclides inside the nuclear reactor buildings emitted by the Fukushima Daiichi nuclear reactor accident. Therefore, evaluating the bremsstrahlung dose subjected to the workers in the building is crucial for radiation protection. The precision for assessing the bremsstrahlung dose was investigated by comparing the Particle and Heavy Ion Transport code System (PHITS) and the GEometry ANd Tracking (GEANT4) simulation code results. Behind various shielding plates (lead, copper, aluminum, glass, and polyethylene with multiple thicknesses), the water cylinder was set to obtain the absorbed dose and the deposited energy spectrum by the bremsstrahlung photons. In comparing the deposited energy spectrum, the spectral shapes have consistent trends. Below several tens of keV, a peak is observed in the PHITS spectrum for lead. While comparing the absorbed dose, most of the results from both codes correlate within an ~10% difference for 2.280 MeV beta-ray sources and an ~20% difference for 0.5459 MeV beta-ray sources, except for ~30% for 20 mm thick lead. Although some differences occurred, the evaluation results of both codes correlated well with the above precision.
1. Introduction
The Fukushima Daiichi Nuclear Power Plant (FDNPP) accident of the Tokyo Electric Power Company Holdings, Incorporated (TEPCO) emitted various radioactive nuclides. In the area outside the FDNPP, ambient dose equivalent rates due to the gamma rays from radioactive cesium widely spread and deposited in the environment [Citation1–4], and its deposition amounts [Citation5,Citation6] were measured. In addition, various measurements and developments for radionuclides have recently been reported [Citation7–10]. However, within the nuclear reactor building, in addition to the gamma rays from radioactive nuclides, such as 137Cs, the bremsstrahlung photons generated by high-energy beta rays from radioactive nuclides might contribute to exposure doses that are negligible in the outside field. Decommissioning work is progressing in Fukushima. Bremsstrahlung photon doses might not be negligible in decommissioning work, and their influence should be considered. Among the expanded and deposited radioactive nuclides on the material surfaces in the nuclear reactor building, high-energy beta rays from 137Cs as the primary source, 90Sr, and 90Y can indirectly generate bremsstrahlung photons in the wall, floor, and structural material in the room of the nuclear reactor building, resulting in a huge indirect contribution of bremsstrahlung. Bremsstrahlung behaves differently from beta rays and can penetrate the materials in which it is generated and the structures between the sources and workers, reaching the workers in the room.
In nuclear reactor building environments, where radioactive nuclides with different types and densities from the outside environment of the off-site were presumed, the bremsstrahlung contribution to the total dose could be crucial. An enormous proportion of the absorbed dose exists due to bremsstrahlung to the total absorbed dose caused by high-energy beta-ray sources; bremsstrahlung dose contributes 84.9%–98.4% of the total absorbed dose caused by high-energy beta-ray sources under the conditions calculated in this study using the Particle and Heavy Ion Transport code System (PHITS) [Citation11–13] (). shows the absorbed dose fraction caused by bremsstrahlung to those caused by high-energy beta-ray sources (including the bremsstrahlung contribution) for various shielding plate conditions for generating bremsstrahlung.
Figure 1. The fraction of absorbed doses caused by bremsstrahlung to those caused by high-energy beta-ray sources (including the bremsstrahlung contribution) for various shielding plate conditions for generating bremsstrahlung in this calculation.
The TEPCO accident analysis review committee reported various measurements in the reactor building [Citation14–16], such as the integrated dose and dose rate using an electronic personal dosimeter, ionization chamber, Geiger–Müller (GM) counter tube, and ionization chamber-type survey meter. A gamma camera measured the radiation intensity distribution from the count rate, and a CdZnTe semiconductor detector with a lead collimator measured the pulse height. However, the bremsstrahlung contribution due to the high-energy beta-ray source is indistinguishable in these measurements because the values are measured with the gamma-ray source contribution. Therefore, despite the difficulty of directly assessing the bremsstrahlung contribution, its evaluation is necessary. A simulation calculation method effectively evaluating the bremsstrahlung contribution to the exposure dose is needed for radiation control of workers performing decommissioning work in nuclear power plant buildings.
The behavior and influence of nuclear radiation can be calculated and evaluated for various conditions in the simulations using Monte Carlo simulation codes, such as the PHITS and GEometry ANd Tracking (GEANT4) [Citation17–19]. The total absorbed dose evaluation is widely performed based on the deposited energy spectrum of the materials and the human body. The conversion coefficient [Citation20] is used to obtain the dose value from the spectrum. However, calculating the bremsstrahlung influence has not been well evaluated. To properly evaluate the bremsstrahlung influence, the precision of the simulation code should be considered for bremsstrahlung using the intercomparison method of various simulation codes. For example, although it compares the sum of beta rays and bremsstrahlung photons, the GEANT4 simulated values correlated within 5% of the measured values by comparing measurements and calculations on the distance dependence of the relative dose equivalent to an ionization chamber survey meter after passing through a shielding material from 89Sr and 90Y sources [Citation21]. Thus, some radiation dose values have been evaluated with some degree of accuracy, contributing to the effectiveness of the intercomparison method between different simulation codes.
Comparing the calculated and measured values of GEANT4 is one example of comparing the sum of beta rays and bremsstrahlung photons. Considering only bremsstrahlung accuracy, if no experimental values exist to compare, one possible method is to use reliable and proven calculation codes to calculate and compare various simple examples. For example, by comparing the calculation results, if the results are the same, the accuracy is assumed to be the same, and if the results differ, there are points to be careful about; thus, the characteristics of both calculation codes can be grasped. Mutual evaluation of different calculation codes also helps in better understanding of the characteristics of both codes. If there is a case where the results of two calculation codes agree within some small level under some conditions, the reliability and accuracy of the calculation system can be evaluated in similar cases. Herein, the absorbed dose and the deposited energy spectrum of the bremsstrahlung were compared using the PHITS and GEANT4 codes under various conditions.
2. Methods
2.1. Calculation code
PHITS version 3.29 and GEANT4 version 10.7.1 were used as the calculation codes. PHITS uses the Enhanced Geothermal System 5 (EGS5) code [Citation22], and GEANT4 uses the GEANT4 electromagnetic package, for electron and photon calculations.
2.2. Calculation system
shows the calculation system, where a rectangular parallelepiped with a volume of 20 cm × 20 cm × 30 cm filled with air is set. Parallel beam from the square plane, the shielding plate at the center, and the water cylinder as evaluated volume are set in the air volume. The system is configured based on the calculations for cylindrical detectors, as shown in other papers [Citation21,Citation23]. However, the diameter of the water cylinder was enlarged to increase the cross-section area for increasing statistics.
Figure 2. The calculation system comprising a shielding plate and water cylinder in a rectangular parallelepiped air volume.
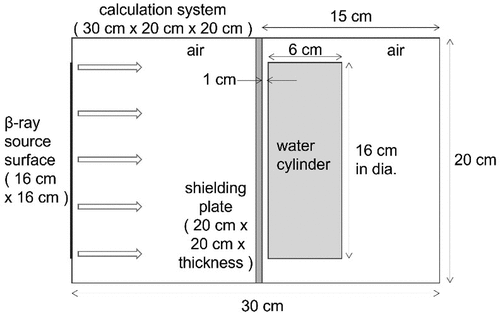
In the 20 cm × 20 cm plane on the left side of the rectangular parallelepiped, the parallel beam was emitted randomly within the plane’s central square area (16 cm × 16 cm). Beta rays of 2.280 MeV, the highest energy of beta rays emitted from 90Y, and 0.5459 MeV, the highest energy of beta rays emitted from 90Sr, were headed toward the opposite plane (20 cm × 20 cm) of the rectangular parallelepiped. Although high-energy beta rays of 137Cs (maximum energy 1.174 MeV) are the primary sources in the reactor, calculations were performed at the above two energy points, considering the width of the energy range. A shielding plate (20 cm × 20 cm × t cm; t is the thickness) was set 15 cm from the source surface of the system (30 cm long), and the upstream side surface of a water cylinder (16 cm in dia. × 6 cm) was set 1 cm downstream from the shielding plate. Referring to the paper [Citation23], where the thickness of the shielding plate was referred, the thickness of the water cylinder was set based on the detector length. Beta rays entering the shielding plate can generate bremsstrahlung radiation through interactions with the shielding plate materials. Shielding plates comprising five materials (lead, copper, aluminum, glass, and polyethylene), with three to five thicknesses each, were simulated (). Referring to another study on the bremsstrahlung calculation using GEANT4, where the lead thickness was set based on the range of high-energy beta rays, the thickness used, plus thicker values and similar materials, were selected for this study’s calculations. The calculations were performed for each condition of the shielding plate, as in the following section.
Table 1. Summary of materials and thicknesses of the shielding plate.
2.3. Acquired data
The absorbed dose and deposited energy spectrum in the water cylinder by bremsstrahlung generated in the shielding plate irradiated with beta rays were calculated. The absorbed dose was obtained as the total deposited energy in the water cylinder per weight, and the deposited energy spectrum was obtained as the intensity for each 5 keV width. The following methods were performed for each calculation code to discriminate the bremsstrahlung contribution from others.
The counter function of PHITS, capable of selecting event types such as radiation and interaction, was used to distinguish bremsstrahlung from other events, such as beta rays. Here, the bremsstrahlung-generating events in the shielding plate by a high-energy incident beta ray which then entered the water cylinder as a photon were selected.
In the GEANT4 calculation, only the bremsstrahlung contribution was extracted from the difference between all events, including bremsstrahlung caused by beta rays and those without bremsstrahlung, using the inactive function of GEANT4.
3. Results
3.1. Absorbed dose and ratio
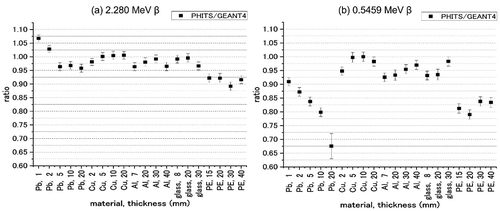
(a) and (b) show the absorbed dose in the water cylinder per one million source events obtained using PHITS and GEANT4 for the 2.280 and 0.5459 MeV beta rays for various materials and thicknesses of the shielding plate, respectively. (a) and (b) illustrate the absorbed dose ratios in the water cylinder (ratio of PHITS to GEANT4; PHITS/GEANT4) for the 2.280 and 0.5459 MeV beta rays, respectively. These graphs group the results for various thicknesses for each material on the horizontal axis. For the 2.280 MeV beta-ray source, despite the increase in material thickness, the difference in the results of both simulation codes did not increase, and most differences correlated within 10%. For the 0.5459 MeV beta-ray source, most PHITS results are 10%–20% and approximately 20% lower than the GEANT4 results for lead and polyethylene, respectively, except for approximately 30% lower for the 20 mm thick lead.
Figure 3. Absorbed dose in the water cylinder by bremsstrahlung from various shielding plates generated via beta rays at (a) 2.280 and (b) 0.5459 MeV using the PHITS and GEANT4 calculation codes.
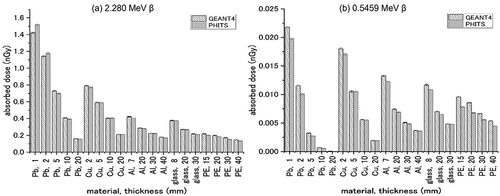
Figure 4. The ratio of the absorbed dose in the water cylinder (ratio of PHITS to GEANT4) by bremsstrahlung from various shielding plates generated by beta rays of (a) 2.280 and (b) 0.5459 MeV.
3.2. Energy spectrum and ratio
For the deposited energy spectra in the water cylinder by bremsstrahlung, the PHITS (gray spectra with gray open triangles) and GEANT4 (black spectra with black filled circles) results are displayed for the lead-, copper-, aluminum-, glass-, and polyethylene-shielding materials in the top lines of , , , , and , respectively, for the 2.280 MeV beta-ray source, and in the top lines of , , , , and , respectively, for the 0.5459 MeV beta-ray source. In these graphs, the energy is drawn on the horizontal axes and the radiation intensity per one million source events on the logarithmic scale on the vertical axes. For GEANT4, the energy bin width was changed from 5 keV to 40 keV for counts over 400 keV because the statistics were small. The counts were then normalized and displayed according to the 5 keV bin width. The same deposited energy spectra expanded in the low-energy range are displayed in the middle lines of , which correlated overall. For 0.5459 MeV, PHITS appears slightly low overall. A characteristic peak appears in PHITS in the low-energy region below several tens of keV for lead.
Figure 5. The calculation results of the bremsstrahlung spectra in the water cylinder using PHITS and GEANT4 for the 2.280 MeV beta-ray source and lead shielding material. Top: deposited energy spectra for lead thicknesses of (a) 1.0, (b) 2.0, (c) 5.0, (d) 10, and (e) 20 mm. Middle: deposited energy spectra in the low-energy region for the same thicknesses. Bottom: the PHITS/GEANT4 ratio of spectrum intensity in the low-energy region.
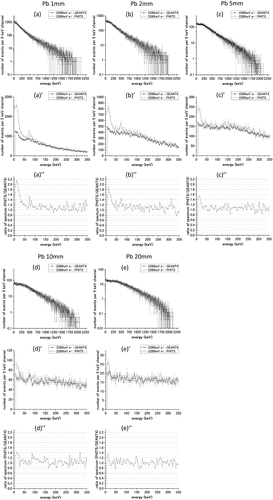
Figure 6. The calculation results of the bremsstrahlung spectra in the water cylinder using PHITS and GEANT4 for the 2.280 MeV beta-ray source and copper shielding material. Top: deposited energy spectra for copper thicknesses of (a) 2.0, (b) 5.0, (c) 10, and (d) 20 mm. Middle: deposited energy spectra in the low-energy region for the same thicknesses. Bottom: the PHITS/GEANT4 ratio of spectrum intensity in the low-energy region.
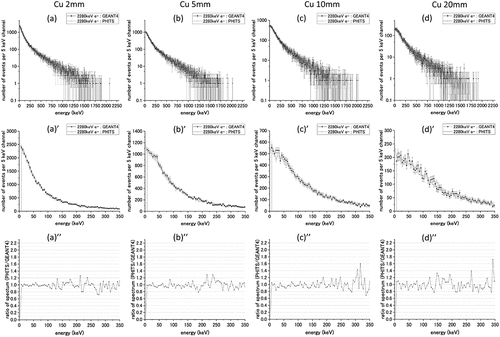
Figure 7. The calculation results of the bremsstrahlung spectra in the water cylinder using PHITS and GEANT4 for the 2.280 MeV beta-ray source and aluminum shielding material. Top: deposited energy spectra for aluminum thicknesses of (a) 7.0, (b) 20, (c) 30, and (d) 40 mm. Middle: deposited energy spectra in the low-energy region for the same thicknesses. Bottom: the PHITS/GEANT4 ratio of spectrum intensity in the low-energy region.
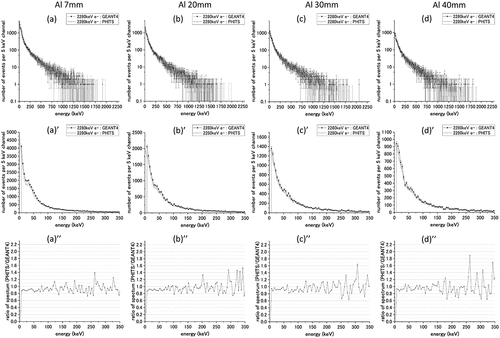
Figure 8. The calculation results of the bremsstrahlung spectra in the water cylinder using PHITS and GEANT4 for the 2.280 MeV beta-ray source and glass shielding material. Top: deposited energy spectra for glass thicknesses of (a) 8.0, (b) 20, and (c) 30 mm. Middle: deposited energy spectra in the low-energy region for the same thicknesses. Bottom: the PHITS/GEANT4 ratio of spectrum intensity in the low-energy region.
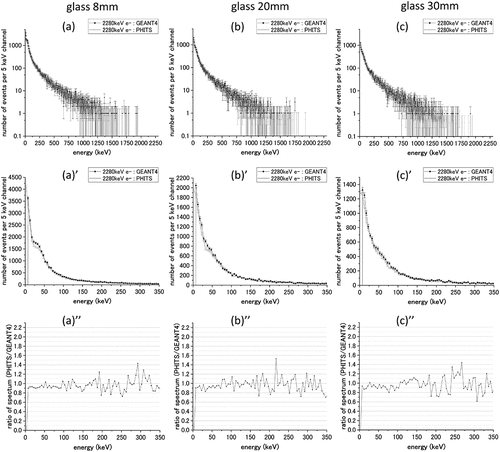
Figure 9. The calculation results of the bremsstrahlung spectra in the water cylinder using PHITS and GEANT4 for the 2.280 MeV beta-ray source and polyethylene shielding material. Top: deposited energy spectra for polyethylene thicknesses of (a) 15, (b) 20, (c) 30, and (d) 40 mm. Middle: deposited energy spectra in the low-energy region for the same thicknesses. Bottom: the PHITS/GEANT4 ratio of spectrum intensity in the low-energy region.
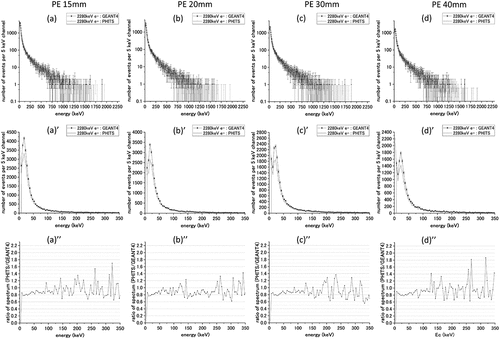
Figure 10. The calculation results of the bremsstrahlung spectra in the water cylinder using PHITS and GEANT4 for the 0.5459 MeV beta-ray source and lead shielding material. Top: deposited energy spectra for lead thicknesses of (a) 1.0, (b) 2.0, (c) 5.0, (d) 10, and (e) 20 mm. Middle: deposited energy spectra in the low-energy region for the same thicknesses. Bottom: the PHITS/GEANT4 ratio of spectrum intensity in the low-energy region.
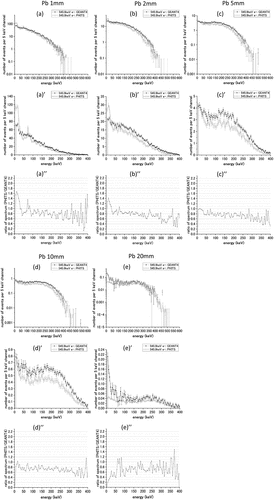
Figure 11. The calculation results of the bremsstrahlung spectra in the water cylinder using PHITS and GEANT4 for the 0.5459 MeV beta-ray source and copper shielding material. Top: deposited energy spectra for copper thicknesses of (a) 2.0, (b) 5.0, (c) 10, and (d) 20 mm. Middle: deposited energy spectra in the low-energy region for the same thicknesses. Bottom: the PHITS/GEANT4 ratio of spectrum intensity in the low-energy region.
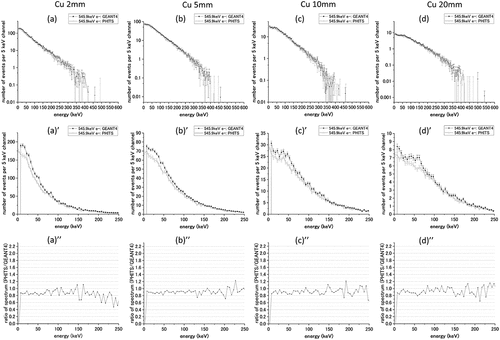
Figure 12. The calculation results of the bremsstrahlung spectra in the water cylinder using PHITS and GEANT4 for the 0.5459 MeV beta-ray source and aluminum shielding material. Top: deposited energy spectra for aluminum thicknesses of (a) 7.0, (b) 20, (c) 30, and (d) 40 mm. Middle: deposited energy spectra in the low-energy region for the same thicknesses. Bottom: the PHITS/GEANT4 ratio of spectrum intensity in the low-energy region.
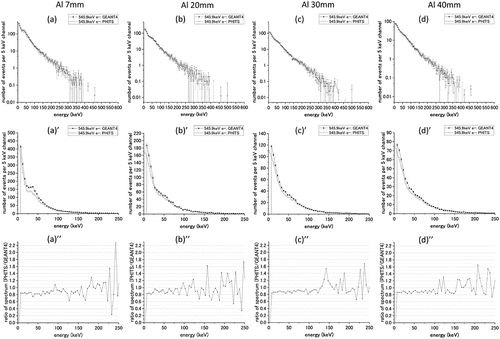
Figure 13. The calculation results of the bremsstrahlung spectra in the water cylinder using PHITS and GEANT4 for the 0.5459 MeV beta-ray source and glass shielding material. Top: deposited energy spectra for glass thicknesses of (a) 8.0, (b) 20, and (c) 30 mm. Middle: deposited energy spectra in the low-energy region for the same thicknesses. Bottom: the PHITS/GEANT4 ratio of spectrum intensity in the low-energy region.
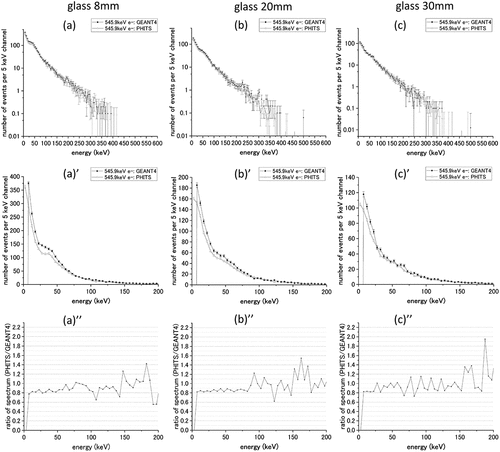
Figure 14. The calculation results of the bremsstrahlung spectra in the water cylinder using PHITS and GEANT4 for the 0.5459 MeV beta-ray source and polyethylene shielding material. Top: deposited energy spectra for polyethylene thicknesses of (a) 15, (b) 20, (c) 30, and (d) 40 mm. Middle: deposited energy spectra in the low-energy region for the same thicknesses. Bottom: the PHITS/GEANT4 ratio of spectrum intensity in the low-energy region.
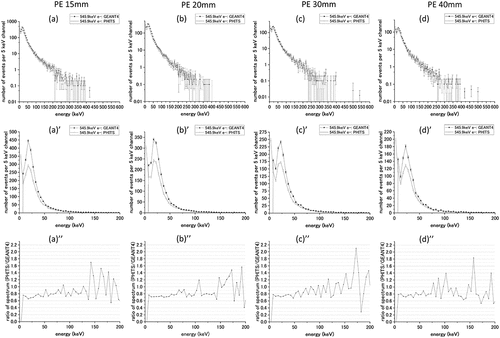
To show the difference clearly without changing the energy range on the horizontal axis, the spectrum intensity ratios for PHITS and GEANT4 taken as the vertical axis values are displayed in the bottom lines of . For lead in the energy range below several tens of keV, the ratio of PHITS/GEANT4 becomes greater than 1 and, in some cases, reaches nearly 2. The PHITS results for polyethylene are smaller than that for GEANT4, causing differences in the absorbed dose. In other results, the ratios for each energy show varied deviations from 1. Statistical fluctuations cause the variation in the ratio at moderately high energies.
4. Discussion
The EGS5 code is incorporated into PHITS to simulate the transport of beta and gamma rays. However, the GEANT4 electromagnetic package is used in the GEANT4 code. In the absorbed dose ratio, large differences in the two codes were observed for the 0.5459 MeV beta-ray source and lead shielding materials. For the several tens of keV regions, where differences in the deposited energy spectrum by bremsstrahlung were seen, a spectral peak in the low-energy region of PHITS was higher than GEANT4 for lead for the 2.280 MeV and 0.5458 MeV cases with thin thicknesses. I investigated the data used for both calculation codes, such as cross section, energy loss, and angular distribution.
4.1. Cross section data of bremsstrahlung radiation
4.1.1. PHITS
First, EGS5 incorporated in PHITS uses the cross section based on the differential cross section data of the 3CS-like formula of Koch and Motz et al. [Citation24] (considering Coulomb and screening corrections). The EGS5 uses the normalized cross section multiplied by an empirical correction factor A’(Z, E0) [Citation25]. The factor is derived from the APRIM function in Preprocessor for EGS (PEGS) and evaluated to align the total stopping power (the integral of the stopping power) with the values in the International Commission on Radiation Units (ICRU) Report 37 [Citation26]. In the literature [Citation25], the comparison correlation between the radiation stopping powers of PEGS4 and ICRU-37 is within 1% for most elements and 2% for all elements except hydrogen. This description indicates that it is larger than 2% for hydrogen, but no specific description of the degree of discrepancy exists.
In the EGS5 used in PHITS, the Elwert factor correction is ignored as a neglected correction concerning the low-energy region. Koch and Motz et al. [Citation24] recommends this correction below approximately 1 MeV. This correction factor is necessary for bremsstrahlung from low-energy electrons. Without this correction, the differential cross section value will be considerably smaller than the experimental value and look very different.
4.1.2. GEANT4
GEANT4 uses the cross section data of the Evaluated Electron Data Library (EEDL) database using Perkins et al. [Citation27] based on the data calculated by Seltzer and Berger et al. [Citation28,Citation29]. The accuracy of the original GEANT4 data (Seltzer and Berger table) in reproducing experimental values and theory is less than 10% for less than 50 MeV.
Also, the accuracy of the differential cross section dσ/dk of Seltzer and Berger [Citation29] based on the results of Pratt et al. [Citation30] is approximately 10% for less than 2 MeV and 5%–10% for 2–50 MeV. The uncertainty of the EEDL bremsstrahlung cross section from Perkins et al. [Citation27] is 5%–10% for 1 keV–2 MeV and less than 10% for 2–50 MeV based on the interpolation of Perkins et al. [Citation27] and the evaluation of Seltzer and Berger et al [Citation28,Citation29].
4.2. Energy loss of bremsstrahlung radiation
The energy loss accuracy is 8%–10% for less than 1 MeV and 5%–6% for 1 MeV or more in GEANT4. When addressing the energy decrease in the simulation calculation, the error in the amount of bremsstrahlung might increase if the energy loss accuracy is bad. The amount of bremsstrahlung increases sharply on the lower energy side. As mentioned in 4.5.1 on the energy loss data comparison, the energy loss of PHITS and GEANT4 are similar; therefore, the accuracy is similar.
4.3. Angular distribution
4.3.1. GEANT4
GEANT4 selects and implements one of three classes:
① G4ModifiedTsai obtains the angular distribution from a simplified formula based on the Tsai cross section data [Citation31].
② G4Generator2BS uses only the angular part of the 2BS formula of the double differential cross section of Koch and Motz’s bremsstrahlung [Citation24].
③ G4Generator2BN uses the 2BN formula for the double differential cross section of Koch and Motz’s bremsstrahlung [Citation24].
A significant difference occurs in the most probable emission angle between the Tsai/2BS and 2BN generators below 100 keV. However, the 2BN generator correlates well with the Kissel data [Citation32] from Tseng’s work [Citation33] and should be used from 1 to 100 keV. This study used the G4ModifiedTsai angular distribution as the default setting, and the difference from other angular distributions could affect the calculation results, especially below 100 keV.
4.3.2. PHITS
PHITS uses only the angle distribution part of Koch and Motz’s 2CS formula [Citation24] for angle sampling, the default for EGS5 in PHITS.
4.4. Cutoff
Implementing a suitable cutoff height saves computation time when detailed physical behavior below the cutoff is not required to control the rapid rise in the computational load due to the rapid increase in the bremsstrahlung on the low-energy side. A continuous energy-loss assumption is applied at energies below the cutoff, stopping the event.
4.4.1. GEANT4
In GEANT4, the tracking cut is the same regardless of the material, and energy cuts can be set as other cuts. The default value of the range cut is 1.0 mm. The following adjustments were made. The range cutoff was gradually lowered from 1 mm, and the appropriate value was finally set at 0.01 mm to reduce the calculation time and fluctuations in the results that differed due to the large cutoff value. In GEANT4, it is possible to set an energy cutoff, but the more naturally designed concept is to use a range cutoff rather than energy cutoff, so a range cutoff was set.
4.4.2. PHITS
PHITS’s lowest cutoff energy was 1 keV for electrons, positrons, and photons. However, the lower energy limit of reliable transport simulations for photons (or bremsstrahlung) in EGS is several tens of keV for the following reasons. The applicable energy range of electrons and positrons is from 1 keV for low-Z materials and several tens of keV for high-Z materials to thousands of GeV [Citation34]. The photon applicable energy range is from 1 keV to thousands of GeV. Since bremsstrahlung is a process where the interactions between electrons/positrons and substances generate photons and the bremsstrahlung generates secondary electrons/positrons, the photons and electrons/positrons are interrelated. Since reliability is low at 1 keV or less (photons) and below several tens of keV (electrons/positrons), outside the applicable range, it is reasonable for PHITS to produce less reliable deposited energy spectra below several tens of keV. A difference occurs between PHITS and GEANT4 in the deposited energy spectrum below several tens of keV for high-Z lead. The lower limit applied to substances with high Z in PHITS mentioned above might cause a difference in the results of the two calculation codes.
4.5. Comparison of atomic data
The original atomic data used in each calculation code (bremsstrahlung cross section and energy loss) was compared as follows.
4.5.1. Energy loss
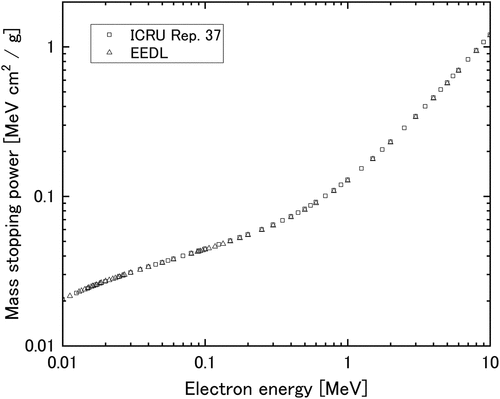
When comparing the mass stopping power for bremsstrahlung as a function of incident electron energy, PHITS (normalized to match the total radiative stopping power of the ICRU Report 37 [Citation26] based on the differential cross section of the 3CS equation of Koch and Motz et al. [Citation24]) and GEANT4 (EEDL) are similar, as shown in comparing both data as an example of lead.
Figure 15. The mass stopping power for bremsstrahlung as a function of incident electron energy for PHITS (ICRU Report 37) and GEANT4 (EEDL) as an example of lead.
4.5.2. Differential and total cross sections
The differential cross sections (the differential for the energy of bremsstrahlung photons) of PHITS (from the BREMDZ function in PEGS; Appendix C of [Citation22]) and GEANT4 (from Seltzer and Berger et al. [Citation29]) are normalized to compare the distribution shape (differential cross section versus photon energy) for each incident electron energy. Then, the total cross sections of PHITS (from the BREMRZ function in PEGS; Appendix C of [Citation22]) and GEANT4 (from Perkins et al. [Citation27] as the original EEDL) were normalized to compare the distribution shape (the total cross section versus the incident electron energy). For comparison, the differential cross section regarding the photon energy (k) multiplied by the generated photon energy (k) was integrated over the generated photon energy range. The integrated values were plotted on the vertical axis as a function of the incident electron energy on the horizontal axis () for (a) 12C, (b) 13Al, (c) 26Cu, and (d) 82Pb. Similarly, the total cross sections were plotted in for the same four materials as a function of the incident electron energy on the horizontal axis. In both cases, the PEGS values were normalized and plotted based on both values at 2 MeV. Both comparison results correlate below a few MeV of our interest in this study; however, some differences occur at 100 keV or less but are insignificant.
Figure 16. The integrated values of the differential cross section for the photon energy (k) multiplied by the generated photon energy (k) versus the incident electron energy for four materials obtained from PHITS (PEGS [BREMDZ]) and GEANT4 (Seltzer and Berger et al. (1986)). The k in the vertical axis title is the generated photon energy: (a) 12C, (b) 13Al, (c) 26Cu, and (d) 82Pb.
![Figure 16. The integrated values of the differential cross section for the photon energy (k) multiplied by the generated photon energy (k) versus the incident electron energy for four materials obtained from PHITS (PEGS [BREMDZ]) and GEANT4 (Seltzer and Berger et al. (1986)). The k in the vertical axis title is the generated photon energy: (a) 12C, (b) 13Al, (c) 26Cu, and (d) 82Pb.](/cms/asset/7ec15a6b-7335-458d-849e-2aefe782b95b/tnst_a_2285934_f0016_b.gif)
Figure 17. The total cross section versus the incident electron energy for four materials obtained from PHITS (PEGS [BREMRZ]) and GEANT4 (EEDL [Perkins et al. (1991)]): (a) 12C, (b) 13Al, (c) 26Cu, and (d) 82Pb.
![Figure 17. The total cross section versus the incident electron energy for four materials obtained from PHITS (PEGS [BREMRZ]) and GEANT4 (EEDL [Perkins et al. (1991)]): (a) 12C, (b) 13Al, (c) 26Cu, and (d) 82Pb.](/cms/asset/9a22cbfc-40a9-4eeb-8287-f2c063ab023a/tnst_a_2285934_f0017_b.gif)
4.6. Ratio of absorbed dose to intermedium energy points
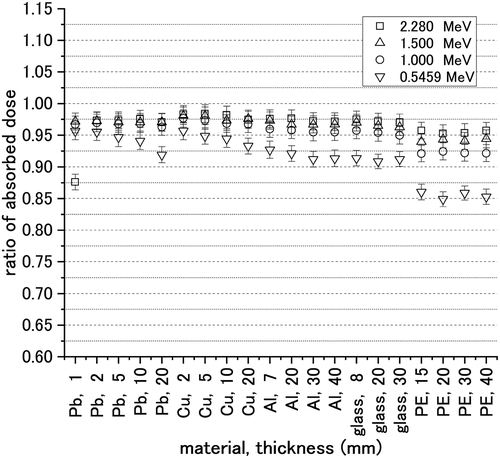
Using 1.5 and 1.0 MeV beta-ray sources as intermedium energy points, the absorbed dose in the water cylinder was calculated using PHITS and GEANT4. (a), (b), and (c) plot the ratios of both simulation results (PHITS/GEANT4) for 1.5 MeV, 1.0 MeV, and all four energies of beta-ray sources, respectively. (a) and (b) show that the lead and polyethylene ratios for 1.5 and 1.0 MeV decrease gradually from 2.280 to 0.5459 MeV.
Figure 18. The ratio of the absorbed dose in the water cylinder for (a) 1.5 MeV, (b) 1.0 MeV, and (c) all four energies of beta-ray sources.
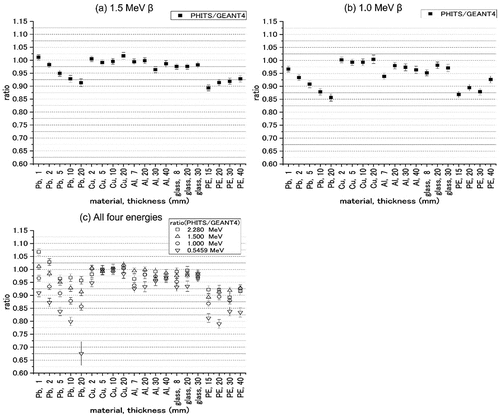
Among various conditions on the thickness and material of the shielding plate, most calculation results on the absorbed dose for the 2.280 MeV beta-ray source correlated within 10%, and the difference did not increase as the thickness increased. For the 0.5459 MeV beta-ray source, most calculation results for lead and polyethylene correlated within approximately 20%; the difference in the 20 mm thick lead was ~30%, but the calculation results for the other materials correlated within 10%. As shown in (c), for the four energies of the beta-ray source, the lead ratio depends on the energy and thickness, and the ratio of polyethylene is lower than that of the other three materials at approximately 1, correlating well within 10%.
The lead ratio changes systematically depending on the thickness and differs from other substances in the thickness dependence of the ratio. The difference in the lead results increased as the beta-ray source energy decreased and the thickness of the shielding plate increased. One reason for the dependence of the lead results might be the difference in the angular distributions used in the two calculation codes, as mentioned in 4.3. Since the scattering angle spreads and the proportion of small-angle scattering decreases when the energy is low, the radiation incident on the periphery of the water cylinder increases proportionally to escape from the water cylinder, and the absorbed dose decreases accordingly. Therefore, the angle distribution influences the proportion and absorbed dose. In addition to the disparity in angular distribution, high-Z materials produce a significant amount of bremsstrahlung radiation, and PHITS lacks high calculation accuracy and reliability due to the inapplicability of the energy range below several tens of keV. The slight differences could cause the results for the lead with a thickness of 20 mm due to the above reasons being amplified by the thickness.
Polyethylene comprises hydrogen and carbon, and the accuracy of the hydrogen cross section is worse than that of other atoms, as mentioned in 4.1.1. The worse precision might cause a difference in the polyethylene results.
I then considered the reason for the difference in the ratio of the absorbed dose under bremsstrahlung-generating conditions for PHITS and GEANT4 () using the subtraction method. PHITS can extract the bremsstrahlung contribution only by specifying conditions; however, GEANT4 extracts from the difference between cases where bremsstrahlung is inactive and whole. Therefore, managing the electrons would differ if bremsstrahlung did not occur because of the inactive setting in GEANT4. As a trend of lead for each beta-ray energy (), the thicker the lead, the larger the absorbed dose of GEANT4 than that of PHITS. Thus, the absorbed dose under the inactive condition of GEANT4 that corresponds to the amount subtracted from the total absorbed dose decreases. During the inactive condition of GEANT4, more energy will drop into the lead shield, resulting in a higher percentage of stoppages and less reaching the water cylinder. This result is caused by the difference in dropping the energy in the GEANT4 inactive condition, particularly remarkable in lead, which has a large Z and generates a large amount of bremsstrahlung. An issue occurs regarding whether the bremsstrahlung extraction method of GEANT4 using this inactive setting is appropriate because it affects the accuracy of the absorbed dose of lead and causes the difference in the results of the two calculation codes.
The EGS5 code was used for electron and photon calculations in the PHITS code by selecting its use. The EGS5 is an evaluated simulation code whose certainty was assessed and certified by comparing experimental values, and is widely used for this type of evaluation [Citation35–38]. This article’s calculation results, where PHITS was compared with GEANT4, are the intercomparison results between the two calculation codes. The calculation codes can evaluate absorbed doses within the accuracy mentioned above on the difference in the results, depending on the energy and material. The dosimeters for gamma rays used in the reactor measure gamma rays from gamma-ray sources, such as 137Cs, and bremsstrahlung photons caused by high-energy β-ray sources, such as 90Sr (90Y). These are challenging to measure separately, but computational evaluations can be performed, such as estimating the proportions of their contribution, with the same accuracy as evaluated here in PHITS and GEANT4. Bremsstrahlung photons are generated in the materials due to high-energy beta sources behind the materials and can pass through the materials and reach the workers in the nuclear reactor. The amount of bremsstrahlung photons generated can vary depending on the condition of the collapsed nuclear reactor building structure. Therefore, it is important to appropriately analyze and evaluate the effects of bremsstrahlung radiation photons in terms of radiation management of workers and in considering the decontamination of materials that have attached radiation sources that cause bremsstrahlung radiation. It is expected to be used analytically for future decommissioning and decontamination work planning and radiation control.
5. Conclusions
The evaluation of doses caused by bremsstrahlung due to beta-emitting radionuclides was required for workers’ radiation protection in decommissioning the nuclear reactor. The calculation results for the PHITS and GEANT4 codes were compared to verify the accuracy of the dose evaluation for bremsstrahlung. Beta-ray sources of 0.5459, 1.0, 1.5, and 2.280 MeV were used to simulate a simple calculation system with a shielding plate of various materials and thicknesses. Both calculation codes were used to calculate the absorbed dose and deposited energy spectrum in the water cylinder behind the shielding plate.
While comparing the deposited energy spectrum, the spectral shapes showed consistent trends; however, some results below several tens of keV for PHITS were higher than those for GEANT4. Even when the thickness of the shielding plate of various materials increased, the results between the two calculation codes correlated within 10% in most cases for the 2.280 MeV beta-ray source for the absorbed dose. Most of the absorbed dose of PHITS became 10%–20% lower than that of GEANT4 for lead and polyethylene when the energy of the beta-ray source decreased. The absorbed dose of the 20 mm thick lead using the 0.5459 MeV beta-ray source was approximately 30% lower; however, the results for other materials correlated within 10% between the two calculation codes. Several reasons were considered in the discussion section for this difference. From the results, the precision of the above level was achieved. Based on this study, for the detectors used in the reactor, PHITS and GEANT4 can be used with a certain degree of accuracy for evaluation calculations for the classification and consideration of gamma-ray sources, thereby providing an effective method for performing the radiation management of workers.
Acknowledgments
I thank Dr. Kimiaki Saito for advising me to investigate the reasons for the difference in the calculation results between the two simulation codes. Part of PHITS calculations was conducted using the supercomputer HPE SGI8600 in the Japan Atomic Energy Agency. This work was partially carried out in a subsidy program of “Project of Decommissioning and Contaminated Water Management,” entitled “Development of Technologies for Work Environmental Improvement in Reactor Building (Development of Exposure Reduction Technologies by Digitalization of Environment and Radioactive Source Distribution).”
Disclosure statement
No potential conflict of interest was reported by the author(s).
Additional information
Funding
References
- Sanada Y, Sugita T, Nishizawa Y, et al. The aerial radiation monitoring in Japan after the Fukushima Daiichi nuclear power plant accident. Prog Nucl Sci Technol. 2014;4:76–80. doi: 10.15669/pnst.4.76
- Saito K, Mikami S, Andoh M, et al. Summary of temporal changes in air dose rates and radionuclide deposition densities in the 80 km zone over five years after the Fukushima nuclear power plant accident. J Environ Radioact. 2019;210:105878. doi: 10.1016/j.jenvrad.2018.12.020
- Andoh M, Mikami S, Tsuda S, et al. Decreasing trend of ambient dose equivalent rates over a wide area in eastern Japan until 2016 evaluated by car-borne surveys using KURAMA systems. J Environ Radioact. 2018;192:385–398. doi: 10.1016/j.jenvrad.2018.07.009
- Andoh M, Yamamoto H, Kanno T, et al. Measurement of ambient dose equivalent rates by walk survey around Fukushima Dai-ichi nuclear power plant using KURAMA-II until 2016. J Environ Radioact. 2018;190-191:111–121. doi: 10.1016/j.jenvrad.2018.04.025
- Mikami S, Tanaka H, Matsuda H, et al. The deposition densities of radiocesium and the air dose rates in undisturbed fields around the Fukushima Dai-ichi nuclear power plant; their temporal changes for five years after the accident. J Environ Radioact. 2019;210:105941. doi: 10.1016/j.jenvrad.2019.03.017
- Matsuda N, Mikami S, Shimoura S, et al. Depth profiles of radioactive cesium in soil using a scraper plate over a wide area surrounding the Fukushima Dai-ichi nuclear power plant, Japan. J Nucl Sci Technol. 2015;139:427–434. doi: 10.1016/j.jenvrad.2014.10.001
- Sato Y, Terasaka Y. Radiation imaging of a highly contaminated filter train inside Fukushima Daiichi nuclear power station unit 2 using an integrated radiation imaging System based on a Compton camera. J Nucl Sci Technol. 2023;60(8):1013–1026. doi: 10.1080/00223131.2022.2159894
- Terada H, Nagai H, kadowaki M et al. Dependency of the source term estimation method for radionuclides released into the atmosphere on the available environmental monitoring data and its applicability to real-time source term estimation. J Nucl Sci Technol. 2023;60(8):980–1001. doi: 10.1080/00223131.2022.2162139
- Omori Y, Sasaki R, Otsuki Y, et al. Walking survey technique for ambient gamma dose rate measurement established in Fukushima Medical University. J Nucl Sci Technol. 2022;59(8):1061–1070. doi: 10.1080/00223131.2021.2023370
- Shinma D, Murata Y, Ueno Y, et al. Dose rate distribution measuring method using personal dosimeters and localization devices. J Nucl Sci Technol. 2022;59(8):972–982. doi: 10.1080/00223131.2021.2023369
- Sato T, Niita K, Matsuda N, et al. Particle and heavy ion transport code system, PHITS, version 2.52. J Nucl Sci Technol. 2013;50:913–923. doi: 10.1080/00223131.2013.814553
- Sato T, Niita K, Matsuda N, et al. Overview of particle and heavy ion transport code system PHITS. Ann Nucl Energy. 2015;82:110–115. doi: 10.1016/j.anucene.2014.08.023
- Sato T, Iwamoto Y, Hashimoto S, et al. Features of Particle and Heavy Ion transport code System (PHITS) version 3.02. J Nucl Sci Technol. 2018;55(5–6):684–690.
- The 9th committee on accident analysis of Fukushima Daiichi nuclear power station, Document 3 and 4 [Internet]. Japan: Nuclear Regulation Authority; 2019 Dec 26 [cited 2023 Feb 21]. Available from: https://www.nsr.go.jp/disclosure/committee/yuushikisya/jiko_bunseki01/140000009.html [in Japanese].
- The committee on accident analysis of Fukushima Daiichi nuclear power station (before 2021 Oct) [Internet]. Japan: Nuclear Regulation Authority; 2021 Oct 19 [cited 2023 Feb 21]. Available from: https://www.nsr.go.jp/disclosure/committee/yuushikisya/jiko_bunseki01/2021.html [in Japanese]
- The 28th committee on accident analysis of Fukushima Daiichi nuclear power station [Internet]. Japan: Nuclear Regulation Authority; 2022 Feb 28 [cited 2023 Feb 21]. Available from: https://www.nsr.go.jp/disclosure/committee/yuushikisya/jiko_bunseki01/140000067.html [in Japanese]
- Agostinella S, Allison J, Amako K, et al. Geant4 - a simulation toolkit. Nucl Instrum Methods Phys Res A. 2003;506:250–303.
- Geant4 Collaboration. GEANT4: physics reference manual release 10.4. 2017 [cited 2023 Jun 22] Available from: https://indico.cern.ch/event/679723/contributions/2792554/attachments/1559217/2454299/hysic sReferenceManual.pdf
- Allison J, Amako K, Apostolakis K, et al. Recent developments in GEANT4. Nucl Instr Meth A. 2016;835:186–225. doi: 10.1016/j.nima.2016.06.125
- ICRP. Conversion coefficients for use in radiological protection against external radiation. ICRP Pulication. 74. Oxford: Pergamon Press; 1996.
- Murata T, Miwa K, Matsubayashi F, et al. Optimal radiation shielding for beta and bremsstrahlung radiation emitted by 89Sr and 90Y: validation by empirical approach and Monte Carlo simulations. Ann Nucl Med. 2014;28(7):617–622.
- Hirayama H, Namito Y, Bielajew AF, et al. The EGS5 CODE SYSTEM. 2015 [cited 2023 Jun 22] Available from: http://rcwww.kek.jp/research/egs/egs5_manual/slac730-150228.pdf
- Mrdja D, Bikit K, Bikit I, et al. Monte Carlo simulation of beta particle-induced bremsstrahlung doses. J Radiol Prot. 2018;38(1):34–47. doi: 10.1088/1361-6498/aa928f
- Koch HW., W J., WM J. Bremsstrahlung cross-section formulas and related data. Rev Mod Phys. 1959;31:920–955. doi: 10.1103/RevModPhys.31.920
- Rogers DWO, Duane S, Bielajew AF et al. Use of ICRU-37/NBS radiative stopping powers in the EGS4 system. Report PIRS-0177, National Research Council of Canada, 1989.
- ICRU. Stopping powers for electrons and positrons, ICRU Report 37 1984
- Perkins ST, Cullen DE, Seltzer SM. Tables and graphs of electron-interaction cross sections from 10eV to 100 GeV derived from the LLNL evaluated electron data Library, Z=1-100. UCRL-50400 1991;31.
- Seltzer M, J BM. Bremsstrahlung spectra from electron interactions with screened atomic nuclei and orbital electrons. Nucl Instrum Meth Phys Res B. 1985;12:95.
- Seltzer M, Berger MJ. Bremsstrahlung energy spectra from electrons with kinetic energy 1 keV-10 GeV incident on screened nuclei and orbital electrons of neutral atoms with Z = 1-100. At Data And Nucl Data Tables. 1986;35:345.
- Pratt RH, Rseng HK, Lee CM, et al. Bremsstrahlung energy spectra from electrons of kinetic energy 1 keV ≤ T1 ≤ 2000 keV incident on neutral atoms 2≤ Z ≤ 92. At Data Nucl Data Tables. 1977;20:175. errata in 1981:26:477.
- Tsai Y. Pair production and bremsstrahlung of charged leptons. Rev Mod Phys. 1977;49:421.
- Kissel L, Quarls CA, Pratt RH. Bremsstrahlung from electron collisions with neutral atoms. At Data Nucl Data Tables. 1983;28:382.
- Tseng HK, Pratt RH, Lee CM. Electron bremsstrahlung angular distributions in the 1-500 keV energy range. Phys Rev A. 1979;19:187.
- Text of the training session in ESG workshop [Internet]. Japan: KEK Radiation Science Center [cited 2023 Jun 22]. Available from: https://rcwww.kek.jp/egsconf/index.html [in Japanese]
- Faddegon BA, Ross CK, Rogers DWO. Forward-directed bremsstrahlung of 10- to 30-MeV electrons incident on thick targets of Al and Pb. Med Phys. 1990;17(5):773–785. doi: 10.1118/1.596560
- Faddegon BA, Ross CK, Rogers DWO. Angular distribution of bremsstrahlung from 15 MeV electrons incident on thick targets of be, al and Pb. Med Phys. 1991;18:727–739.
- Nair HG, Nayak MK, Dev V, et al. Dose build up correction for radiation monitors in high-energy bremsstrahlung photon radiation fields. Radiat Prot Dosimetry. 2006;118(3):233–237. doi: 10.1093/rpd/nci353
- Namito Y, Hirayama H, Ban S. Improvements of low-energy photon transport in EGS4. Radiat Phys Chem. 1998;53(3):283–294. doi: 10.1016/S0969-806X(98)00110-8