
Abstract
Winter grazing of forage kale (Brassica oleracea var. acephala L.) has been linked to environmental pollution and negative animal health issues. An experiment with seven nitrogen (N) fertiliser application rates (0–500 kg N ha−1) was carried out at Lincoln, Canterbury, New Zealand to investigate N uptake, partitioning, apparent N use efficiency (aNUE) and nutritive value of forage kale. Final harvest dry matter (DM) yield increased four-fold to 25.5 t ha−1 when 500 kg N ha−1 was applied compared with the 0 kg N ha−1 crops, and N uptake by five-fold to 425 kg ha−1. The inability of the crops receiving ≤100 kg N ha−1 to attain critical leaf area index and critical level of specific leaf nitrogen content resulted in lower DM yield compared with the higher N fertiliser application rates. The aNUE decreased from 111.6 kg DM kg−1 N for the 50 kg N ha−1 crops to 37.5 kg DM kg−1 N for the 500 kg N ha−1 crops. Nitrogen fertiliser application rate had no systematic effect on the crude fibre content of the kale crops. The crude protein content was unaffected by N supply, and ranged between 7.7% and 10.5%. Under conditions of optimal water and nutrient supply on deep soils with high water-holding capacity and long growing season (c. 7 months), it is recommended that N fertiliser is applied at 300 kg N ha−1 to achieve a yield of about 22 t ha−1 and aNUE of ≥51 kg DM kg−1 N applied.
Introduction
Forage kale (Brassica oleracea var. acephala L.) is an important crop for winter feeding in temperate regions of the world, for example in New Zealand, the UK, continental Europe and the Pacific coast of America (Pelletier & Donefer Citation1973; Guillard et al. Citation1995). Forage kale crops have large nutrient requirements, and under conditions of adequate fertiliser and water availability, yields in New Zealand can exceed 20 t dry matter (DM) ha−1 (Wilson & Maley Citation2006; Fletcher et al. Citation2007). Wilson et al. (Citation2006) estimated that an 18 t DM ha−1 kale crop removes up to 360 kg nitrogen (N) ha−1 from the soil. Studies also indicate that a sub optimal N supply results in poor forage kale yields (Wilson et al. Citation2006; Fletcher et al. Citation2007; Chakwizira et al. Citation2009, Citation2012, Citation2014a). However, excess N applications can lead to accumulation of elevated nitrate-nitrogen in the plant (Fletcher & Chakwizira Citation2012; Chakwizira et al. Citation2015), leading to animal health issues, for example, nitrate poisoning (Nichol et al. Citation2003; Nichol Citation2007) and/or environmental pollution through nitrate leaching and/or denitrification (Smith et al. Citation2008; Smith et al. Citation2012; Monaghan et al. Citation2013) under winter grazed forage brassicas. Therefore, it is important that the nitrogen supply is closely matched with crop requirements, which must also consider the background soil fertility status (i.e. the amount of already existing soil N), soil moisture levels (Chakwizira et al. Citation2013) and potential crop yield (Wilson et al. Citation2006). These factors will inevitably differ from site to site. The environmental effects may be exacerbated by urine returns after grazing (Smith et al. Citation2012), especially under wet conditions when most of the kale crops are grazed, and also from excessive N fertiliser use.
The effect of N supply on kale DM production and/or N uptake is well understood (Wilson & Maley Citation2006; Wilson et al. Citation2006; Fletcher et al. Citation2007; Chakwizira et al. Citation2009, Citation2013). However, there is a gap in the knowledge of the effects of N supply on N use efficiency (NUE; kg DM kg−1 N), feed quality and specific leaf N. Nitrogen supply needs to be closely matched to crop demand to achieve optimum NUE. To achieve high NUE, fertiliser N should be applied when it is required for growth (Binder et al. Citation2000). However, there are practical and economic limitations to the number and timing of N applications in large-scale operations (Chakwizira et al. Citation2014b). The development of best management practices is therefore required to achieve high productivity but low environmental impact through reduced N inputs and lower N losses.
The net photosynthesis of crop leaves and/or canopies is closely linked to the N status of the crop (Sinclair & Horie Citation1989), expressed at canopy level as specific leaf N (SLN; g N m−2) and can be represented by radiation use efficiency (RUE; g DM MJ−1; Monteith Citation1977). RUE decreases when SLN falls below a critical threshold (Sinclair & Horie 1989). Chakwizira et al. (Citation2014a) established a critical SLN (SLNcrit) of 2.6 g N m−2 for forage kale. These authors also showed that crops growing at leaf N content below the SLNcrit had limited potential to maximise biomass accumulation. Low SLN has been associated with a reduction in the rate of leaf area index (LAI; m2 m−2) expansion and subsequent reduction in radiation interception. For maximum DM production, crops have to attain a critical leaf area index (LAIcrit: the leaf area index at which the crop intercepted ≥95% of incoming photosynthetically active radiation) of 3.4 m2 m−2 (Chakwizira et al. Citation2011) earlier in the growing season and maintain full cover, particularly through summer, when radiation receipts are highest.
Generic feed quality values have been reported (Westwood & Mulcock Citation2012; Rugoho et al. Citation2014; Westwood et al. Citation2014) for ‘Gruner’ kale grown under non-limiting conditions of water and nutrient supply. For example, metabolisable energy (ME) values of 10–12 MJ kg−1 DM and neutral detergent fibre (NDF) of 30%–35% DM are consistent with recommendations for optimum animal nutrition (NRC Citation2001). However, the crude protein (CP) content reported by the same authors varied widely from 7.2%–15% (Westwood & Mulcock Citation2012; Westwood et al. Citation2014) to 17.5% (Rugoho et al. Citation2014). The effects of N supply on feed value attributes have not been determined for forage kale. Moreover, these quality attributes have been shown to vary with N supply in other forage crops, for example, fodder beet (Albayrak & Yuksel Citation2010) and forage turnips (Turk et al. Citation2009). The objective of the research reported in this paper was to establish the effects of N application rates on nitrogen uptake and nitrogen use efficiency and determine feed quality attributes of forage kale grown under different N rates.
Materials and methods
The experiment was conducted at the New Zealand Institute for Plant & Food Research, Lincoln (43.83°S, 171.72°E), Canterbury, New Zealand. The site was situated on a deep (>1.6 m), well-drained Templeton silt loam (Immature Pallic soil [Hewitt Citation2010]; Udic Ustochrept [Soil Survey Staff Citation1998]) with an available water-holding capacity of about 190 mm m−1 of depth (Jamieson et al. Citation1995). Physical characteristics of the soil were reported by Martin et al. (Citation1992). The climate at Lincoln is temperate, with mild to cool winters and warm summers. Mean annual rainfall is 600 mm, distributed evenly throughout the year (NIWA Citation2014). Full weather details for the site during the study period and average long-term climate from 1970 to 2010 have been described by Chakwizira et al. (Citation2014a,Citationb).
The experiment was a randomised block design, with seven rates of N (0, 50, 100, 200, 300, 400 and 500 kg ha−1) replicated four times. The estimated optimum N rate for the site, based on the forage brassica calculator (Wilson et al. Citation2006; Chakwizira et al. Citation2012) was 300 kg N ha−1. Briefly, the forage brassica calculator determines the amount of fertiliser applied based on predetermined information such as site history (location and soil properties) and crop details (Chakwizira et al. Citation2012). The yield of the crop is based on average thermal time and solar radiation for specific locations in New Zealand. However, these calculators assume no water stress and therefore projected yield adjustments are required for rain-fed crops.
Cultivation involved deep ploughing followed by power harrowing. Soil samples to 150 mm depth were collected on 14 October 2011 and the average soil test results were: pH 6.1, P 19 mg kg−1, K 160 mg kg−1, Ca 1500 mg kg−1, Mg 45 mg kg−1, Na 40 mg kg−1, sulphate-S 40 mg kg−1 soil and available mineral N 55 kg ha−1. The amounts of soil nutrients were determined as ‘MAF quick-test units’(Mountier et al. Citation1966) and converted into mg kg−1 dry soil using the following conversion factors: P, ×1.1; Ca, ×125; K, ×20; and Mg, Na, ×5 (Chapman & Bannister Citation1994). Soil mineral N (nitrate and ammonium) tests were taken from individual plots before the different rates of fertiliser N were applied on 17 November 2011 (initial soil N) and again after the final harvest of the crops on 5 June 2012 (final soil N) to a depth of 1000 mm. The total soil N averaged per treatment for the initial and final soil N tests are shown in . The N fertiliser was applied as urea (46% N) and broadcast in equal amounts on 17 November (16 days after sowing [DAS]) and 29 December 2011 (58 DAS). Basal fertiliser comprising 250 kg ha−1 triple superphosphate (TSP; P = 20.5%) and 10 kg ha−1 borate 46 (B = 15%) was broadcast and incorporated into the soil before sowing.
Table 1 Background soil mineral nitrogen levels at the start of the experiment (initial) and at the final harvest (final), total dry matter yield, additional DM yield (difference between final DM and control crops), apparent NUE and stem and total N uptake.
The cultivar ‘Gruner’, a giant kale (Westwood et al. Citation2014) was drilled on 2 November 2011 at 4 kg ha−1 in 150 mm rows into a cultivated seedbed using a Taege drill with Oyjord cone. Plot size was 3.9 × 10.0 m (area = 39 m2), with 0.5 m between plots. Seeds were pelleted with ‘Superstrike® Brassica’ (a.i thiamethoxam, iprodiane and thirum; PGG Wrightson, Christchurch, New Zealand) to guard against springtails (Bourletiella spp.) and fungal infections (Salmon & Dumbleton Citation2006). Insecticides Diazinon 800 EC and Lorsban™ 50 EC (a.i. 50% chlorpyrifos) were applied to kale seedling at 1 L ha−1 on 8 November and 20 December 2011, respectively. The herbicide Banvel® (a.i. 200 g/L dicamba) was applied on 20 December 2011.
Measurements
Dry matter yield
Dry matter harvests were taken at five-weekly intervals from 17 January to the final harvest on 5 June 2012. Quadrat size was 0.5 m2 for the sequential harvests and 1 m2 for the final harvest. The number of plants and total fresh mass per quadrat was determined in the field at each harvest. A representative five-plant subsample was retained on each harvest date to determine total DM yield. Each subsample was partitioned into leaf lamina, petiole and stem component. However, the DM partitioning was reported as leaf (combined petiole and lamina) and stem yield components. Dry mass was determined after drying at 60 oC to a constant mass. A subsample of leaf lamina was used to determine leaf area, using a leaf area meter (LI-COR model LI-3100; Lincoln, Nebraska, USA). The total leaf area per quadrat was determined and used to calculate the leaf area index. The accumulated LAI and a critical LAI (LAIcrit) of 3.4 m2 m−2 (Chakwizira et al. Citation2011) were used to interpret canopy development process during the season.
Nitrogen uptake and use efficiencies
Total N concentration for both the leaf and stem fractions were determined by Dumas combustion using a LECO CNS-200 analyser (LECO Corporation, St Joseph, MI, USA). Total N uptake was then calculated by multiplying plant component DM yield by the concentration of N in the harvested component. Nitrogen use efficiency was defined as the ratio of additional DM yield to fertiliser N input; often termed the agronomic efficiency (Singh et al. Citation1998; Asseng et al. Citation2001; Baligar et al. Citation2001). This was referred to as apparent NUE (aNUE) and was calculated as expressed in Equation (1) (Singh et al. Citation1998; Zemenchik & Albrecht Citation2002):
It is important to note that aNUE calculations do not account for mineral N stored in the soil or derived from mineralisation of soil organic matter, and therefore variations in NUE per treatment are likely. This differs from the traditional calculations of NUE as a quotient of total DM () and total N available (soil N plus fertiliser N) (Moll et al. Citation1982).
Specific leaf nitrogen (SLN; g N m−2 leaf area) was calculated as the quotient of leaf nitrogen content and specific leaf area (Borrell & Hammer Citation2000; Massignam et al. Citation2001). The nutritive values were determined on a whole crop basis using near-infrared reflectance spectroscopy at feedTech laboratory at AgResearch, Palmerston North, New Zealand (Corson et al. Citation1999). Nutritive quality attributes measured included crude protein, acid detergent fibre and neutral detergent fibre (ADF, NDF) content, ash, lipid, soluble sugars and starch (SSS) and metabolisable energy (ME; MJ kg−1 DM).
Data analyses
Data were analysed using analyses of variance (ANOVA) in GenStat v.14 (VSN International, Hemel Hempstead, UK). Significant interactions and main effects were separated using Fisher’s protected least significant difference (LSD) tests (α = 0.05). Where values show P < 0.1, a trend is indicated in the text. There was a wide variation in the background soil mineral N levels among the plots (). However, an analysis with background N as a covariate did not show a significant effect. As a result, analyses included N application rate as the independent variable.
Results
Total DM yield at the final harvest for the 0 kg N ha−1 crops was 6.7 t ha−1. When N was applied at 50 kg N ha−1, DM yield increased (P < 0.001) by 84% to 12.3 t DM ha−1, and was almost five-fold higher (P < 0.001) when 500 kg N ha−1 was applied compared with the 0 kg N ha−1 (). However, the differences in incremental proportion of DM yield decreased with each successive rate of N. There were no yield differences between the 300 and 400 kg N ha−1 rates at the final harvest. The DM yields for the 0 kg N ha−1 crops were consistently lower (P < 0.001) than fertilised crops throughout the growing period ().
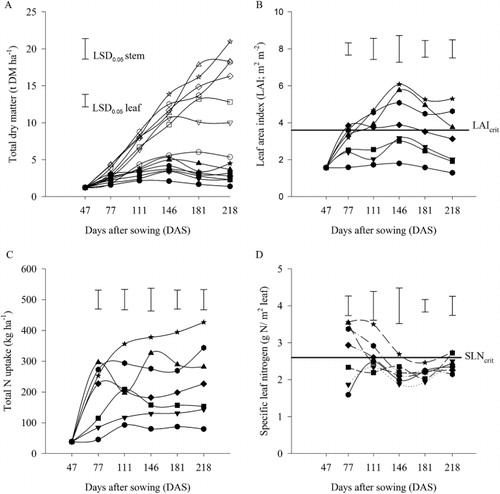
The partitioning of DM to the leaves and stems showed a consistent pattern. Leaf DM increased with increasing total biomass up to 146 DAS. Stem DM, particularly for the ≥200 kg N ha−1, continued to increase to the final harvest at 218 DAS. Stems contributed about 80%–86% of the total DM at the final harvest, across all treatments. At the final harvest, the maximum leaf and stem DM were 5.4 and 21.1 t ha−1, respectively, both observed in the 500 kg N ha−1 treatment.
The LAI increased (P < 0.001) with N application () and was consistently higher with increasing N supply throughout the growing season. For example, at 77 DAS, LAI for the 0 kg N ha−1 crops was 1.6 m2 m−2 compared with 3.2 m2 m−2 when 500 kg N ha−1 was applied. Similarly, at the end of the growing season, LAI was 1.3 m2 m−2 and 5.3 m2 m−2 for the 0 and 500 kg N ha−1 crops, respectively. However, there were no differences in LAI between the 400 and 500 kg N ha−1 crops. The maximum LAI of 6.1 m2 m−2 was attained 146 DAS for the 500 kg N ha−1 crops. The LAI for the crops receiving ≤100 kg N ha−1 were consistently below the LAIcrit throughout the growing season, compared with the crops receiving ≥300 kg N ha−1 that maintained full cover through to the final harvest. The 200 kg N ha−1 crops maintained full cover for 104 days.
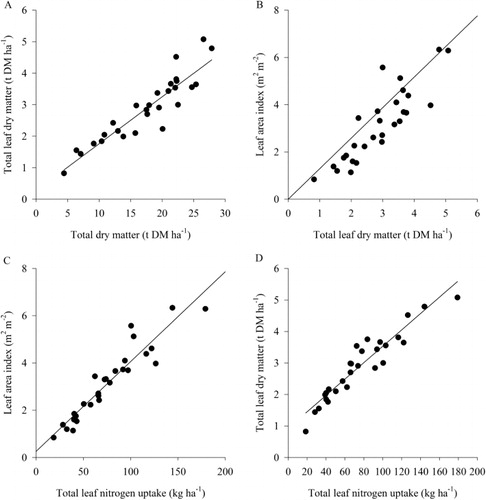
The relationship among leaf attributes () showed strong positive correlations (R2 ≥ 0.76). Leaf DM accounted for 84% of the variation in total DM, and for every 1 t DM ha−1 increase in total DM, leaf DM increased by 150 kg DM ha−1.
Total N uptake increased (P < 0.001) five-fold with N application, from 85 kg ha−1 for the 0 kg N ha−1 crops to 425 kg ha−1 for the crops receiving 500 kg N ha−1 (). Nitrogen uptake for the 0–400 kg N ha−1 treatments levelled off at about 111 DAS on average (). Nitrogen uptake maxima were markedly affected by N supply. When N was applied at 0 and 50 kg N ha−1, N uptake plateaued at about 85 and 130 kg N ha−1, respectively, compared with 300 kg N ha−1 for the 300 and 400 kg N ha−1 application rate. At least 70% of the total N uptake was within the first 111 DAS across all treatments. At the final harvest, the proportion of total N stored in the stems differed (P = 0.05) with N fertiliser application rate (), with 49 and 91 kg N ha−1, for the 0 and 50 kg N ha−1, respectively, stored in the stems. This represented c. 62% of the total N uptake. Similarly, stems stored 102 and 282 kg N ha−1, which was c. 66% of the total N in the above-ground N when 100 and 500 kg N ha−1 fertiliser was applied, respectively.
There was a significant (P = 0.002) interaction between the time of harvest and specific leaf N content (). Specifically, there were treatment effects earlier in the season, up to 111 DAS, with no significant differences (P = 0.244) observed from then until final harvest at 218 DAS. Treatment effects were inconsistent for the ≤100 kg N ha−1 treatments over time. Treatments receiving ≤100 kg N ha−1 failed to achieve the SLNcrit throughout the growing season.
Nitrogen use efficiency
The apparent NUE at the final harvest decreased (P ≤ 0.01) with increasing N application rate (). For example, aNUE decreased from 111.6 kg DM kg−1 N when 50 kg N ha−1 was applied to 37.5 when 500 kg N ha−1 was applied. However, there were no differences in aNUE among the treatments receiving ≥200 kg N ha−1. Between 26.6 and 47.5 kg N ha−1 of the total soil plus fertiliser N remained in the soil at the end of the season across the treatments, with higher values associated with crops receiving ≥300 kg N ha−1.
At the final harvest, N fertiliser application rates had no consistent effect on nutritive value of ‘Gruner’ kale (). Nitrogen fertiliser rates were statistically significant (P ≤ 0.06) for ADF and ME, but the responses were inconsistent with respect to N treatment level. For example, ADF values were similar for the 0 kg N ha−1 crops and other treatments, but the crops receiving 400 kg N ha−1 had lower values than the 100 and 200 kg N ha−1 crops. Moreover, CP was not affected (P = 0.48) by the application of N, and ranged between 7.7% and 10.5% across the treatments (). The crude fibre content averaged 29.1% for ADF and 42.7% for NDF. These were above the minimum requirements for animal production. The ME and SSS were at 12.2 MJ kg−1 DM and 30.8%, respectively.
Table 2 Nutritive value of forage kale grown under seven nitrogen application rates at Lincoln, Canterbury in the 2011–2012 season and optimum range (NRC Citation2001; Nichol et al. Citation2003).
Discussion
The increase in DM yield with N supply is consistent with reports in the literature (Fletcher et al. Citation2007; Chakwizira et al. Citation2009, Citation2013, Citation2014a, Citation2015). The low DM yield for the treatments receiving ≤100 kg N ha−1 (; ) may be attributed either to: (1) the inability of these crops to close their canopies (); and/or (2) the low SLN content for these crops earlier in the growing season (). The ≤100 kg N ha−1 crops did not attain the LAIcrit throughout the growing season (), resulting in reduced radiation interception and the subsequent low DM yields. The crops receiving 200 kg N ha−1 reached and maintained leaf area above LAIcrit for 104 days, while crops receiving ≥300 kg N ha−1 maintained leaf area above LAIcrit for a period of about 141 days before final harvest. The implication was that both attainment of the LAIcrit (full cover) and the duration above LAIcrit are important as they determine the total amount of radiation intercepted and consequently total DM yield produced.
The SLN differed with N fertiliser rates (), with differences more pronounced during the summer months (January–February). This is the period of maximum radiation load and therefore highest potential growth rate. During this period, the SLN of ≤2.4 g N m−2 leaf for the treatments receiving ≤100 kg N ha−1 () was lower than the critical level of SLN (SLNcrit) of 2.6 g N m−2 established by Chakwizira et al. (Citation2014a). These authors showed substantial reduction in potential biomass accumulation for crops grown below the SLNcrit. These observations of low SLN caused by reduced leaf area expansion and increased leaf senescence have also been observed in other crop species (Massignam et al. Citation2009). The net photosynthesis of crop leaves and/or canopies is closely linked to the SLN (Sinclair & Horie Citation1989). Furthermore, the net photosynthesis of a crop can be represented by radiation use efficiency (Monteith Citation1977), which decreases when SLN falls below a critical threshold (Sinclair & Horie Citation1989). Therefore, variation of SLN in this experiment may have contributed to the differences in DM yields reported.
Nitrogen uptake increased (P < 0.001) with N supply (). At the end of the season (), the crops receiving 500 kg N ha−1 had taken up a total of 425 kg N ha−1, which was five-fold higher than the 0 kg N ha−1 crops and double those receiving 200 kg N ha−1. These results were consistent with those reported by Wilson et al. (Citation2006) and Fletcher et al. (Citation2007). Moreover, most of the N was taken up earlier in the season (111 DAS), which was consistent with reports for other forage crops, such as fodder beet (Chakwizira et al. Citation2014b). When factoring in the average background available soil N at the site of 89 kg ha−1 (), the crops took up 64%–68% of the applied N for the crops receiving ≥100 kg N ha−1. The deep, well-drained Templeton silt loam (Jamieson et al. Citation1995) soil can influence the way both soil and fertiliser N is used by the crops. These soils are able to keep the N in the root zone for longer, thus making it available to the crops, which may explain the high N uptake in . This, coupled with the irrigation of the crops, meant the crops were able to take up most of the total N from the soil (85–285 kg N ha−1; ) when 0–200 kg N ha−1 was applied, compared with the 114–136 kg N ha−1 reported by Stevens & Carruthers (Citation2008) for similar levels of total N input for rain-fed forage kale. Kale crops grown under irrigation in deep soils have a higher yield potential (Wilson et al. Citation2006) than rain-fed crops in shallower soil (Stevens & Carruthers Citation2008; Chakwizira et al. Citation2009). The implication is that the rate of N application should be based on soil depth, water availability and length of growth season, as they all determine the yield potential for any site.
The amount of N remaining in the soil () was higher for the crops receiving ≥300 kg N ha−1 at 38–48 kg N ha−1 than the 27–33 kg N ha−1 for crops receiving ≤200 kg N ha−1. Crops with high N inputs therefore present as high risk for winter nitrate leaching because of slow growth and low N uptake potential during winter. Moreover, bare land following in situ winter grazing is susceptible to high drainage losses and associated leaching of residual N. This, coupled with the fact that more than 70% of the ingested N is returned to the soil in the urine (Haynes & Williams Citation1993), means large amounts of the N taken up by the crops () can potentially be returned to the soil and exposed to leaching, causing environmental pollution. Recent studies show that annual nitrate leaching losses under winter grazed forage brassicas range between 52–81 kg N ha−1 (Smith et al. Citation2008; Smith et al. Citation2012; Monaghan et al. Citation2013). This includes both residual and urine-returned N. The data we show for the residual N () with no urine addition are comparatively high.
High crop N uptake may also contribute to animal health problems during grazing, for example, excess nitrates (Fletcher & Chakwizira Citation2012; Chakwizira et al. Citation2015) leading to nitrate poisoning (Nichol Citation2007). However, crops receiving ≤100 kg N ha−1 took up more N than was applied; this implies there was some additional N in the soil, which could be attributed to the release of organic forms of soil N via mineralisation processes.
The inverse relationship between yield and aNUE () was consistent with previous studies on maize (Islam & Garcia Citation2012) and fodder beet (Chakwizira et al. Citation2014b). The aNUE of 37–112 kg DM kg−1 N () in the current experiment was consistent with the range of 29–96 kg DM kg−1 N applied (when recalculated excluding the yield of the 0 kg N ha−1 crops) for ‘Gruner’ kale (Fletcher et al. Citation2007) grown under the same range of N application rates, at the same site.
The high stem proportion of total DM (84%; ) was consistent with previous reports (Fletcher & Chakwizira Citation2012; Westwood & Mulcock Citation2012) and has implications for the overall quality of the feed. Westwood & Mulcock (Citation2012) reported low CP but high ADF and NDF for ‘Gruner’ kale compared with the short and medium height cultivars ‘Kestrel’ and ‘Regal,’ respectively, which are characterised by a high leaf to stem ratio (Adams et al. Citation2005; Chakwizira et al. Citation2010). Neither ADF nor NDF differed systematically with N application (), which is inconsistent with previous reports for other forage brassica crops, for example, forage turnips (Turk et al. Citation2009). These authors reported a decrease in ADF from a weighted mean of 18% for the 0 kg N ha−1 crops to 13.3% for the 150 kg N ha−1 crops, and NDF from 15% to 11% for the same treatments.
The CP content did not respond to N supply, with an average of 9.1% across the treatments. This was also inconsistent with previous reports for forage brassica crops (Pelletier et al. Citation1976; Turk et al. Citation2009; Rugoho et al. Citation2010) and other forage crops (e.g. fodder beet; Turk Citation2010) in which CP increased with N supply. Turk et al. (Citation2009) reported a CP increase with N application, from 11% for the 0 kg N ha−1 crops to 13.6% when 150 kg N ha−1 was applied. The CP (or N concentration = CP/6.25) was higher for the leaves than stems (Pelletier et al. Citation1976) and therefore the proportion of the leaf and stem of total DM will determine the final nutritive value of the feed. The higher the stem component (), the lower the CP% (). Westwood & Mulcock (Citation2012) showed CP differed with kale cultivars, increasing in ascending order ‘Gruner,’ ‘Regal’ and ‘Kestrel; this is the same order in which the proportion of the leaf to total DM increases for the respective cultivars. These authors also showed that the nutritive values varied with brassica species, for example, swedes were high in ME compared with kale.
Conclusions
Dry matter yield increased four-fold to 25.5 t ha−1 when 500 kg N ha−1 was applied compared with the 0 kg N ha−1 crops, and N uptake five-fold to 425 kg ha−1. The inability of the crops receiving ≤100 kg N ha−1 to attain critical leaf area index and critical specific leaf nitrogen content resulted in lower DM yield compared with the higher N fertiliser application rates. The aNUE decreased from 111.6 kg DM kg−1 N for the 50 kg N ha−1 crops to 37.5 kg DM kg−1 N for the 500 kg N ha−1 crops. Nitrogen application rate had no systematic effect on the nutritive value of kale crops. The average CP% across all treatments (about 9.1%) was lower than the optimum requirements for non-lactating animals during winter. The SLN averaged 2.4 (2.1–2.7) g N m−2 leaf and was unaffected by N treatments. The absolute increase in DM yield with N supply decreased when N was applied at rates above 300 kg N ha−1. Under similar conditions to this study—optimal irrigation, base fertilisers, deep soils with high water-holding capacity and a 7-month growing season—it is recommended that N is applied at 300 kg N ha−1 to achieve a yield of about 22 t ha−1 and NUE of ≥51 kg DM kg−1 N applied.
Acknowledgements
This work was conducted through the Pastoral 21 Environment Programme (C10X1117; objective 7), jointly funded by MBIE, DairyNZ, Fonterra and Beef + Lamb New Zealand. We also thank Plant & Food Research employees who were involved in the experiment, particularly Mike George and Alexandre Michel.
References
- Adams CM, Scott WR, Wilson DR, Purves L 2005. Dry matter accumulation and phenological development of four brassica cultivars sown in Canterbury. Proceedings of the Agronomy Society of New Zealand 35: 1–18.
- Albayrak S, Yuksel O 2010. Effects of nitrogen fertilisation and harvest time on root yield and quality of Fodder beet (Beta vulgaris var. crassa Mansf.). Turkish Journal of Field Crops 15: 59–64.
- Asseng S, Turner NC, Keating BA 2001. Analysis of water- and nitrogen-use efficiency of wheat in a Mediterranean climate. Plant and Soil 233: 127–143.
- Baligar VC, Fageria NK, He ZL 2001. Nutrient use efficiency in plants. Communications in Soil Science and Plant Analysis 32: 921–950.
- Binder DL, Sander DH, Walters DT 2000. Maize response to time of nitrogen application as affected by level of nitrogen deficiency. Agronomy Journal 92: 1228–1236.
- Borrell AK, Hammer GL 2000. Nitrogen dynamics and the physiological basis of stay-green in sorghum. Crop Science 40: 1295–1307.
- Chakwizira E, Brown HE, de Ruiter JM 2014a. Radiation-use efficiency for forage kale crops grown under different nitrogen application rates. Grass and Forage Science. doi:10.1111/gfs.12150
- Chakwizira E, Fletcher AL, de Ruiter JM, Meenken ED, Maley S, Wilson DR 2009. Kale dry matter yield responses to nitrogen and phosphorus application. Proceedings of the Agronomy Society of New Zealand 39: 59–70.
- Chakwizira E, Fletcher AL, Zyskowski RF 2012. Validation of a forage brassica calculator for fertiliser forecasting system of kale and swede crops in New Zealand. Proceedings of the Agronomy Society of New Zealand 42: 11–22.
- Chakwizira E, Gillespie R, Maley S, George M, Michel A 2013. Water and nitrogen use efficiency of forage kale crops. Proceedings of the Agronomy Society of New Zealand 43: 1–16.
- Chakwizira E, Johnstone P, Fletcher AL, Meenken ED, de Ruiter JM, Brown HE 2015. Effects of nitrogen rate on nitrate-nitrogen accumulation in forage kale and rape crops. Grass and Forage Science 70: 268–282. 10.1111/gfs.12109
- Chakwizira E, Moot DJ, Scott WR, Fletcher AL, Maley S 2010. Establishment and dry matter production of kale supplied with banded or broadcast phosphorus (P) fertiliser. In: Edwards GR, Bryant RH eds. ‘Meeting the challenges for pasture based dairying’: Proceedings of the 4th Australasian Dairy Science Symposium. Christchurch, Lincoln University. Pp. 311–316.
- Chakwizira E, Moot DJ, Scott WR, Fletcher AL, Maley S 2011. Leaf development, radiation interception and radiation-use efficiency of kale crops supplied with different rates of banded or broadcast phosphorus fertiliser. Crop and Pasture Science 62: 840–847.
- Chakwizira E, de Ruiter JM, Maley S 2014b. Growth, nitrogen partitioning and nutritive value of fodder beet crops grown under different application rates of nitrogen fertiliser. New Zealand Journal of Agricultural Research 57: 75–89.
- Chapman HM, Bannister P 1994. Vegetative production and performance of Calluna vulgaris in New Zealand, with particular reference to Tongariro National Park. New Zealand Journal of Ecology 18: 109–121.
- Corson DC, Waghorn GC, Ulyatt MJ, Lee J 1999. NIRS: Forage anlysis an livestock feeding. Proceedings of the New Zealand Grassland Association 61: 127–132.
- Fletcher AL, Chakwizira E 2012. Nitrate accumulation in forage brassicas. New Zealand Journal of Agricultural Research 55: 413–419.
- Fletcher AL, Brown HE, Wilson DR, Maley S 2007. Forage production and nitrogen uptake of kale. In: Chapman DF, Clark DA, Macmillan KL, Nation DP eds. Proceedings of the 3rd Australasian Dairy Science Symposium. Melbourne, Australia, National Dairy Alliance. Pp. 335–342.
- Guillard K, Pietrzyk SW, Cassida KA, Wiedenhoeft MH, Hough RL, Barton BA et al. 1995. Seasonal nitrogen and carbohydrate partitioning in forage brassicas. Agronomy Journal 87: 562–569.
- Haynes RJ, Williams PH 1993. Nutrient cycling and soil fertility in the grazed pasture ecosystem. Advances in Agronomy 49: 119–199.
- Hewitt AE 2010. New Zealand soil classification. 3rd edition. Lincoln, Manaaki Whenua—Landcare Research Press. 136 p.
- Islam MR, Garcia SC 2012. Effects of sowing date and nitrogen fertilizer on forage yield, nitrogen- and water-use efficiency and nutritive value of an annual triple-crop complementary forage rotation. Grass and Forage Science 67: 96–110.
- Jamieson PD, Martin RJ, Francis GS 1995. Drought influence on grain yield of barley, wheat and maize. New Zealand Journal of Crop and Horticultural Science 23: 55–66.
- Martin RJ, Jamieson PD, Wilson DR, Francis GS 1992. Effects of soil moisture deficits on the yield and quality of ‘Russet Burbank’ potatoes. New Zealand Journal of Crop and Horticultural Science 20: 1–9.
- Massignam AM, Chapman SC, Hammer GL, Fukai S 2001. Canopy architecture and nitrogen utilisation for biomass production: the contrast between maize and sunflower. In: Rowe B, Donaghy D, Mendham N eds. ‘Science and technology: delivering results for agriculture?’ Proceedings of the 10th Australian Agronomy Conference, 29 January–1 February 2001, Hobart, Tasmania. Erina, NSW, Australian Society of Agronomy. http://www.regional.org.au/au/asa/2001/6/b/massignam.htm (accessed 6 March 2015).
- Massignam AM, Chapman SC, Hammer GL, Fukai S 2009. Physiological determinants of maize and sunflower grain yield as affected by nitrogen supply. Field Crops Research 113: 256–267.
- Moll RH, Kamprath EJ, Jackson WA 1982. Analysis and interpretation of factors which contribute to efficiency of nitrogen utilization. Agronomy Journal 74: 562–564.
- Monaghan RM, Smith LC, de Klein CAM 2013. The effectiveness of the nitrification inhibitor dicyandiamide (DCD) in reducing nitrate leaching and nitrous oxide emissions from a grazed winter forage crop in southern New Zealand. Agriculture, Ecosystems & Environment 175: 29–38.
- Monteith JL 1977. Climate and the efficiency of crop production in Britain. Philosophical Transaction of the Royal Society of London 281: 277–294.
- Mountier NS, Griggs JL, Oomen GAC 1966. Sources of error in advisory soil tests. New Zealand Journal of Agricultural Research 9: 328–338.
- Nichol WW 2007. Nutritional disorders of ruminants caused by consumption of pasture and fodder crops. In: Rattray PV, Brookes IM, Nicol AM eds. Pasture and supplements for grazing animals. Hamilton, New Zealand Society of Animal production. Occasional Publication No.1 4. Pp. 133–150.
- Nichol W, Westwood C, Dumbleton AJ, Amyes J 2003. Brassica wintering for dairy cows: overcoming the challenges. In: Kilgour D ed. The smart side. Canterbury, Lincoln University, South Island Dairy Event (SIDE). Pp. 154–172.
- NIWA 2014. Climate database—NIWA. http://www.cliflo.niwa.co.nz (accessed 28 February 2014).
- NRC 2001. Nutrient requirement of dairy cattle. 7th edition. Washington, DC, National Research Council, National Academy Press. 408 p.
- Pelletier G, Darisse JPF, Donefer E 1976. Effects of dates of seeding and levels of nitrogen fertilisation on yields, chemical composition and in vitro digestion of forage kale. Canadian Journal of Plant Science 56: 63–70.
- Pelletier G, Donefer E 1973. Nutritive value of fresh and dried marrow-stem kale harvested at two different periods. Canadian Journal of Animal Science 53: 257–263.
- Rugoho I, Gibbs SJ, Bryant RH, Edwards GR 2010. Intake and feeding behaviour of dairy cows grazing kale and grass at low and high allowances during winter. In: Edwards GR, Bryant RH eds. ‘Meeting the challenges for pasture based dairying’: Proceedings of the 4th Australasian Dairy Science Symposium. Christchurch, Lincoln University. Pp. 317–320.
- Rugoho I, Gibbs SJ, Edwards GR 2014. Dry matter intake and body condition score gain of dairy cows offered kale and grass. New Zealand Journal of Agricultural Research 57: 110–121.
- Salmon RW, Dumbleton AJ 2006. The effect of seed treatment and depth of sowing on forage brassica crop establishment in no-tillage situation. Proceeding of the New Zealand Grassland Association 68: 211–214.
- Sinclair TR, Horie T 1989. Leaf nitrogen, photosynthesis and crop radiation use efficiency. A review. Crop Science 29: 90–98.
- Singh U, Ladha JK, Castillo EG, Punzalan G, Tirol-Padre A, Duqueza M 1998. Genotypic variation in nitrogen use efficiency in medium- and long-duration rice. Field Crops Research 58: 35–53.
- Smith LC, de Klein CAM, Monaghan RM, Catto WD 2008. The effectiveness of dicyandiamide in reducing nitrous oxide emissions from a cattle-grazed, winter forage crop in Southland, New Zealand. Australian Journal of Experimental Agriculture 48: 160–164.
- Smith LC, Orchiston T, Monaghan RM 2012. The effectiveness of the nitrification inhibitor dicyandiamide (DCD) for mitigating nitrogen leaching losses from a winter grazed forage crop on a free draining soil in northern Southland. Proceedings of the New Zealand Grassland Association 74: 39–44.
- Soil Survey Staff 1998. Keys to soil taxonomy. USDA-NRCS. 8th edition. Washington, DC, United Sates Government Print Office. 328 p. http://www.itc.nl/~rossiter/Docs/NRCS/RevKeysSoilTax8_02.pdf (accessed 22 June 2014).
- Stevens DR, Carruthers AY 2008. Can nitrogen fertiliser applied before sowing increase brassica yields in a dry environment? Proceedings of the New Zealand Grassland Association 70: 31–36.
- Turk M 2010. Effects of fertilisation on root yield and quality of fodder beet (Beta vulgaris var. Crassa mansf.). Bulgarian Journal of Agricultural Science 16: 212–219.
- Turk M, Albayrak S, Balabanli C, Yuksel O 2009. Effects of fertilization on root and leaf yields and quality of forage turnip (Brassica rapa L.). Journal of Food Agriculture & Environment 7: 339–342.
- Westwood CT, Cutts M, Russell R, O’Brien K 2014. Effect of timing of harvest on nutritive value of four cultivars of kale (Brassica oleracea L. var. acephala). Proceedings of the New Zealand Grassland Association 76: 135–139.
- Westwood CT, Mulcock H 2012. Nutritional evaluation of five species of forage brassica. Proceedings of the New Zealand Grassland Association 74: 31–38.
- Wilson DR, Maley S 2006. Nitrogen balance for kale. ‘Groundbreaking Stuff’. In: Turner N, Acuna T eds. Proceedings of the 13th Australian Agronomy Conference. Perth, Western Australia, 10–14 September 2006. http://www.regional.org.au/au/asa/2006/poster/systems/4550_wilsondr.htm (accessed 24 February 2014)
- Wilson DR, Reid JB, Zyskowski RF, Maley S, Pearson AJ, Armstrong SD et al. 2006. Forecasting fertiliser requirements of forage brassica crops. Proceedings of the New Zealand Grassland Association 68: 205–210.
- Zemenchik RA, Albrecht KA 2002. Nitrogen use efficiency and apparent nitrogen recovery of Kentucky bluegrass, smooth Bromegrass, and orchardgrass. Agronomy Journal 94: 421–428.