
 ?Mathematical formulae have been encoded as MathML and are displayed in this HTML version using MathJax in order to improve their display. Uncheck the box to turn MathJax off. This feature requires Javascript. Click on a formula to zoom.
ABSTRACT
A short-term, dairy cow, grazing experiment was conducted in late-lactation (autumn) to determine the effect of fodder beet (FB) and maize silage supplementation on dry matter and nitrogen (N) intake, urinary N excretion and milk solids (MS; milk fat + milk protein) production. Seventy-two multiparous, lactating (224 ± 20.0 DIM; mean ± SD) Holstein-Friesian cows were randomly assigned (n = 24 per treatment; 8 per replicate) to one of three groups. Control animals were offered pasture (11 kg DM/cow/day) with maize silage (4 kg DM/cow/day; ‘Maize’). The other two groups were either offered pasture (11 kg DM/cow/day) with 25% FB (4 kg DM/cow/day; ‘FB25’) or pasture (9 kg DM/cow/day) with 40% FB (6 kg DM/cow/day; ‘FB40’). At the same supplement DM intake, diets containing maize silage or grazed FB had similar urinary nitrogen (UN) concentrations, but FB increased milk solids (MS) production. At 40% FB inclusion UN excretion was reduced but this came at the expense of MS production. Farmers need to exhibit caution when feeding fodder beet to lactating dairy cows to minimise the risk of adverse animal health effects. Feeding fodder beet allocations high enough to achieve significant environmental benefit is likely to compromise animal health and milk production.
Introduction
Urinary nitrogen (UN) excreted by grazing livestock is one of the New Zealand pastoral industry’s most significant environmental pollutants. This is because nitrate () derived from UN contributes to ground and surface water contamination (Di and Cameron Citation2002). High-quality temperate forages, such as perennial ryegrass and white clover in pastures, have metabolisable energy (ME) concentrations typically greater than 11.5 MJ/kg DM and crude protein (CP) content of up to 30% (Waghorn et al. Citation2007; Dalley and Gardner Citation2012; Dalley and Geddes Citation2012). This high protein diet results in an excess of nitrogen (N) relative to animal requirements, and excretion of excess N in urine results in increased environmental pollution.
Urinary N is strongly correlated with N intake, with several studies (Castillo et al. Citation2000; Kebreab et al. Citation2001) and meta-analysis of published data (Huhtanen and Hristov Citation2009; Kebreab et al. Citation2010) reporting lower total UN excretion when dietary N content is lower. Urine deposited on pasture in late summer, autumn and winter, which immediately precede or coincide with the main period of drainage in New Zealand pastoral systems (Ledgard and Menneer Citation2005), is more readily leached from below the root zone than urine deposited in spring and early summer (Di et al. Citation1999; Snow et al. Citation2011), therefore these periods have been the focus of research to reduce UN excretion.
One mitigation strategy for reducing the amount of N from animals lost to the environment is increasing the efficiency of use of nitrogen by manipulating the diet. During late summer and autumn in many dairy regions of New Zealand feed demand often exceeds pasture growth requiring supplementary feeding to meet herd demand. One approach is to offer feed supplements with a lower N and higher carbohydrate content (Kolver et al. Citation2001; Firkins and Reynolds Citation2005; de Ruiter et al. Citation2018); however, these feeds must be profitably integrated into the grazing system (Clarke et al. Citation2007) and, if used in autumn (Ledgard et al. Citation1999; Vogeler et al. Citation2013) to increase lactation length (Kolver et al. Citation2001), the risk to N leaching loss needs to be managed (Roche et al. Citation2016).
Feed intake modelling has identified maize silage and fodder beet (FB) as supplementary feeds to pasture with the potential to reduce UN while maintaining milk production in late lactation (Gregorini et al. Citation2015; Gregorini et al. Citation2016). Although FB has been included in diets based on conserved feeds for lactating and non-lactating (over winter in seasonal dairying) cows for decades (Castle et al. Citation1961; Roberts Citation1987; Ferris et al. Citation2003), their use in New Zealand for lactating cow diets based on fresh pasture is relatively recent (Gibbs Citation2014; Gibbs et al. Citation2015). Interest has grown in using FB as a grazing option instead of, or in addition to, maize silage for late lactation feeding of dairy cattle, especially in rainfed regions in New Zealand. The high concentration of readily fermentable carbohydrate and low N content in FB bulbs (Dalley et al. Citation2017; de Ruiter et al. Citation2018) offers a higher digestibility feed than maize silage.
Thus, the objective of this experiment was to measure the impact of substituting 4 kg DM/cow/day maize silage with 4 or 6 kg DM/cow/day FB on intake, milk production, N excretion and blood parameters of dairy cows grazing perennial ryegrass pastures in late lactation.
Materials and methods
Experimental design and site description
The trial was located at DairyNZ Scott Farm, Waikato, New Zealand (37°46′S, 175°22′E), on well drained Te Rapa Humic silt loam, brown subsoil variant [Humose Orthic Podzol (Hewitt Citation2010), Humic Haplothod, USDA Soil Classification (Soil Survey Staff Citation2014)]. This soil typically comprises 30–40 cm of peat on volcanogenic alluvium (Lowe Citation2010). The summer and winter mean daily temperatures in the region are 20–25 and 0–8°C, respectively, with an average annual rainfall of approximately 1100 mm (NIWA Citation2019).
The grazing trial was an incomplete factorial design with 3 treatments (28 animals/treatment) and 3 replicates (8 animals per replicate). Control animals were offered a diet of pasture, above a target residual of 1600 kg DM/ha, (11 kg DM/cow/day) with maize silage (4 kg DM/cow/day; ‘Maize’). The remaining two groups were transitioned onto a FB diet, either offered pasture (11 kg DM/cow/day) with 25% FB (4 kg DM/cow/day; ‘FB25’) or pasture (9 kg DM/cow/day) with 40% FB (6 kg DM/cow/day; ‘FB40’).
On 14 September 2016, a total of 30 soil samples to 30 cm depth were taken within the trial area and tested for general soil fertility status. Results indicated that all basic nutrients, except for potassium (K) were within acceptable ranges for crop production ().
Table 1. The initial soil fertility status for the fodder beet trial site prior to basal fertiliser applications.
Weather data (rainfall, air temperature and solar radiation) were collected from the nearest NIWA Ruakura weather station (37°46.54′S, 175°18.30′E).
Crop and soil management
On 23 September 2016, three 0.5 ha (50 m × 100 m) adjacent trial paddocks were sprayed out with 4 L/ha of WeedMaster® TS470 [active ingredient (AI): glyphosate], 100 ml/ha of Nail® (AI: cafentrazone-ethyl) and 200 ml/ha of Pulse® Penetrant in water at 200 L/ha. When senescence had occurred, the area was cultivated to achieve a seedbed suitable for FB production, which involved a single pass with a mouldboard plough (to 15 cm depth), power harrow and ‘Cambridge’ roller over a 4-day period. Immediately before power harrowing, a surface-applied basal fertiliser application was made, consisting of lime at 4 t/ha, Muriate of Potash at 500 kg/ha, AgSalt at 150 kg/ha and Borate 46 at 30 kg/ha. An additional herbicide was applied in late October to control re-emerging weeds, which consisted of 1.5 L/ha of Glyphosate 510, 100 ml/ha of Nail® and 100 ml/ha of Pulse® Penetrant.
On 8 November 2016 ‘Vermon’ FB seeds were sown with a 3-m wide precision planter at 90,000 seeds/ha into 50 cm wide rows and 20 cm inter-row spacing’s. An intensive agrichemical spray regime was adopted thereafter to control weed and pest infestation (details given in ).
Table 2. Details of agrichemical applications to the fodder beet crop used in the fodder beet grazing trial at DairyNZ’s Scott Farm, Hamilton 2016/17.
Nitrogen fertiliser was applied to the FB crops on two separate occasions, once on 20 December 2017 at 100 kg N/ha as urea (Sustain N) and again on 25 January 2017 at 53 kg N/ha as a foliar application (N rich Liquid Urea, 19%N).
Fodder beet measurements
Immediately before grazing commenced, and once per week during the grazing period, FB yield assessments were performed to ensure animals were allocated the correct amount of feed. This involved removing all FB plants from two side-by-side rows within a 4-m length, at two random locations within each plot. Whole plants were then weighed in situ to determine total fresh weight. The leaf and petiole were cut off all the plants and all the bulbs reweighed to calculate the leaf:bulb ratio. A representative range of four leaf + petiole and four bulbs were retained for analysis. Partitioned subsample fresh weights were determined, then chopped bulb and leaf samples were oven-dried at 95°C to constant weight to determine DM content.
Animal management
Approval for animal experimentation was granted by the Ruakura Animal Ethics Committee under application #14133. During late lactation (March 2017), 72 (+8 spares) multiparous, lactating (224 ± 20.0 DIM; mean ± SD) Holstein-Friesian cows weighing 509 ± 32.4 (SEM) kg with an average BCS of 3.9 ± 0.18 (SEM), were randomly assigned (n = 24 per treatment; 8 per replicate) to one of three supplementary feeding groups.
The experiment ran from 2 March 2017 to 2 April 2017, including a seven-day covariate period, a 17-day adaptation period and a seven-day measurement period. Prior to the start of the experiment, all cows grazed in the same paddock and were offered perennial ryegrass/white clover pasture (∼15 kg DM/cow/day). The perennial pastures were 7–9 years old and several different cultivars (Alto/Arrow and Bronsyn). Commencing on the 20th February grazing of whole and part-paddocks was staggered with the aim of achieving consistent pasture covers within pre-graze target ranges as the cows moved through the paddocks during the adaptation and measurement periods.
Diet adaptation
During the adaptation period the replicates of each treatment grazed together, but the Maize and FB cows grazed separately to allow adaptation to their respective supplements. Daily herbage allocation was determined from pre-graze herbage mass assessments using a Rising Plate Meter (RPM, Jenquip, Fielding, New Zealand) and the manufacturers equation for leafy pastures (compressed height × 140 + 500) to convert pasture height (0.5 cm) to pasture mass (kg DM/ha). Cows received a new allocation of pasture every 24 hrs, immediately after the morning milking. Maize silage was offered to cows in trailers in the pasture paddock and introduced over a four-day period, starting at 2 kg DM/cow/day.
Table 3. Composition of pre- and post-grazed pasture, maize silage, fodder beet leaf and fodder beet bulb offered to lactating cows.
Cows on the FB diets were adapted to FB over a 17-day period starting with 0.5 kg DM/cow/day FB and 4 kg DM/cow/day of pasture silage (introduced on day1 of the adaptation period). Fodder beet allocation was increased by no more than 1 kg DM/cow/day until the final allocation was achieved. Fodder beet replaced pasture silage during the adaptation period such that silage was completely removed from the diet by the time the cows reached full FB allocation. Cows were observed each day to ensure all animals were eating fodder beet before the allocation was increased. To reduce the risk of acidosis during the adaptation period the pasture silage was offered 2 h prior to the fodder beet each morning. During the first 10 days, whole fodder beet plants were hand harvested and offered to the cows in their pasture paddock following their daily allocation of pasture silage. From Day 11 onwards the fodder beet cows grazed the fodder beet in situ (by break-feeding) and pasture silage was offered in feed trolleys in the fodder beet paddock. FB25 and FB40 herds grazed in separate fodder beet paddocks. From Day 17 the animals were managed in their replicate herds.
Pasture and supplement allocation
During the measurement period (27 March 2017–2 April 2017) each replicate group was randomly allocated to a 0.5 ha pasture paddock. Pasture paddocks, defined as permanently fenced areas, were divided into three longitudinal strips using temporary fencing materials, and each treatment was randomly assigned to one pasture strip within each paddock. All groups had access to water from a portable trough in their pasture allocation. All treatments were back-fenced to prevent grazing of the previous day’s allocation. Each replicate grazed two pasture paddocks during the measurement period. The Maize treatment received 100% of their 24–hour pasture allocation following the afternoon milking (approx. 1530 h), with the maize silage offered in trailers in the pasture break after the following morning milking (approx. 0800 h). Cows offered FB received 80% of the daily pasture allocation following the afternoon milking and the remaining 20% following the morning milking.
FB40 cows were moved to the FB paddock at 1000 h and FB25 at 1100 h each day. Treatment groups within each replicate paddock were separated by an electric fence and had access to water from a portable trough in their allocation area. Both treatment groups remained on the fodder beet paddock until the afternoon milking (approx. 1400 h). Fodder beet allocations were not back-fenced but any uneaten bulb was collected, weighed and subsampled for DM content when the cows left the FB break each day. Fodder beet DM intake for each group was estimated using measurements of crop yield pre-grazing, the residual FB that was collected and the area allocated each day. There were no refusals of maize silage by the Maize treatment group.
Group herbage DM intake (DMI) during the measurement period was estimated using measurements of pre- and post-grazing herbage mass with a calibrated Rising Plate Meter (RPM, Jenquip, Fielding, New Zealand). In each grazing break 100 RPM readings were taken in a ‘W’ pattern before and after grazing. The RPM readings were calibrated with 0.1 m2 quadrat harvests selected to represent the range in herbage mass of each paddock. Sixteen quadrats were measured with a single RPM measurement and harvested to ground level in each paddock, both before and after grazing and used to establish a calibration equation by linear regression.
The apparent herbage DMI was estimated by the following equation:(1)
(1) Pasture composition and quality was determined three times (days 2, 4 and 6) during the measurement period by harvesting snip samples, using hand shears, to ground level, pre- and post-grazing, at regular intervals along a diagonal transect in each break and subsampling the ∼500 g bulk sample for (a) DM determination by oven drying triplicate ∼100 g samples at 95°C for 48 h; (b) botanical composition by separating a ∼70 g sample into: perennial ryegrass, white clover, broadleaf weeds, other grass species and dead material, and oven drying the fractions at 95°C for 48 h; and (c) nutritive value by oven drying one mixed sample of ∼150 g at 60°C for 48 h, following rinsing with cold water to remove soil contamination. The mixed sample was analysed by Near Infrared Reflectance Spectroscopy (method cit. Hills Laboratories, Hamilton) for N (%DM), neutral detergent fibre (NDF, %DM) and digestible organic matter (DOMD, %DM). Soluble sugars were estimated by NIR using a calibration based on an 80:20 ethanol:water extraction and calorimetric determination and starch also by NIR using a calibration based on enzymatic hydrolysis of starch. Metabolisable energy (ME, MJ/kg DM) was calculated from DOMD using AFRC (Citation1992) and minerals (Mg, Ca, P g/kg DM) were determined by inductively coupled plasma optical emission spectra (ICP-OES) following nitric acid/hydrogen peroxide digestion. Subsamples of maize silage offered and FB components (leaf and bulb) were collected on days 2, 3 and 4 of the measurement period and analysed for DM and nutritive value as above.
The apparent herbage N intake in the diet was estimated by the following equation:(2)
(2) The N content of the herbage consumed (N intake %) was estimated by the following equation:
(3)
(3) Where Yield = herbage mass in kg DM/ha.
The herbage selection differential index for N was calculated by the following equation, after McKenzie et al. (Citation2003), as an indicator of cow preference for or against N in the diet:(4)
(4) Where Yield = herbage mass in kg DM/ha.
Similar equations were used to estimate the apparent herbage ME intake (MEI; MJ ME/cow/day), the ME content of the herbage consumed (MJ ME/kg DM) and the ME selection differential index.
Total daily N and energy intake for each treatment group were calculated from estimated herbage, FB and maize silage intakes.
Drinking water intake for each herd was measured by flow metres (model M20, Arad Group, Israel) tested for accuracy and attached to portable troughs placed in each allocation area of both the pasture and fodder beet paddocks.
Animal production measurements
The cows were milked daily at approximately 0730 and 1430 h throughout the experiment. Individual cow milk yields were automatically recorded each milking (DeLaval Alpro Herd Management System, DeLaval, Tumba, Sweden). Proportional milk composition (fat%, protein%, lactose%) was analysed on individual afternoon and morning samples on three consecutive days using a Milkoscan™ milk analyser (Foss Electric, Hillerod, Denmark). The cows were weighed twice and scored for body condition twice during this period (unfasted, after morning milking) by the same DairyNZ Certified Body Condition Scorer, using the 10-point scale (Roche et al. Citation2009).
Nitrogen excretion measurements
Immediately before the morning and afternoon milking on days 3 and 5 of the measurement period samples of urine, milk, faeces, and blood (day 3 only) were collected from individual cows. Urine samples were taken midstream after manual stimulation of the vulva, acidified below pH 4 with concentrated 50% hydrochloric acid to prevent N volatilisation, and then frozen at −20°C until analysed. Faeces samples were collected by rectal stimulation or as the animal defecated when entering the sampling race. Urine samples were bulked per cow by time with AM and PM kept separate and then re-frozen prior to analysis. Individual cow faeces samples were bulked by Rep at each sampling date and time i.e. AM and PM samples kept separate. Representative subsamples of milk from each cow at each milking were prepared for milk urea nitrogen determination by centrifugation for 10 minutes at 4000 g and 4°C, before skimming to remove fat. Milk urea (MU) was determined from the skimmed milk sample by the urease enzymatic method, then converted to milk urea N (MUN) by multiplying MU by a factor of 0.467. Blood samples were collected from the coccygeal vein or artery using 10 mL EDTA blood collection tubes (BD Vacutainer®, BD, Belliver Industrial Estate, Plymouth, United Kingdom). Blood samples were placed on ice, then centrifuged at 3000 × g at 4°C for 12 min, and separated plasma stored on ice at −20°C until analysis for plasma urea N (by Kinetic UV assay), minerals (Ca, P, Mg, Na, K, Cl) and indicators of metabolic stress [creatinine (Cr), total protein (TP), albumin (Alb), globulin (Glob), betahydroxybutyrate (BHBA), glutamate dehydrogenase (GLDH), gamma glutamyl transferase (GGT), aspartate aminotransferase (AST)].
Composite faeces samples were used for determination of N (Leco total combustion method; AOAC method 968.06; Horwitz and Latimer Citation2005) and DM (95°C for 48 h). Urine composite samples were used for determination of N (Leco total combustion) and creatinine (Cr; using the Jaffe reaction; Sigma diagnostics procedure #558). Blood minerals and indicators of metabolic stress were determined by Gribbles Veterinary Pathology (Hamilton, New Zealand) using analytical kits from Roche Diagnostics.
To allow for hydration correction and variation in urine volume during sample collection urinary N concentration (g/L) was divided by urine creatinine concentration (mmol/L) measured in the same urine sample to generate a creatinine corrected urinary N concentration (g N/mmol creatinine).
Statistical analysis
The analysis of variance used each herd and paddock combination as the experimental unit, including blocking factors of Replicate Herd, Herd within Replicate and Cow within Herd. Blood urea N analysis and spot sampling of urine and faeces included a repeated measure structure for the morning and afternoon measurements and hence an additional blocking factor was Time within Cow. Milk data were analysed by ANCOVA, using the pre-treatment period data as the covariate. Differences in data are considered significant when P < 0.05 and declared marginally significant when P < 0.10. The RPM calibrations were analysed separately using linear regression including paddock and pre- or post-grazing as terms in the model. This confirmed significant differences in the intercept and slope parameters, so individual paddock pre- and post-grazing calibrations were applied to the RPM measurements in each break.
Results
Rainfall and air temperature
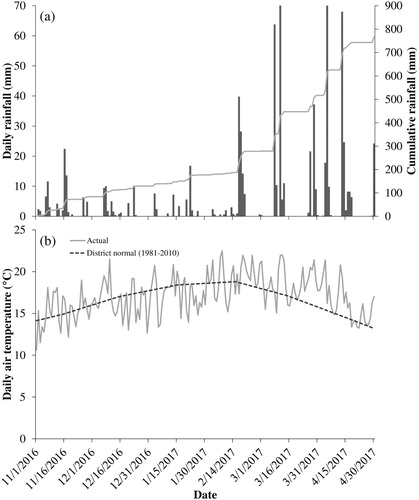
Daily and cumulative rainfall data are presented in A. Approximately 770 mm of rain fell during the months of November 2016 to April 2017. December and January were drier than normal with 31–53 mm less rain than the long term (1981–2010) monthly average. Conditions were then particularly wet during March and April, with more than 230 mm of rainfall recorded in each month (approximately 3-fold higher than long term averages). Daily mean air temperatures were similar to long term district averages from November to February (B) but were 1.5–1.7°C warmer during March and April.
Figure 1. Weather data at the DairyNZ Scott Farm fodder beet grazing trial for the period of establishment, growth and grazing of fodder beet (early November 2016 to late April 2017). A. Daily rainfall and cumulative rainfall; B. daily average air temperature and 30-year district normal temperature.
Pastures and supplement nutritive characteristics
The pasture on offer to the cows (pre-graze to ground level) during the experiment comprised 31 ± 3.2% perennial ryegrass, 27 ± 3.8% white clover, 14 ± 2.5% other grasses (including witch grass (Panicum capillare L), tall fescue (Festuca arundinacea) and summer grass (Digitaria sanguinalis L)), 10 ± 2.7% weeds and 18 ± 2.1% dead material. Pasture was low in DM () and moderate in N and ME. Selection indices for N and ME were positive (1.13 and 1.15, respectively) resulting in cows consuming pasture with an average N% of 3.65 and ME of 11.5 MJ/kg DM. In contrast, the selection index for NDF was negative (0.85) resulting in cows consuming pasture with an average of 39.8% NDF.
The maize silage and FB bulb were similar in N content () but as expected differed in soluble sugars and starch with the FB bulb containing 69% soluble sugar and maize silage 35.5% starch. The ME contents of maize silage and fodder beet leaf were similar but less than that of the fodder beet bulb ().
Table 4. Herbage mass, herbage, supplement, nitrogen, energy, phosphorus and water intake from herds of 8 cows (3 replicates per treatment) offered maize silage or fodder beet in the Waikato in summer 2017.
Herbage, supplement, and water intake
No significant difference occurred in the pre- and post-grazing herbage mass between the treatment groups (). The post-grazing residual height was within the recommended range (3.5–4.0 compressed cm) for well grazed pastures however the estimated pasture mass was significantly higher than the 1600 kg DM/ha industry target (Lee et al. Citation2011). The high proportions of dead material (18%) and weeds (10%) below the grazing horizon were likely significant contributors to the high pre- and post-grazing pasture masses.
Daily herbage intake did not differ between the Maize and FB25 treatments but there was a trend (p = 0.066; ) for the FB40 treatment cows to consume less herbage DM. FB40 cows consumed significantly more FB than the FB25 cows (p < 0.001; ). The FB25 cows consumed close to their target allocation with 24% of their diet as FB, but FB only comprised 35% of the FB40 diet. No significant difference was found in the total DM intake (DMI) between the treatment groups (p > 0.05; ).
Table 5. Milk production and composition data from replicated herds of 8 cows grazing perennial ryegrass pasture and offered maize silage or fodder beet in the Waikato in autumn 2017.
Nitrogen, ME, phosphorus or forage water intake did not differ between the treatment groups but cows offered FB had a higher soluble sugar and lower starch intake than the Maize treatment cows (p < 0.001; ). No significant differences occurred in forage or trough water intakes between the treatment groups.
Cow liveweight, body condition and milk production
Neither cow liveweight nor body condition score differed between treatments, and no significant changes (p > 0.05) were observed during the short measurement period (data not presented). There was a trend for FB40 cows to produce less milk (volume) than the Maize and FB25 cows (p = 0.08; ) but milk solids production was greater for cows on the FB25 treatment than the Maize and FB40 treatments. Milk fat concentration was lowest for the FB40 treatment and milk protein lowest for the Maize treatment ().
Blood, faecal and urinary nitrogen
Increasing the proportion of FB in the diet significantly (p < 0.05) decreased BUN in both morning and afternoon samples () and a similar trend (p = 0.07) was observed with MUN. On all diets BUN and MUN concentrations in the afternoon were greater (p < 0.001) than those in the morning (). Faecal N concentration was higher in afternoon samples compared with morning samples (p < 0.001) and there was a trend (p = 0.08) for higher faecal N concentrations in cows consuming FB. At both time periods faecal DM content was higher for the FB40 treatment and the DM content declined in the afternoon (). Urinary N concentration did not differ between Maize and FB25 treatments but was lower for the FB40 treatment. When corrected for urinary creatinine concentration, UN excretion was lowest in the FB40 treatment at both the morning and afternoon sampling periods.
Table 6. Mean morning and afternoon blood, milk, faecal and urinary nitrogen (UN) concentrations, faecal dry matter content, urinary creatinine concentrations and creatinine corrected urinary nitrogen concentration from replicated herds of 8 cows grazing perennial ryegrass pasture and offered maize silage or fodder beet in the Waikato in autumn 2017.
Plasma P concentrations were higher in afternoon than morning samples (p < 0.05; ) and there was a trend (p < 0.10) for plasma P concentration on the FB40 treatment to be lower than the Maize and FB25 treatments at both time periods. Treatment did not affect plasma Ca concentration but concentrations in all treatments did increase during the day. Cows consuming FB had a higher plasma Mg concentration, but concentrations did not differ between sampling periods. GLDH concentration was lowest (p < 0.05; ) in cows on the FB25 treatment at both time periods. There was a significant time x treatment interaction in plasma BHBA concentrations with plasma from FB25 and FB40 having higher concentrations in the afternoon sample but no difference between treatments in the morning. The BHBA concentration for the Maize treatment declined by 50% between the morning and afternoon sample while concentrations from cows offered FB increased by 280% (). There were no significant differences in any of the other blood metabolites measured (results not reported).
Table 7. Mean daily plasma phosphorus, calcium, magnesium, glutamate dehydrogenase (GLDH) and betahydroxybutyrate (BHBA) from replicated herds of 8 cows grazing perennial ryegrass pasture and offered maize silage or fodder beet in the Waikato in summer 2017.
Discussion
The lack of statistical significance in N intake between the treatment groups, despite Maize and FB25 cows consuming an estimated 60–70 g N/cow more per day than FB40 cows, suggests other factors contributed to the reduction in BUN, UN and MUN concentrations observed for cows offered 40% FB. FB40 cows consumed a diet with a SSS:N ratio (kg SSS intake/kg N intake) of 9.3 compared with 6.2–6.3 for Maize and FB25 cows. Stergiadis et al. (Citation2015) reported improved N utilisation, reduced N outputs and a shift in N excretion towards faeces rather than urine when pasture higher in fermentable energy and lower in N was offered to non-lactating dairy cows. The high soluble sugar and low N content of the FB bulb provides a significant opportunity for using fodder beet to decrease urinary N leaching risk.
Treatment average UN concentrations ranged from 2.5 (FB40) to 3.6 g/L (Maize) and were lower than those reported by Waghorn et al. (Citation2018, Citation2019). Waghorn et al. (Citation2018) reported UN ranges of 4.5–5.4 g/L and Waghorn et al. (Citation2019) ranges of 6.0–8.6 g/L. In the studies of Waghorn et al. (Citation2018, Citation2019) the concentrations reported were the average of 24 hr urine collections in contrast to the current study where the concentrations were determined from spot samples collected prior to the morning and afternoon milkings.
Waghorn et al. (Citation2018, Citation2019) reported a significant reduction in urinary N excretion as the proportion of FB in the diet increased and this was associated with a decline in N intake. Other studies (Castillo et al. Citation2000; Kebreab et al. Citation2001) and meta-analysis of published data (Huhtanen and Hristov Citation2009; Kebreab et al. Citation2010) have also reported lower total UN excretion with a lower dietary protein content.
Blood, milk, and faecal N concentrations were higher in samples collected in the afternoon but there was no time trend for UN concentration. The FB herds were offered 80% of their daily pasture allocation following the afternoon milking with the remainder of the pasture and supplement (FB) being offered following morning milking. Maize cows were offered 100% of their pasture allocation following the afternoon milking and the maize silage after the morning milking. This feed allocation regime most likely resulted in more of the higher N feed (pasture) being consumed prior to morning milking. Nitrogen is utilised by ruminants through a combination of metabolic processes occurring in the rumen microbes and their host, the animal. The fate of dietary N in the ruminant involves many pools and processes and interactions between nitrogen and energy metabolism (Pacheco and Waghorn Citation2008). As a result N moves into different pools (urine, faeces, blood, milk) at different rates providing opportunities to develop dairy systems utilising timing of feeding, duration-controlled grazing and strategic standoff to manage N returns to soil.
Urine deposited on pasture in late summer, autumn and winter has a higher risk of leaching below the root zone than urine deposited in spring and early summer because it immediately precedes or coincides with the main drainage period in New Zealand pastoral systems and is deposited when pasture growth is slower (Di et al. Citation1999; Ledgard and Menneer Citation2005; Snow et al. Citation2011). Based on this hypothesis and the UN concentration results of the current experiment there are no environmental benefits from a urinary N loading perspective in substituting maize silage for fodder beet at the same DM allocation, however offering higher allocations of fodder beet is a potential mitigation strategy for reducing N leaching losses from grazed dairy systems in New Zealand. Given no difference between the Maize and FB25 treatments in nitrogen parameters a similar environmental outcome to the FB40 treatment may be achieved by offering higher levels of maize silage than the current experiment. In regions with reliable maize yields this would be a lower risk approach than switching to fodder beet which has inherent agronomic (weed & pest control; soil fertility; Matthew et al. Citation2011) and animal feeding (acidosis; Waghorn et al. Citation2018, Citation2019) risks.
FB25 cows produced milk with the highest milk fat and protein percentage, resulting in more milk solids than the Maize and FB40 treatments (). An unexpected result was the lower MS production of the FB40 treatment compared with the FB25 treatment. A lower milk volume and milk fat concentration were the major contributors to the poorer milk solids production in the FB40 treatment. Fleming et al. (Citation2018) observed no difference in milk solids production relative to the control treatment (pasture only) when cows were offered 4 kg DM/cow/day as FB bulb in early lactation and milk from the FB cows had a higher fat content. In contrast, Huhtanen (Citation1987) supplemented cows in early lactation consuming pasture silage with 6 kg DM/cow/day of barley (Ba) or molassed sugar beet pulp (SBP) or 2 kg DM/cow/day molasses (Mo) and observed a lower milk fat concentration with the SBP and no difference in fat corrected milk yield between the treatments. The FB40 cows in the current experiment were consuming 4 kg soluble sugar/cow/day which is equivalent to 4.8 kg molasses/cow/day. Offering 2 kg DM/cow/day molasses to cows in early lactation significantly reduced milk, fat corrected milk, milk fat and protein yields (Huhtanen Citation1987). International studies have reported minimal improvement in milk yield when FB is fed alongside various levels of protein (Fisher et al. Citation1994) or concentrates (Ferris et al. Citation2003) despite the FB containing more metabolisable energy. Here there was no statistically significant difference in estimated ME intake between the treatment groups although numerically the FB25 cows were consuming 12 MJ ME/cow/day more than the Maize and FB40 cows. Assuming a requirement of 84 MJ ME/kg MS (DairyNZ Citation2017) the 12 MJ, if all used for milk production, equates to 0.14 kg MS, similar to the 0.08–0.12 kg MS/cow/day difference between the FB25 and Maize or FB40 treatments respectively.
The diets were designed to offer the same amount of total DM to each treatment by reducing the pasture allocation for the FB40 animals and this objective was achieved with no significant difference in total DMI between the treatments (). However, the FB40 cows did not consume all the FB on offer and, while no animals were treated for clinical acidosis, on occasions individual animals exhibited signs of sub-clinical acidosis (lethargy, reduced intake). Waghorn et al. (Citation2019) reported that substitution of ryegrass-based pasture with up to 45% FB had no detrimental effect on the health or production of cows in late lactation, but 60% FB (DM basis) with bulbs that were chopped into halves or quarters resulted in clinical acidosis in two of four cows. Low levels of FB substitution (23% FB) increased DM digestibility (Waghorn et al. Citation2019) but higher intakes (45% FB) caused a substantial reduction in aNDF and N digestibility, suggesting an alteration in rumen function. The recommendation of Waghorn et al. (Citation2019) was to proceed with caution when feeding an excess of 40% of FB to dairy cows with pasture, especially at grazing, because some may eat more than others with a risk of acidosis. The risks of acidosis associated with feeding readily fermentable carbohydrates to ruminants have been extensively researched, and intermittent feeding, such as once daily feeding, increases the risk (Krause and Oetzel Citation2006).
The hypothesis that some cows were experiencing sub-clinical acidosis in the current experiment is supported by the reduction in milk fat concentration in the FB40 treatment. While there is no typical clinical sign of sub-acute rumen acidosis (SARA) it is associated with feed intake depression, fluctuations in feed intake, reduced diet digestibility, reduced milk yield and reduced milk fat percent as a result of changes in rumen fermentation. Acetic, butyric and propionic acids are the most important energy substrates produced during rumen fermentation with acetic and butyric acids being the precursors for milk fat concentration, while propionic acid contributes to milk volume, milk protein concentration and adipose tissue (Stockdale et al. Citation1997). Microbial activity in the rumen can be manipulated by diet to be relatively dominated by an acetic type fermentation or a propionic acid-type fermentation, thereby influencing milk composition accordingly. Generally, a high forage diet will result in a fermentation dominated by acetic acid, while the addition of cereal grain or high sugar supplements to the diet will increase propionic and butyric acid production relative to acetic acid production (Sutton et al. Citation2003). Pacheco et al. (Citation2019) reported that increasing the proportion of FB in the diet of lactating dairy cows decreased the proportion of acetate and increased the proportion of propionate, butyrate and other short chain fatty acids.
The underlying factor of most importance in relation to maintenance of a desirable ratio of volatile fatty acids is the fibre content of the diet (Stockdale et al. Citation1997). Cows in the current experiment were consuming 5.2–5.8 kg NDF/cow/day which equates to 31–34% of the diet DM; within the recommended range reported by Stockdale et al. (Citation1997). However, a depression in rumen pH below approximately 6.0 will inhibit fibre digestion (Stewart Citation1977) and thus alter the ratio of volatile fatty acids in the rumen. Waghorn et al. (Citation2019) reported that when 23% of FB was offered with pasture, all of the FB was eaten and DM digestibility increased, despite small reductions in NDF apparent digestion. However, higher substitution with FB (45% FB) resulted in similar DM digestibility to the 23% FB treatment but the apparent digestion of aNDF was reduced by a further 10.3 percentage units. Pacheco et al. (Citation2019) reported that increasing FB increased the proportion of large DM particles in the rumen but attributed this to poor chewing of the FB bulbs rather than reduced digestion of the pasture component of the diet. In the absence of rumen data in the current experiment we can only hypothesise on the reasons for reduced milk fat content and milk solids yield in the FB40 cows. Waghorn et al. (Citation2018, Citation2019), and knowledge of the chemical composition of the diet, suggests the differences may have been driven by changes to rumen fermentation and fibre digestion.
Fodder beet has a significantly different nutritional profile to pasture () and traditional supplementary feeds for lactating dairy cattle in New Zealand (DairyNZ Citation2017). In addition to the bulb being very high in soluble sugars (Dalley et al. Citation2017; de Ruiter et al. Citation2018) the results of this experiment highlight that it is low in P, Ca and Mg. The low Ca and Mg concentrations of the bulb are offset by a higher concentration in the leaf but P concentrations in the leaf were also less than the pasture on offer (). While there was no statistically significant difference in P intake between the treatment groups, the blood P concentrations of the FB40 cows were significantly lower than the Maize and FB25 cows. Blood Mg concentration was higher in cows offered FB compared with the Maize treatment. These blood mineral results have implications for mineral supplementation of lactating cows consuming FB in late lactation, particularly if they are going to be wintered on FB (Gibbs et al. Citation2015). Phosphorus deficiency and imbalances in the Ca:P ratio of the diet have consequences for the risk of metabolic disorders at calving (Goff Citation2018). Thus mineral supplementation recommendations may need to be reviewed.
An interesting observation was the significantly (p < 0.001) higher plasma betahydroxybutyrate (BHBA) concentration in the FB25 and FB40 treatments at the afternoon sampling, which immediately followed consumption of FB. Zarrin et al. (Citation2017) reported that elevated blood BHBA concentrations decreased blood glucose concentrations and, depending on time relative to calving, also affected plasma insulin concentrations. The implications of this finding in relation to FB feeding systems require further investigation. The lack of effect of FB40 on GLDH concentration is difficult to explain. Grala et al. (Citation2019) reported lower serum GLDH concentrations in pregnant, non-lactating cows consuming 8 kg DM FB and 4 kg DM pasture silage compared with the control group consuming 8 kg DM pasture and 4 kg DM maize silage. Based on the results of Grala et al. (Citation2019) we hypothesised that serum GLDH concentrations would decline with increasing FB intake but this did not occur.
Conclusion
At the same supplement DM intake, diets containing maize silage or grazed FB had similar indicators of N surplus i.e. UN, BUN and MUN, but FB supplementation increased MS production compared with maize supplementation. At 40% FB inclusion apparent N intake was reduced and urinary N concentration was lower, but this came at the expense of MS production. Farmers need to exhibit caution when feeding fodder beet to lactating dairy cows to minimise the risk of adverse animal health effects. Feeding fodder beet allocations high enough to achieve an environmental benefit is not likely without affecting animal health and milk production adversely. Farmers feeding up to 4 kg DM/cow/day maize silage during late lactation will get no additional environmental benefit from replacing this with fodder beet.
Acknowledgements
The study was undertaken as part of the Forages for Reduced Nitrate Leaching programme with principal funding from the New Zealand Ministry of Business, Innovation, and Employment (DNZ1301; RD1422). The programme is a partnership between DairyNZ Ltd, AgResearch Ltd, Plant and Food Research, Lincoln University, and the Foundation for Arable Research and Manaaki Whenua ‒ Landcare Research. The grazing experiment was conducted by the DairyNZ technical team led by Stu Morgan. Animal management, milking and paddock management were undertaken by the DairyNZ Scott Farm team led by Johannes Nagel. Fertiliser advisory services were provided by Anna-Lena Wright (Ballance Agri-Nutrients). Ben Trotter (Agricom) provided advice on fodder beet establishment. Faecal and urine analyses were conducted by the Massey University Nutrition Laboratory (www.massey.ac.nz), blood and milk urea analyses were conducted by Gribbles (www.gribblesvets.co.nz) and pasture nutritional analyses were conducted by Hill Laboratories (www.hill-laboratories.com). Statistical analysis was performed by Barbara Dow (DairyNZ).
Disclosure statement
No potential conflict of interest was reported by the authors.
ORCID
Dawn Dalley http://orcid.org/0000-0003-3707-2051
John de Ruiter http://orcid.org/0000-0001-6995-058X
Brendon Malcolm http://orcid.org/0000-0002-2028-4579
Additional information
Funding
References
- AFRC (Agricultural and Food Research Council). 1992. ARFC technical committee on response to nutrients. Report No. 9. Nutrition Abstracts and Reviews (Series B). 62:787–835.
- Blakemore LC, Daly BK, Searle PL. 1987. Methods for chemical analysis of soils. Lower Hutt: New Zealand Soil Bureau, Department of Scientific and Industrial Research 80.
- Castillo AR, Kebreab E, Beever DE, France J. 2000. A review of efficiency of nitrogen utilisation in lactating dairy cows and its relationship with environmental pollution. Journal of Animal and Feed Sciences. 9:1–32. doi: 10.22358/jafs/68025/2000
- Castle ME, Drysdale AD, Waite R. 1961. The effect of root feeding on the intake and production of dairy cows. Journal of Dairy Research. 28:67–74. doi: 10.1017/S0022029900010621
- Clarke DA, Caradus JR, Monaghan RM, Sharp P, Thorrold BS. 2007. Issues and options for future dairy farming in New Zealand. New Zealand Journal of Agricultural Research. 50:203–221. doi: 10.1080/00288230709510291
- DairyNZ. 2017. Facts and Figures: a quick reference guide for New Zealand dairy farmers. DNZ30-001. pp. 163.
- Dalley DE, Gardner G. 2012. Pasture growth and quality on West Coast dairy farms. Proceedings of the New Zealand Grasslands Association. 74:231–236.
- Dalley DE, Geddes T. 2012. Pasture growth and quality on Southland and Otago dairy farms. Proceedings of the New Zealand Grasslands Association. 74:237–242.
- Dalley DE, Malcolm BJ, Chakwizira E, de Ruiter JM. 2017. Range of quality characteristics of New Zealand forages and implications for reducing the nitrogen leaching risk from grazing dairy cows. New Zealand Journal of Agricultural Research. 60(3):319–332. doi: 10.1080/00288233.2017.1345762
- de Ruiter JM, Malcolm BJ, Chakwizira E, Johnstone PR, Maley S, Arnold NP, Dalley DE. 2018. Crop management effects of supplementary feed quality and crop options for dairy feeding to reduce nitrate leaching. New Zealand Journal of Agricultural Research. 62:369–398. doi:10.1080/00288233.2018.1508042.
- Di H, Cameron K. 2002. Nitrate leaching in temperate agroecosystems: sources, factors and mitigating strategies. Nutrient Cycling in Agroecosystems. 64(3):37–256. doi: 10.1023/A:1021471531188
- Di HJ, Cameron KC, Moore S, Smith NP. 1999. Contributions to nitrogen leaching and pasture uptake by autumn-applied dairy effluent and ammonium fertilizer labelled with 15N isotope. Plant and Soil. 210:189–198. doi: 10.1023/A:1004677902049
- Ferris CP, Patterson DC, Gordon FJ, Kilpatrick DJ. 2003. The effect of concentrate feed level on the response of lactating dairy cows to a constant proportion of fodder beet inclusion in a grass silage-based diet. Grass and Forage Science. 58:17–27. doi: 10.1046/j.1365-2494.2003.00347.x
- Firkins JL, Reynolds C. 2005. Whole-animal nitrogen balance in cattle. In: E Pfeffer, AN Hristov, editor. Nitrogen and phosphorus nutrition of cattle. Wallingford (UK): CAB International; p. 167–186.
- Fisher GEJ, Sabri MS, Roberts DJ. 1994. Effects of feeding fodder beet and concentrates with different protein contents on dairy cows offered silage ad libitum. Grass and Forage Science. 49:34–41. doi: 10.1111/j.1365-2494.1994.tb01974.x
- Fleming AE, Edwards GR, Bryant RH, Dalley DE, Gregorini P. 2018. Milk production and milk fatty acid compositin of grazing dairy cows supplemented with fodder beet. New Zealand Journal of Animal Science and Production. 78:6–10.
- Gibbs SJ. 2014. Fodder beet in the New Zealand dairy industry. Proceedings of the South Island Dairy Event, Stadium Southland, Invercargill. p. 237–246.
- Gibbs SJ, Saldias B, Trotter C. 2015. Fodderbeat in lactation and to replacement heifers. Proceedings of the South Island Dairy Event, Lincoln University. p. 241–252.
- Goff P. 2018. Invited review: mineral absorption mechanisms, mineral interactions that affect acid-base and anti-oxidant status, and diet considerations to improve mineral status. Journal of Dairy Science. 101:2763–2813. doi: 10.3168/jds.2017-13112
- Grala TM, Handley RR, Phyn CVC, Roche JR, Dalley DE. 2019. A quantitative case study assessment of changes to hepatic metabolism from nonlactating grazing dairy cows consuming a large proportion of their diet as fodder beet. Journal of Dairy Science. 102(9):8559–8570. doi: 10.3168/jds.2018-16009
- Gregorini P, Beukes PC, Dalley DE, Romera AJ. 2016. Screening for diets that reduce urinary nitrogen excretion and methane emissions while maintaining or increasing production by dairy cows. Science of The Total Environment. 551–552:32–41. doi: 10.1016/j.scitotenv.2016.01.203
- Gregorini P, Villalba JJ, Provenza FB, Beukes PC, Forbes JM. 2015. Modelling preference and diet selection patterns by grazing ruminants: a development in a mechanistic model of a grazing dairy cow, MINDY. Animal Production Science. 55:360–375. doi: 10.1071/AN14472
- Hewitt AE. 2010. New Zealand soil classification. 3rd ed. Landcare Research, Lincoln (NZ): Manaaki Whenua Press.
- Horwitz W, Latimer GW. 2005. Official methods of analysis of AOAC international. 18th edn. Maryland: Association of Official Analytical Chemistry International.
- Huhtanen P. 1987. The effect of dietary inclusion of barley, unmolassed sugar beet pulp and molasses on milk production, digestibility and digesta passage in dairy cows given silage based diet. Journal of Agricultural Science in Finland. 59:101–120.
- Huhtanen P, Hristov AN. 2009. A meta-analysis of the effects of dietary protein concentration and degradability on milk protein yield and milk N efficiency in dairy cows. Journal of Dairy Science. 92:3222–3232. doi: 10.3168/jds.2008-1352
- Kebreab E, France J, Beever DE, Castillo AR. 2001. Nitrogen pollution by dairy cows and its mitigation by dietary manipulation. Nutrient Cycling in Agroecosystems. 60:275–285. doi: 10.1023/A:1012668109662
- Kebreab E, Strathe AB, Dijkstra J, Mills JAN, Reynolds CK, Crompton LA, Yan T, France J. 2010. Energy and protein interactions and their effect on nitrogen excretion in dairy cows. In: GM Crovetto, editor. 3rd EAAP international symposium on energy and protein metabolism and nutrition. Wageningen (The Netherlands): Wageningen Academic Publishers; p. 417–425.
- Kolver ES, Roche JR, Miller DB, Densely RJ. 2001. Maize silage for dairy cows. Proceedings New Zealand Grasslands Association. 63:195–201.
- Krause KM, Oetzel GR. 2006. Understanding and preventing subacute ruminal acidosis in dairy herds: a review. Animal Feed Science and Technology. 126:215–236. doi: 10.1016/j.anifeedsci.2005.08.004
- Ledgard SF, Menneer JC. 2005. Nitrate leaching in grazing systems and management strategies to reduce loses. In: Currie LD, Hanley JA, editor. Proceedings of the Workshop Development in Fertiliser Application Technologies and Nutrient Management; Palmerston North (NZ): Massey University. Occasional Report No. 18. Palmerston North (NZ): Massey University. p. 79–82.
- Ledgard SF, Penno JW, Sprosen MS. 1999. Nitrogen inputs and losses from clover/grass pastures grazed by dairy cows, as affected by nitrogen fertilizer application. The Journal of Agricultural Science. 132(2):215–225. doi: 10.1017/S002185969800625X
- Lee JM, Hedley P, Roche JR. 2011. Grazing management guidelines for optimal pasture growth and quality. DairyNZ Technical Series Issue. 5:6–10.
- Lowe DJ. 2010. Introduction to the landscapes and soils of the Hamilton basin. In: DJ Lowe, VE Neall, M Hedly, B Clothier, A Mackay, editor. Guidebook for pre-conference Norther Island New Zealand “Volcanoes to ocean” 26th-30th July, 2010, 19th world congress of soil science: soil solutions for a changing world: Brisbane Australia 1–6 August 2010. Palmerston North (NZ): New Zealand Society of Soil Science; p. 1,14–1.61.
- Matthew C, Nelson NJ, Ferguson D, Xie Y. 2011. Fodder beet revisited. Agronomy New Zealand. 41:39–48.
- McKenzie FR, Jacobs JL, Kearney G. 2003. Long-term effects of multiple applications of nitrogen fertiliser on grazed dryland perennial ryegrass/white clover dairy pastures in south-west Victoria. 3. Botanical composition, nutritive characteristics, mineral content, and nutrient selection. Australian Journal of Agricultural Research. 54:477–485. doi: 10.1071/AR02189
- NIWA. 2019. Mean monthly rainfall (mm). https://www.niwa.co.nz/education-and-training/schools/resources/climate/meanrain.
- Olsen SR, Cole CV, Watanabe FS, Dean LA. 1954. Estimation of available phosphorus in soils by extraction with sodium bicarbonate. pp. 19. Washington (DC): USDA, Circular Nr 939, US Gov. Print Office. 19 p.
- Pacheco D, Muetzel S, Lewis S, Dalley D, Bryant M, Waghorn GC. 2019. Rumen digesta and products of fermentation in cows fed varying proportions of fodder beet (Beta vulgaris) with fresh pasture or silage or straw. Animal Product Sci. DOI:10.1071/AN18002.
- Pacheco D, Waghorn GC. 2008. Dietary nitrogen – definitions, digestion, excretion and consequences of excess for grazing ruminants. Proceedings of the New Zealand Grassland Association. 70:107–116.
- Rayment GE, Higginson FR. 1992. Australian laboratory handbook of soil and water chemical methods. Melbourne (Australia): Inkata Press Pty Ltd. xvii+330 p.
- Roberts DJ. 1987. The effects of feeding fodder beet to dairy cows offered silage ad libitum. Grass and Forage Science. 42:391–395. doi: 10.1111/j.1365-2494.1987.tb02129.x
- Roche JR, Friggens NC, Kay JK, Fisher MW, Stafford KJ, Berry DP. 2009. Invited review: body condition score and its association with dairy cow productivity, health, and welfare. Journal of Dairy Science. 92:5769–5801. doi: 10.3168/jds.2009-2431
- Roche JR, Ledgard SF, Sprosen MS, Lindsey SB, Penno JW, Horan B, Macdonald KA. 2016. Increased stocking rate and associated strategic dry-off decision rules reduced the amount of nitrate-N leached under grazing. Journal of Dairy Science. 99(7):5916–5925. doi: 10.3168/jds.2016-11024
- Snow VO, Shepherd MA, Cichota R, Vogeler I. 2011. Urine timing: are the 2009 Waikato results relevant to other years, soils and regions. In: Currie LD, Christensen CL, editors. Adding to the knowledge base for the nutrient manager. Palmerston North (NZ): Fertilizer and Lime Research Centre, Massey University. Occasional Report No. 24. 13 pages. http://flrc.massey.ac.nz/publications.html.
- Soil Survey Staff. 2014. Keys to soil taxonomy. 12th ed. Washington (DC): United States Department of Agriculture.
- Sparling G, Searle P. 1993. Dimethyl sulphoxide reduction as a sensitive indicator of microbial activity in soil: the relationship with microbial biomass and mineralization of nitrogen and sulphur. Soil Biology and Biochemistry. 25(2):251–256. doi: 10.1016/0038-0717(93)90035-A
- Stergiadis S, Chen XJ, Allen M, Wills D, Yan T. 2015. Evaluating nitrogen utilization efficiency of nonpregnant dry cows offered solely fresh cut grass at maintenance levels. Journal of Animal Science. 93(2):709–720. doi: 10.2527/jas.2014-8197
- Stewart CD. 1977. Factors affecting the cellulolytic activity of rumen contents. Applied Environmental Microbiology. 33:497–502. doi: 10.1128/AEM.33.3.497-502.1977
- Stockdale CR, Dellow DW, Grainger C, Dalley D, Moate PJ. 1997. Supplements for dairy production in Victoria. Glen Iris, Victoria: Dairy Research and Development Corporation, 1997.
- Sutton JD, Dhanoa MS, Morant SV, France J, Napper DJ, Schuller E. 2003. Rates of production of acetate, propionate, and butyrate in the rumen of lactating dairy cows given normal and low-roughage diets. Journal of Dairy Science. 86:3620–3633. doi: 10.3168/jds.S0022-0302(03)73968-X
- Vogeler I, Beukes P, Burggraaf V. 2013. Evaluation of mitigation strategies for nitrate leaching on pasture-based dairy systems. Agricultural Systems. 115:21–28. doi: 10.1016/j.agsy.2012.09.012
- Waghorn GC, Burke JL, Kolver ES. 2007. Principles of feeding value. In: Rattray PV, Brookes IM, Nicol AM, editors. Pastures and supplements for grazing animals. Hamilton (NZ): New Zealand Society of Animal Production. Occasional Publication Number 14. p. 35–60.
- Waghorn GC, Collier K, Bryant M, Dalley D. 2018. Feeding fodder beet (Beta vulgaris L.) with either barley straw or pasture silage to non-lactating dairy cows. New Zealand Veterinary Journal. 66(4):178–185. doi: 10.1080/00480169.2018.1465484
- Waghorn GC, Law N, Bryant M, Pacheco D, Dalley D. 2019. Digestion and nitrogen excretion by Holstein–Friesian cows in late lactation offered ryegrass-based pasture supplemented with fodder beet. Animal Production Science. 59(7):1261–1270. doi: 10.1071/AN18018
- Watkinson JH, Kear MJ. 1994. High performance ion chromatography measurement of sulfate in 20 mM phosphate extracts of soil. Communications in Soil Science and Plant Analysis. 25(7/8):1015–1033. doi: 10.1080/00103629409369095
- Zarrin M, Grossen-Rosti L, Bruckmaier RM, Gross JJ. 2017. Elevation of blood β-hydroxybutyrate concentration affects glucose metabolism in dairy cows before and after parturition. Journal of Dairy Science. 100(3):2323–2333. doi: 10.3168/jds.2016-11714