
Abstract
We analysed DNA profiles at eight simple sequence repeat (SSR) loci for 449 individuals of Fuscospora species from New Zealand. The two species with serrated leaves (F. fusca and F. truncata) are clearly distinct genetically despite the occurrence of wild hybrids. Further, from our results, we infer that they are no more closely related to each other than they are to either of the entire-leaved species (F. cliffortioides and F. solandri). Although genetic groups corresponding with F. cliffortioides and F. solandri can be distinguished, our data suggest that considerable admixture may occur between them in some areas. Nonetheless, the broadly sympatric distribution of these two genetic groups, and their consistency with morphological and ecological groups, support their recognition at species rank rather than their treatment as varieties of one variable species.
Introduction
Southern beech (Nothofagaceae Kuprian.) has been central to a number of debates about the origins and evolution of plants in New Zealand, particularly the relative importance of ancient Gondwanan lineages and vicariance or later dispersals in the composition of the flora (Knapp et al. Citation2005), and the importance or otherwise of hybridisation in the adaptation and evolution of plant species (Wardle et al. Citation1988; Ogden Citation1989). They have also been studied with regard to the impact of past glacial periods on the present-day distribution of species in New Zealand (Wardle Citation1963; Thomsen Citation2002; Leschen et al. Citation2008), and elsewhere in the Southern Hemisphere (Marchelli & Gallo Citation2004; Worth et al. Citation2009; Vergara et al. Citation2014). Following historical clearance of lowland conifer–broadleaved forests, southern beech species are now collectively the most common and widespread trees in New Zealand (McGlone et al. Citation1996) and their ecology has been extensively studied (Wardle Citation1984; Leathwick Citation1998; Hurst et al. Citation2012). All of the southern beech species that are native to New Zealand are endemic.
Phylogenetic studies have shown that four distinct clades of southern beech are extant (Martin & Dowd Citation1993; Manos Citation1997; Setoguchi et al. Citation1997; Sauquet et al. Citation2012; Heenan & Smissen Citation2013). At a time when they were often included alongside Northern Hemisphere beech (Fagus L.) and oak (Quercus L.) within Fagaceae Dumort., these clades were recognised at sub-generic rank within Nothofagus Blume (Hill & Read Citation1991). Subsequently, southern beech species have been accepted as belonging to a distinct family, Nothofagaceae, recognising that they are the sister group to the remainder of the order Fagales (Manos et al. Citation1993; Manos & Steele Citation1997; The Angiosperm Phylogeny Group Citation1998) and therefore relatively distantly related to Fagaceae. Given this change in family placement, and after assessment of the levels of genetic and morphological diversity in Nothofagaceae in comparison with other families of Fagales, Heenan & Smissen (Citation2013) recognised the four extant southern beech clades as four genera: Nothofagus Blume (in southern South America), Fuscospora (R.S.Hill & J.Read) Heenan & Smissen (in Australasia and southern South America), Lophozonia Turcz. (in Australasia and southern South America) and Trisyngyne Baill. (in New Caledonia, New Guinea, and nearby islands).
Two of these genera are present in New Zealand: Lophozonia and Fuscospora. The genus Lophozonia is represented in New Zealand by L. menziesii (Hook.f.) Heenan & Smissen (silver beech) and Fuscospora by F. cliffortioides (Hook.f.) Heenan & Smissen (mountain beech), F. fusca (Hook.f.) Heenan & Smissen (red beech), F. solandri (Hook.f.) Heenan & Smissen (black beech) and F. truncata (Colenso) Heenan & Smissen (hard beech). The New Zealand Fuscospora species have either entire leaves (F. cliffortioides and F. solandri) or serrated leaves (F. fusca and F. truncata). Mountain beech was historically considered a species distinct from F. solandri (as Fagus cliffortioides Hook.f. –Hooker Citation1844, or as Nothofagus cliffortioides (Hook.f.) Oerst. –Cockayne Citation1926; Cockayne & Atkinson Citation1926) but Poole (Citation1958) reduced it to a variety of F. solandri because the two forms were linked by numerous populations displaying intermediate morphology. However, some authors have continued to regard mountain beech as a distinct species (Molloy et al. Citation1999; Meurk & Hall Citation2006; McGlone et al. Citation2011) and this was the position and rank adopted by Heenan and Smissen (Citation2013) when segregating Fuscospora from Nothofagus. Fuscospora cliffortioides and F. solandri have a wide area of sympatry in the North and South Islands, have differentiated habitats, can be distinguished by their morphology and were therefore considered by them to be better recognised at species rank. According to Wardle (Citation1984), black beech (F. solandri) is a tall tree averaging 20–25 m, and sometimes reaching 30 m, while mountain beech (F. cliffortioides) is smaller, usually 12–15 m, sometimes reduced to a prostrate shrub of only 0.5 m, but on fertile lowland sites sometimes reaching 25 m. The elevational limit of F. solandri is usually 600–700 m, but it can grow up to 800 m in the north of its range. Fuscospora cliffortioides frequently ascends to 1300–1400 m and sometimes higher. The two taxa are often distinguished by differences in leaf shape, but both are variable and intermediate forms are common. The species with serrated leaves, F. fusca and F. truncata, can also be difficult to distinguish and are considered by some to be more closely related to each other than to the entire-leaved species, or to be dubiously distinct (e.g. van Steenis Citation1953; Ogden Citation1989; Govaerts & Frodin Citation1999).
The four New Zealand species of Fuscospora overlap considerably in their ranges, and mixed forests are common; yet each species has distinctive ecological requirements (Wardle Citation1984; Leathwick Citation1995). Published chromosome counts for F. cliffortioides and F. fusca are all n = 13 (Armstrong & Wyile Citation1965; Dawson Citation2000), in agreement with an unpublished count for F. truncata of 2n = 26 (P. de Lange, New Zealand Department of Conservation, pers. comm. 30 January 2014) and it seems likely this number is also to be found in F. solandri. All the species are wind pollinated. Hybrids between species of Fuscospora have been reported from sites where more than one species occurs. Wild southern beech hybrids from New Zealand were brought to the attention of science by Leonard Cockayne and their occurrence and character variation are described in Cockayne and Atkinson (Citation1926). The morphology of probable hybrids in the wild varies considerably (Cockayne Citation1926; Cockayne & Atkinson Citation1926), suggesting that second- and later-generation hybrids may occur. Artificial hybrids have been generated between F. solandri and F. fusca, and the fertility of seed from wild hybrid F. cliffortioides × F. fusca has been demonstrated (Poole Citation1951).
Given their dominance in some landscapes over wide areas of the country, and their past and potential future value as a timber resource, surprisingly little work has been published on the genetic variation within and among southern beech species in New Zealand. Exceptions include the important provenance trial reported by Wilcox and Ledgard (Citation1983) and the isozyme studies of Haase (Citation1992, Citation1993a,Citationb, Citation1994). Haase (Citation1992) reported little genetic variation between populations of Fuscospora species in New Zealand, with most isozyme variation occurring within populations. However, levels of isozyme polymorphism in these species were low. Genetic variation and hybridisation in species of Lophozonia (as Nothofagus subgenus Lophozonia) and Nothofagus in Australia and South America have been studied using chloroplast DNA, allozymes and simple sequence repeat markers (Marchelli & Gallo Citation2001; Quiroga et al. Citation2005; Worth et al. Citation2009; Acosta & Premoli Citation2010; Acosta et al. Citation2012; Premoli et al. Citation2012; Vergara et al. Citation2014).
In this study, we report analysis of eight simple-sequence repeat (SSR) loci (also called microsatellites) for 449 individuals of Fuscospora including plants identified as F. cliffortioides, F. fusca, F. truncata, F. solandri and possible hybrids among them. These data were assessed for evidence of phylogenetic relationships among the species, hybridisation and recent gene flow among them, and for phylogeographic structure within the species. A particular focus is to examine whether the SSR loci provide any support for the recognition of mountain (F. cliffortioides) and black beech (F. solandri) as distinct species.
Materials and methods
Details of sample locations are shown in Appendix 1 (). Between 1 and 12 plants were sampled at each location. Species identifications were made with reference to Wardle (Citation1984) and other sources. In general, we did not attempt to diagnose hybrid plants a priori because hybrids can be cryptic (resembling closely one parental species or the other, or exhibiting leaf dimorphism between crown and epicormic branches: Wardle Citation1984), particularly those between the serrate-leaved species F. fusca and F. truncata, and between the two entire-leaved species F. cliffortioides and F. solandri. However, two plants from Tom Creek had leaf morphology strongly suggesting that they were F. cliffortioides × F. fusca and one plant from MacFarlane Mound had leaf morphology strongly suggesting F. cliffortioides × F. truncata (see ). These were initially grouped with F. fusca and F. truncata respectively for Structure analysis (see below). Leafy twigs were sampled in the field and frozen on return to the laboratory until DNA was extracted. DNA extractions were conducted using the Maxwell® DNA extraction system (Promega, Madison, WI, USA) from leaf, twig or leaf-bud (preferred if present) then further purified by phenol–chloroform–isoamyl alcohol extraction and recovered using a Zymo spin column (Zymo Research Corp., Irvine, CA, USA). The seven SSR loci presented in Smissen et al. (Citation2012) were amplified as described in that reference. We also used the primer pair ncutas13 of Jones et al. (Citation2004), designed for Lophozonia cunninghamii (Hook.f.) Heenan & Smissen (as Nothofagus cunninghamii (Hook.f.) Oerst.) with an annealing temperature in polymerase chain reactions of 60 °C. Markers were sized using an ABI3730 genetic analyser. Allele scoring was undertaken manually using GeneMarker 1.51 (SoftGenetics, State College, PA, USA) to visualise fragment size analysis files. Occasional reactions failing to produce a detectable fragment were repeated. Samples for which reactions for more than two loci failed to produce a detectable fragment twice were omitted as low-quality DNA extracts. All scores were checked by repeat scoring. For six of the loci, alleles differed in size by amounts corresponding to the length of their characterised repeat unit and presented no difficulty in scoring. Two loci (notssr2 and notssr8) presented more continuous variation in allele size. For these two loci, fragments were binned according to the size classes presented in Appendix 2 ( and ).
We used the software Structure 2.3.3 (Pritchard et al. Citation2000) to conduct admixture analysis of the total dataset. Settings were as follows: length of burnin period 200,000, number of MCMC reps after burnin 800,000, use admixture model, infer alpha, initial value of alpha 1.0, separate alpha for each population, uniform prior for alpha, maximum value for alpha 10.0, SD of proposal for updating alpha 0.025, allele frequencies independent among populations, infer lambda, separate lambda for each population, starting value of lambda 1.0. The value of k, the number of populations, was estimated as 4 based on examination of mean likelihood values and Δk (Evanno et al. Citation2005) at k from 1 to 10 using 10 replicate runs with a burnin of 20,000 and 80,000 generations after burnin. Structure output was examined using the Structure Harvester website (Earl & vonHoldt Citation2012).
We also conducted a Structure analysis with k = 3 (which had the effect of considering F. cliffortioides and F. solandri as a single species) to identify hybrids between the serrated-leaved species or between either of the entire-leaved species and the serrated-leaved species. Individuals for which 90% probability intervals from Structure excluded pure ancestry were removed from the dataset and the remaining samples were grouped by locality and species for the purposes of estimating genetic distances among populations, using Powermarker 3.25 (Liu & Muse Citation2005). In the case of three plants coming from sites at which both F. fusca and F. truncata grow, identifications were altered after structure analysis prompted re-examination of leaf characters. Distances were estimated using the model of Nei (Citation1972) and a UPGMA tree generated in Powermarker and drawn using MEGA 5.1 (Tamura et al. Citation2011).
A second Structure analysis was conducted for the F. cliffortioides and F. solandri samples, excluding those suggested by the k = 3 analysis to be hybrids with F. fusca or F. truncata (i.e. those for which 90% confidence intervals excluded pure ancestry from one species), using the same parameters as above except that k was set to 2 (as indicated by Δk) and allele frequencies were modelled as correlated between populations (Falush et al. Citation2003). The correlated allele frequencies model produced results in which individuals were generally inferred to be less admixed and likelihood and posterior probability scores for the data were marginally better than for the allele frequencies independent model. For each site we calculated the mean proportion of ancestry from each hypothetical population.
Correlation between Nei's (Citation1972) population genetic distances and geographic distances among populations of F. solandri and F. cliffortioides were assessed using the Mantel test implemented in R.
Results
Summary statistics for each species are reported in . Across the 8 loci and 449 samples in our total dataset there were 86 missing observations (no alleles scored for a sample at a locus). Many of these were for locus notssr8 from F. fusca for which 40 of 91 samples did not produce a fragment. Only a single sample each of F. cliffortioides and F. truncata did not produce a detectable fragment for this locus. The other missing observations were distributed over all the species and loci. In general, observed heterozygosity values were lower than the expected heterozygosity. Locus notssr13 was monomorphic in F. truncata, whereas locus ncutas13 was monomorphic in F. fusca.
Table 1 Summary statistics for Fuscospora species.
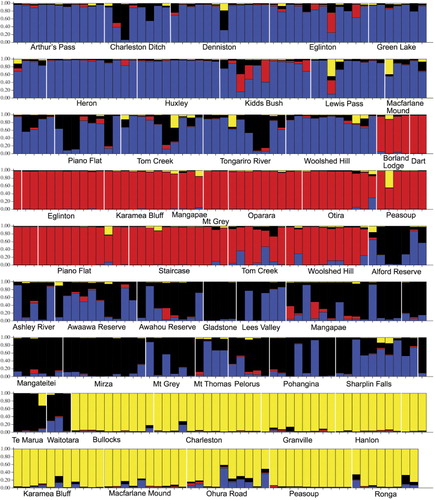
Analysis of the complete dataset using Structure and comparing the Δk statistic according to Evanno et al. (Citation2005) suggested that four populations best explain the data. The ancestry plot for individual samples is shown in . The four groups generally correspond very well with the four named taxa (F. cliffortioides, F. fusca, F. solandri and F. truncata), but F. cliffortioides and F. solandri are less well separated and some populations appear to be a mixture of both species and possibly hybrids between them. The analysis suggested that the sampled populations of F. fusca and F. truncata are essentially ‘pure’, but a few individuals appeared to be hybrids either between these two species or with F. cliffortioides or F. solandri. Likewise, a few F. cliffortioides and F. solandri individuals appeared to be hybrids with F. fusca or F. truncata. The 90% confidence intervals for individual ancestry estimates were very broad (supplementary information) and therefore these estimates should be treated with considerable caution, particularly where small proportions of ancestry from one population are indicated. However, 90% probability intervals from Structure excluded pure ancestry from any one population for 23 samples (including those vouchers listed as hybrids in ). With k = 3 this decreased to 20 samples.
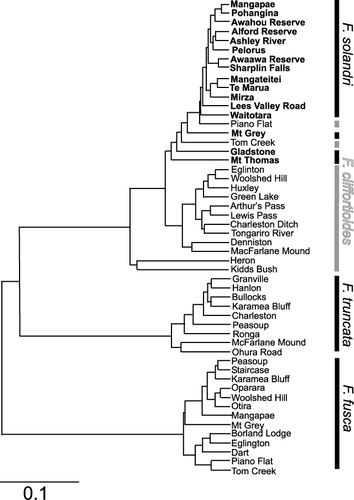
A UPGMA tree generated from Nei's (Citation1972) genetic distances among populations grouped them into clusters corresponding with F. fusca, F. truncata and a group combining F. cliffortioides and F. solandri together (). Within this last group there is some separation into groups corresponding with the two species, but a few populations were misplaced compared with their field ID. The Piano Flat and Tom Creek F. cliffortioides populations cluster with F. solandri populations, whereas the Kidd's Bush and Heron F. cliffortioides populations cluster together separately from the remaining F. solandri and F. cliffortioides populations. Correlation between genetic and geographic distances for populations of the entire-leaved species was weak (Pearson's r = 0.1036) and non-significant (P = 0.134).
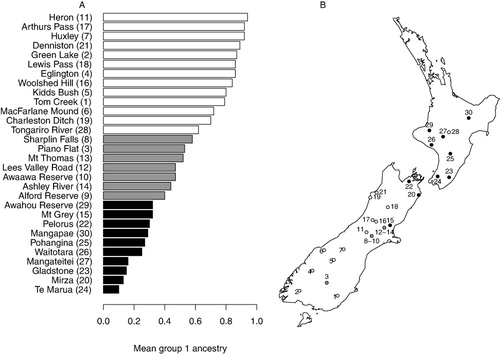
Analysis of F. solandri and F. cliffortioides genotypes without F. fusca, F. truncata or hybrids with those two species (as suggested by the k = 3 Structure analysis) using k = 2 returned clusters more or less consistent with the two species but with a number of mixed populations and considerable admixture (not shown). Again, probability intervals for individual ancestry estimates were very broad. To summarise this analysis we have plotted the mean group 1 ancestry estimates for each locality (). In populations are arranged from the most F. cliffortioides-like at the top to the most F. solandri-like at the bottom.
Discussion
Our small set of SSR markers has proved sufficient to distinguish populations of the species from each other, even when sympatric, with the exception of F. cliffortioides and F. solandri. Structure analyses of our data are also able to distinguish at least some hybrids among the taxa. This analysis provides the first published evidence we are aware of that F. truncata and F. fusca hybridise. Although it has long been expected that they would hybridise given the occurrence of hybrids between each of them and F. solandri or F. cliffortioides and between species in other genera of Nothofagaceae (Heenan & Smissen Citation2013 and references therein) the morphological similarity between F. fusca and F. truncata makes hybrids between them cryptic in the field.
With one exception, at least one allele could be amplified for each locus from the majority of samples (), indicating that null alleles are, at worst, rare for these loci in all species. The exception was notssr8, for which we could not amplify any fragment from 40 of 91 F. fusca samples. This indicates the presence of a high-frequency null allele or alleles at this locus in this species, as was suggested from a smaller sample by Smissen et al. (Citation2012). Comparison of observed heterozygosity (HO) and expected heterozygosity (HE) in each species () shows that the former is generally lower than the latter. This is to be expected because panmixis is an unreasonable assumption across the sampled range of each species. Our samples at individual sites are too small to allow meaningful comparison, treating each as discrete populations.
Ogden (Citation1989) described the New Zealand species of Fuscospora (treated as Nothofagus subgenus Fuscospora) as a coenospecies, the taxa of which exchanged genes relatively freely so that different morphologies came and went with time and changes in selective pressures within a common gene pool. He also stressed the similarity between F. fusca and F. truncata writing ‘… the difference between these two species (degree of leaf serration, presence of domatia, tree size and wood properties) are hardly sufficient to warrant specific status, especially in view of the observation that, where ever they grow together, intermediates are frequent. They differ much less in general appearance than do the extreme forms of the N[othofagus]. solandri cline.’
Our results do not support this view. Rather, both admixture analysis using Structure () and clustering of population genetic distances () show that the entire-leaved species are well differentiated from the serrated-leaved F. fusca and F. truncata, which are also well differentiated genetically from each other. Although hybrids do occur when they grow together, there is no evidence in our data for gene flow between the two serrated-leaved species, or between either of them and the entire-leaved species extending beyond contact zones. In most cases, the plants indicated as having mixed ancestry from entire- and serrated-leaved species or from both serrated-leaved species are from populations where they co-occur. An exception is the Kidd's Bush population of entire-leaved beech. Although there is no F. fusca currently at this exact site, it does occur in the general area (Wardle Citation1984, p. 103), so this is not a surprising result. Similarly, although we did not collect either of the entire-leaved species from Ohura Road, entire-leaved beech is present in the area and since several samples from this site were taken from seedlings without careful assessment of their morphology, it is not surprising that some hybridisation is suggested by the Structure analysis. Conversely, the 90% probability intervals from our Structure analysis suggests that one entire-leaved beech sample from Lewis Pass has some proportion of its ancestry from F. truncata despite the absence of that species from that area. Since F. truncata is not (to our knowledge) found at or near this site, the results must be rejected as false or attributed to hybridisation following long-distance pollen dispersal. We favour the former explanation because there is no aspect of the leaf morphology of these samples that suggests a hybrid origin, but cannot exclude the latter entirely.
Although F. truncata and F. fusca are morphologically similar in sharing leaves larger than those of F. solandri and in having leaves with serrate margins, our data do not support the contention that they are especially closely related. Indeed, comparison among the genera of Nothofagaceae would suggest these character states are symplesiomorphic. A study of genetic relationships among New Zealand Nothofagaceae, using isozyme analysis, also cast doubt on a particularly close relationship between F. fusca and F. truncata (Haase Citation1994).
However, F. cliffortioides and F. solandri show much less differentiation in our data ( and ). The Structure analysis in particular suggests that some populations can be interpreted as pure or nearly pure F. solandri (black in ) or F. cliffortioides (blue in ), whereas others appear to be a mixture of both. Even if these populations are accepted to be admixed, because confidence intervals for individual ancestry estimates are so broad (supplementary data), it is not clear whether these mixed populations are each composed of relatively uniform hybrid derivatives, or complex hybrid swarms, and individual assignments are probably not accurate. To allow for a simpler comparison of ancestry at a population level displays the mean ancestry estimates at each site from the F. cliffortioides and F. solandri structure analysis with k = 2. These results are largely in accord with morphological identifications of the plants, with F. solandri populations mostly having a mean proportion of group 1 membership < 0.4 and F. cliffortioides populations > 0.6. Plants from Piano Flat were collected as F. cliffortioides, and are described as such by the New Zealand Department of Conservation (Citationundated), while Structure analysis of our data yielded a mean group 1 membership of 0.53. Leaves from trees at this site are variable; some are consistent with F. solandri and this location is in an area where Wardle (Citation1984) indicates that forms intermediate between the taxa ‘outside the range of black beech proper’ are present.
Some F. solandri populations from the Canterbury foothills (Alford Reserve, Ashley River, Awahou Reserve, Lees Valley, Mt Thomas and Sharplin Falls in our sampling) have been considered morphologically intermediate between that species and F. cliffortioides (Wardle Citation1984). Our data suggest they are genetically admixed (, 0.40–0.58 proportion group 1), consistent with a hybrid origin or mixed composition for these populations. The Mt Grey population is geographically proximate to these, but has been considered to represent more typical F. solandri (Wardle Citation1984), and our data are consistent with this (0.32 proportion group 1). Fuscospora solandri was extensively logged in Canterbury in the late 19th and early 20th centuries (Wardle Citation1984, p. 331) resulting in its relative rarity today. Presumably the higher altitude admixed populations sampled in this study were both less desirable as timber and less accessible to commercial logging. After Piano Flat, the Tongariro population has the lowest proportion of group 1 membership (0.62) for plants collected as F. cliffortioides, despite samples from there having uniformly the leaf morphology of that species. Fuscospora solandri is also present in the central North Island so it is possible that some genetic influence of this species is also present in our Tongariro samples, which were collected from the lower edge of a forest (at c. 900 m) in an area disturbed by human activity. More sampling of populations of both species from this area will be necessary to determine if ‘pure’ F. cliffortioides is present and the nature of any admixture.
A further complication in assessing morphological variation within the entire-leaved species is that both Poole (Citation1958) and Wardle (Citation1984) suggest that introgressive hybridisation with F. fusca might have played a role. Our data do not provide support for this hypothesis (except in confirming that hybridisation occurs), but it remains highly plausible.
The UPGMA tree generated for population genetic distances also showed some clustering into groups corresponding with F. cliffortioides and F. solandri. Where clustering deviates from taxonomic assignment some explanations can be advanced. The Kidd's Bush population included several samples that the Structure analysis suggested are hybrids with F. fusca, but we did not exclude them because 90% probability intervals encompassed pure F. cliffortioides ancestry. The inclusion of probable hybrids is sufficient to explain the position of this population in the tree. Indeed, the relationships of populations within F. truncata indicated by the UPGMA analysis also appear to be influenced by the inclusion of hybrids in some populations. In this case, the McFarlane Mound and Ohura Road populations appear in a basal position within the species. The Piano Flat population is discussed above. The Tom Creek population was identified as F. cliffortioides when collected and appears to be predominantly this species in Structure analyses ( and ), but clusters with populations of F. solandri in the UPGMA tree: reappraisal of herbarium specimens () suggests some leaves are rather rounded, approaching F. solandri. Like the Piano Flat population, the Tom Creek population may be of admixed origin and it occurs in the southern South Island in the area where Wardle (Citation1984) reports intermediate forms. This site is also one at which hybridisation with F. fusca has taken place and this may be affecting both the genetic analysis and the leaf morphology. The remaining deviation is the Heron F. cliffortioides population, which appears as the most cliffortioides-like in the structure analysis but apart from the other populations of the species in the UPGMA tree. Unlike the other three cases, no immediate explanation for this discrepancy is apparent.
Although the ranges of F. solandri and F. cliffortioides overlap, the former is more common in the north and the latter more common in the south. However, genetic distances among populations of the entire-leaved species treated together are poorly predicted by geographic distance, suggesting that isolation by distance does not account for the genetic structure detected among them.
In reducing F. cliffortioides to a variety of F. solandri (both as Nothofagus), Poole (Citation1958) stressed that many trees and whole populations could not be assigned with confidence to one or the other variety, but that there are important ecological and timber property differences between the ‘extreme’ ends of what he perceived as a more or less continuous spectrum of character variation. This he attributed to ‘geographical or clinal’ variation. Here, we interpret this view as hypothesising a common gene pool, out of which ‘extreme’ morphological forms have arisen through natural selection acting locally on populations and metapopulations to independently produce the forms represented by typical mountain (F. cliffortioides) or black beech (F. solandri).
In our view, Poole's position was sound at the time it was published, and his interpretation was quite sufficient to explain the morphological variation he documented. Genetic data consistent with this sort of geographic variation within a species have been reported for a few New Zealand plants (e.g. Helichrysum lanceolatum, Smissen et al. Citation2006; Cordyline australis, Beever et al. Citation2013) and plants from other regions (e.g. Helichrysum italicum, Galbany-Casals et al. Citation2011) and is understood from a theoretical population genetic perspective (Latta Citation2003). However, the data we report here are more consistent with a scenario in which the two forms diverged from each other in allopatry but are now in secondary contact and undergoing hybridisation and probably some introgression. This is illustrated by the greater similarity shown between some geographically distant but morphologically similar populations (e.g. Mangateitei and Mt Grey) than between geographically proximate but morphologically dissimilar populations (e.g. Mangateitei and Tongariro). Under a scenario where the morphological differences between mountain and black beech were maintained by habitat selection, neutral genetic markers such as those examined in this study would be more similar between geographically proximate populations than between geographically distant populations. However, other scenarios might be generated and the data currently available do not allow a conclusive test. Because F. solandri and F. cliffortioides are maintained in apparently pure form, at least over much of their area of sympatry, we suggest that they are reproductively isolated and appropriate for recognition at species rank under the biological species concept (Mayr Citation1942) if not applied too strictly so as to imply whole-genome reproductive isolation (see Rieseberg et al. Citation2004). Invocation of any particular reproductive isolating mechanism would be speculative at this time but phenological differences are noted by Wardle (Citation1984, p. 254, citing unpublished data of A. L. Poole). Although further work is required to clarify the boundaries between these two species and the extent of gene flow between them, our results are consistent with their continued recognition. Future work should include additional samples of both species and additional genetic markers.
The practical issue highlighted by Poole, the problem of assigning trees or populations of intermediate morphology to one or the other taxon, remains an issue regardless of the rank at which the taxa are named. Moreover, this problem is far from restricted to the taxa at issue here. New Zealand examples of species which hybridise often, and which form self-sustaining hybrid swarms or introgressed populations, include Phormium cookianum and P. tenax (Smissen et al. Citation2008), and Pseudopanax lessonii and P. crassifolius (Morgan-Richards et al. Citation2009).
We suggest that the two entire-leaved southern beech species should be treated pragmatically such that populations and individuals should be identified with one or the other species even if there is some evidence for gene flow from the other species (or indeed from F. fusca or F. truncata). However, some populations and individuals are probably better treated as hybrids, using the hybrid formula F. cliffortioides × F. solandri. Most populations from the Canterbury foothills are probably best referred to F. solandri, as proposed by Wardle (Citation1984) despite our data suggesting some component of the F. cliffortioides genome is present. None of the populations we sampled from the south of the South Island appear to be pure black beech (F. solandri), but the Piano Flat population may represent what Wardle (Citation1984) called ‘intermediate forms between black beech and N. solandri var. cliffortioides (mountain beech)’ and might best be treated as F. cliffortioides × F. solandri. Further work will be required to establish whether and to what extent pure F. solandri is present in this part of the country. In the North Island, where the relative abundances of the two species are reversed, work is also required to examine the extent of true F. cliffortioides and how much admixture with F. solandri has taken place. In particular, further sampling of F. cliffortioides, including from higher altitudes should be undertaken.
In summary, our SSR data readily distinguish the serrated-leaved New Zealand Fuscospora species F. fusca and F. truncata, but suggest considerable admixture between the entire-leaved F. cliffortioides and F. solandri. However, our results also suggest that variation within entire-leaved beech is better reflected by the recognition of distinct species, with morphological intermediates interpreted as the result of secondary contact and hybridisation than as a single variable species. Although with the number of markers currently available ancestry estimates for individual plants lack the precision necessary to distinguish between F1 and later-generation hybrids, the latter seem likely to occur at least rarely between most combinations of species. Although hybrids are common, gene flow among the species appears to be limited and localised (except perhaps between F. cliffortioides and F. solandri), but again the sampling of more loci and populations will be required to rigorously test this.
Supplementary file
Supplementary file: Structure results file with ancestry estimates for individual plants.
Structure results file with ancestry estimates for individual plants.
Download Text (100.8 KB)Acknowledgements
This work was funded by the New Zealand Ministry of Business, Innovation and Employment (Capability Fund). Rowan Buxton and Jen Hurst contributed to sample collection. Caroline Mitchell and Dagmar Goeke (Landcare Research) provided technical support. Matt McGlone (Landcare Research) provided stimulating discussion. Peter Haase, Gary Houliston (Landcare Research), Leon Perrie (Museum of New Zealand Te Papa Tongarewa) and two anonymous reviewers provided constructive comments on a draft manuscript and it was edited by Christine Bezar (Landcare Research).
Related Research Data
References
- Acosta MC, Mathiasen P, Premoli AC 2012. Predominant regeneration strategy results in species-specific genetic patterns in sympatric Nothofagus s.s. congeners (Nothofagaceae). Australian Systematic Botany 60: 319–327. 10.1071/BT11277
- Acosta MC, Premoli AC 2010. Evidence of chloroplast capture in South American Nothofagus (subgenus Nothofagus, Nothofagaceae). Molecular Phylogenetics and Evolution 54: 235–242. 10.1016/j.ympev.2009.08.008
- Armstrong JM, Wylie AP 1965. A new basic chromosome number in the Family Fagaceae. Nature 206: 1340–1341. 10.1038/2051340b0
- Beever RE, Houliston GJ, Armstrong TTJ 2013. Geographic patterns of genetic variation in Cordyline australis; does fingerprinting recover phenotypic and phenological patterns? New Zealand Journal of Botany 51: 3–12. 10.1080/0028825X.2012.728136
- Botstein D, White RL, Skolnick M, Davis RW 1980. Construction of a genetic linkage map in man using restriction fragment length polymorphisms. American Journal of Human Genetics 32: 314–331.
- Cockayne L 1926. Monograph of the New Zealand beech forests. Part 1. The ecology of the forests and taxonomy of the beeches. Wellington, Government Printer.
- Cockayne L, Atkinson E 1926. On the New Zealand wild hybrids of Nothofagus. Genetica 8: 1–43. 10.1007/BF01481819
- Dawson MI 2000. Index of chromosome numbers of indigenous New Zealand Spermatophytes. New Zealand Journal of Botany 38: 47–150. 10.1080/0028825X.2000.9512673
- Department of Conservation undated. Piano Flat and Waikaia Forest. http://www.doc.govt.nz/upload/documents/parks-and-recreation/tracks-and-walks/southland/pianof-waikaiaforest.pdf (accessed 5 February 2014).
- Earl DA, von Holdt BM 2012. Structure harvester: a website and program for visualizing structure output and implementing the Evanno method. Conservation Genetics Resources 4: 359–361. 10.1007/s12686-011-9548-7
- Evanno G, Regnaut S, Goudet J 2005. Detecting the number of clusters of individuals using the software structure: a simulation study. Molecular Ecology 14: 2611–2620. 10.1111/j.1365-294X.2005.02553.x
- Falush D, Stephens M, Pritchard JK 2003. Inference of population structure: extensions to linked loci and correlated allele frequencies. Genetics 164: 1567–1587.
- Galbany-Casals M, Blanco-Moreno JM, Garcia-Jacas N, Breitwieser I, Smissen RD 2011. Genetic variation in Mediterranean Helichrysum italicum (Asteraceae: Gnaphalieae): do disjunct populations of subsp. microphyllum have a common origin? Plant Biology 13: 678–687.
- Govaerts R, Frodin DG 1999. World checklist and bibliography of Fagales. Kew, Royal Botanic Gardens.
- Haase P 1992. Isozyme variability and biogeography of Nothofagus truncata (Fagaceae). New Zealand Journal of Botany 30: 315–328. 10.1080/0028825X.1992.10412910
- Haase P 1993a. Isozyme studies of New Zealand Nothofagus species (southern beech) using leaf extracts. Silvae Genetica 42: 46–51.
- Haase P 1993b. Genetic variation, geneflow, and the ‘founder effect’ in pioneer populations of Nothofagus menziesii (Fagaceae), South Island, New Zealand. Journal of Biogeography 20: 79–85. 10.2307/2845741
- Haase P 1994. Genetic relationships and inferred evolutionary divergence in the New Zealand taxa of Nothofagus – results from isozyme analysis. Australian Systematic Botany 7: 47–55. 10.1071/SB9940047
- Heenan PB, Smissen RD 2013. Revised circumscription of Nothofagus and recognition of the segregate genera Fuscospora, Lophozonia, and Trisyngyne (Nothofagaceae). Phytotaxa 146: 1–31. 10.11646/phytotaxa.146.1.1
- Hill RS, Read J 1991. A revised infrageneric classification of Nothofagus (Fagaceae). Botanical Journal of the Linnean Society 105: 37–72. 10.1111/j.1095-8339.1991.tb00199.x
- Hooker JD 1844. Fagus cliffortioides. In: Hooker WJ ed. Icones plantarum 7. London, Hippolyte Baillière. Tab 673.
- Hurst JM, Stewart GH, Perry GLW, Wiser SK, Norton DA 2012. Determinants of tree mortality in mixed old-growth Nothofagus forest. Forest Ecology and Management 270: 189–199. 10.1016/j.foreco.2012.01.029
- Jones RC, Vaillancourt RE, Jordan GJ 2004. Microsatellites for use in Nothofagus cunninghamii (Nothofagaceae) and related species. Molecular Ecology Notes 4: 14–16. 10.1046/j.1471-8286.2003.00558.x
- Knapp M, Stöckler K, Havell D, Delsuc F, Sebastiani F, Lockhart PJ 2005. Relaxed molecular clock provides evidence for long-distance dispersal of Nothofagus (southern beech). PLoS Biology 3: e14. 10.1371/journal.pbio.0030014
- Latta RG 2003. Gene flow, adaptive population divergence and comparative population structure across loci. New Phytologist 161: 51–58. 10.1046/j.1469-8137.2003.00920.x
- Leathwick JR 1995. Climatic relationships of some New Zealand forest tree species. Journal of Vegetation Science 6: 237–248. 10.2307/3236219
- Leathwick JR 1998. Are New Zealand's Nothofagus species in equilibrium with their environment? Journal of Vegetation Science 9: 719–732.
- Leschen RA, Buckley TR, Harman HM, Schulmeister J 2008. Determining the origin and age of the Westland beech (Nothofagus) gap, New Zealand, using fungus beetle genetics. Molecular Ecology 17: 1256–1276. 10.1111/j.1365-294X.2007.03630.x
- Liu K, Muse SV 2005. PowerMarker: integrated analysis environment for genetic marker data. Bioinformatics 21: 2128–2129. 10.1093/bioinformatics/bti282
- Marchelli P, Gallo LA 2001. Genetic diversity and differentiation in a southern beech subjected to introgressive hybridization. Heredity 87: 284–293. 10.1046/j.1365-2540.2001.00882.x
- Marchelli P, Gallo LA 2004. The combined role of glaciation and hybridization in shaping the distribution of genetic variation in a Patagonian southern beech. Journal of Biogeography 31: 451–460. 10.1046/j.0305-0270.2003.01008.x
- Manos PS 1997. Systematics of Nothofagus (Nothofagaceae) based on rDNA spacer sequences (ITS): taxonomic congruence with morphology and plastid sequences. American Journal of Botany 84: 1137–1155. 10.2307/2446156
- Manos PS, Nixon KC, Doyle JT 1993. Cladistic analysis of restriction site variation within the chloroplast DNA inverted repeat region of selected Hamamelididae. Systematic Botany 18: 551–562. 10.2307/2419533
- Manos PS, Steele KP 1997. Phylogenetic analyses of “higher” Hamamelididae based on plastid sequence data. American Journal of Botany 84: 1407–1419. 10.2307/2446139
- Martin PG, Dowd JM 1993. Using sequences of rbcL to study phylogeny and biogeography of Nothofagus species. Australian Systematic Botany 6: 441–447. 10.1071/SB9930441
- Mayr E 1942. Systematics and the origin of species. New York, Columbia University Press.
- McGlone MS, Hall MJ, Wilmshurst J 2011. Seasonality in the early Holocene: extending fossil-based estimates with a forest ecosystem model. The Holocene 21: 517–526. 10.1177/0959683610385717
- McGlone MS, Mildenhall DC, Pole MS 1996. History and paleoecology of New Zealand Nothofagus forests. In: Veblen TT, Hill RS, Read J eds. The ecology and biogeography of Nothofagus forests. New Haven and London, Yale University Press. Pp. 83–125.
- Meurk CD, Hall GMJ 2006. Options for enhancing forest biodiversity across New Zealand's managed landscapes based on ecosystem modelling and spatial design. New Zealand Journal of Ecology 30: 131–146.
- Molloy BPJ, de Lange PJ, Clarkson BD 1999. Coprosma pedicellata (Rubiaceae), a new species from New Zealand. New Zealand Journal of Botany 37: 383–397. 10.1080/0028825X.1999.9512643
- Morgan-Richards M, Smissen RD, Shepherd LD, Wallis GP, Hayward JJ, Chan C et al. 2009. A review of genetic analyses of hybridisation in New Zealand. Journal of the Royal Society of New Zealand 39: 15–34. 10.1080/03014220909510561
- Nei M 1972. Genetic distance between populations. American Naturalist 106: 283–291. 10.1086/282771
- Ogden J 1989. On the coenospecies concept and tree migrations during the oscillations of the Pleistocene climate. Journal of the Royal Society of New Zealand 19: 249–262. 10.1080/03036758.1989.10427180
- Poole AL 1951. Hybrid southern beeches. New Zealand Journal of Forestry 6: 144–145.
- Poole AL 1958. Studies of New Zealand Nothofagus species III—the entire-leaved species. Transactions of the Royal Society of New Zealand 85: 551–564.
- Premoli AC, Mathiasen P, Acosta MC, Ramos VA. 2012. Phylogeographically concordant chloroplast DNA divergence in sympatric Nothofagus s.s. How deep can it be? New Phytologist 193: 261–275. 10.1111/j.1469-8137.2011.03861.x
- Pritchard JK, Stephens M, Donnelly P 2000. Inference of population structure using multilocus genotype data. Genetics 155: 945–959.
- Quiroga P, Russel RV, Premoli AC 2005. Evidencia morfológica e isoenzimática de hibridación natural entre Nothofagus antarctica y N. pumilio en el noroeste patagónico (Morphological and isozyme evidence of natural hybridization between Nothofagus antarctica and N. pumilio in northwestern Patagonia). Bosque 26: 25–32. 10.4067/S0717-92002005000200004
- Rieseberg LH, Church SA, Morjan CL 2004. Integration of populations and differentiation of species. New Phytologist 161: 59–69. 10.1046/j.1469-8137.2003.00933.x
- Sauquet HE, Ho SYW, Gandolfo MA, Jordan GJ, Wilf P, Cantrill DJ et al. 2012. Testing the impact of calibration on molecular divergence times using a fossil-rich group: the case of Nothofagus (Fagales). Systematic Biology 61: 289–313. 10.1093/sysbio/syr116
- Setoguchi H, Ono M, Doi Y, Koyama H, Tsuda M 1997. Molecular phylogeny of Nothofagus (Nothofagaceae) based on the atpB-rbcL intergenic spacer of the chloroplast DNA. Journal of Plant Research 110: 469–484. 10.1007/BF02506808
- Smissen RD, Breitwieser I, Ward JM 2006. Genetic diversity in the New Zealand endemic species Helichrysum lanceolatum (Asteraceae: Gnaphalieae). New Zealand Journal of Botany 44: 237–247. 10.1080/0028825X.2006.9513021
- Smissen RD, Heenan PB, Houliston G 2008. Genetic and morphological evidence for localised interspecific gene flow in Phormium (Hemerocallidaceae). New Zealand Journal of Botany 46: 287–297. 10.1080/00288250809509767
- Smissen RD, Morse CW, Prada D, Ramón-Laca A, Richardson SJ 2012. Characterisation of seven polymorphic microsatellites for Nothofagus subgenus Fuscospora from New Zealand. New Zealand Journal of Botany 50: 227–231. 10.1080/0028825X.2012.662903
- van Steenis CGGJ 1953. Results of the Archbold expeditions Papuan Nothofagus. Journal of the Arnold Arboretum 34: 301–374.
- Tamura K, Peterson D, Peterson N, Stecher G, Nei M, Kumar S 2011. MEGA5: molecular evolutionary genetics analysis using maximum likelihood, evolutionary distance, and maximum parsimony methods. Molecular Biology and Evolution 28: 2731–2739. 10.1093/molbev/msr121
- The Angiosperm Phylogeny Group 1998. An ordinal classification for the families of flowering plants. Annals of the Missouri Botanical Garden 85: 531–553. 10.2307/2992015
- Thomsen TH 2002. Biogeography of Nothofagus subgenus Fuscospora in the South Island of New Zealand inferred from chloroplast DNA. Unpublished MSc thesis. Christchurch, University of Canterbury. 123 p.
- Vergara R, Gitzendanner MA, Soltis DE, Soltis PS 2014. Population genetic structure, genetic diversity, and natural history of the South American species of Nothofagus subgenus Lophozonia (Nothofagaceae) inferred from nuclear microsatellite data. Ecology and Evolution 4: 2450–2471. 10.1002/ece3.1108
- Wardle JA 1984. The New Zealand beeches: ecology, utilisation and management. Wellington, New Zealand Forest Service. 447 p.
- Wardle P 1963. Evolution and distribution of the New Zealand flora, as affected by quaternary climates. New Zealand Journal of Botany 1: 3–17. 10.1080/0028825X.1963.10429318
- Wardle P, Harris W, Buxton RP 1988. Effects of glacial climates on floristic distribution in New Zealand 2. The role of long-distance hybridisation in disjunct distributions. New Zealand Journal of Botany 26: 557–564. 10.1080/0028825X.1988.10410661
- Wilcox MD, Ledgard NJ 1983. Provenance variation in the New Zealand species of Nothofagus. New Zealand Journal of Ecology 6: 19–31.
- Worth JP, Jordan GJ, McKinnon GE, Vaillancourt RE 2009. The major Australian cool temperate rainforest tree Nothofagus cunninghamii withstood Pleistocene glacial aridity within multiple regions: evidence from the chloroplast. New Phytologist 182: 519–532. 10.1111/j.1469-8137.2008.02761.x