
Abstract
Geographic coordinates and lithostratigraphic names have been assigned to 2255 limestone samples that were previously analysed for soluble carbonate content. This permits, for the first time, a comparative assessment of the purity of onland New Zealand limestones by location and age. The three purest limestone populations have median CaCO3 contents of 93–97 wt%, and are from: (1) Cambrian to Early Cretaceous basement terranes, (2) Eocene–Pliocene limestones of the Chatham Islands and (3) the Eocene Ototara Limestone. These have CaCO3 contents comparable with carbonates found in isolated submarine bank settings that lack appreciable siliciclastic detritus and biogenic silica. By contrast, New Zealand Oligocene–Early Miocene limestones (Whangarei, Te Kuiti, Mahurangi, Nile Group, Otekaike and Forest Hill stratigraphic units) have median CaCO3 contents of 71–91 wt%, comparable with New Zealand Paleocene–Eocene and Middle Miocene–Pleistocene limestones. Petrographic data from a subset of 52 Otekaike and Forest Hill limestones confirm that the non-carbonate content is mostly siliciclastic sand, not glauconite. The limestone purity data support, but do not on their own prove, a hypothesis of a terrigenous source (emergent land) during the Late Oligocene-Early–Miocene maximum marine inundation of Zealandia.
Introduction
Limestones are widespread in New Zealand (). Their geological, economic and scenic importance is indicated by an extensive stratigraphic, paleontological, paleo-environmental and geopreservation literature, as well as widespread quarrying (Morgan Citation1919; Nelson Citation1978; Kamp & Nelson Citation1988; Christie et al. Citation2001; Hood et al. Citation2003a,Citationb; Kenny & Hayward Citation2009 and references therein). One aspect of New Zealand limestone geology that has received little attention is limestone purity.

In this short synthesis paper, we summarise the purity of onland New Zealand limestones as revealed by their quantitatively determined soluble carbonate content. Earlier compilations of total rock limestone chemistry made by Morgan (Citation1919) and Kitt (Citation1962) reported wt% CaCO3 as determined by weight loss in cold dilute acid. This method is simple, is reliably standardised over large numbers of samples and different vintages of analysis and is also comparable with modern colorimetric methods of carbonate determination.
Our digital compilation is the first to assign accurate geographic coordinates and stratigraphic names to Morgan's and Kitt's data, and this is, therefore, the first paper to make and present a New Zealand-wide synthesis and comparison of limestone purity between different formations. We also present volumetric petrographic data on insoluble residues in limestones of Otago and Southland, and discuss the relevance of chemical and petrographic limestone purity to the Oligocene–Miocene paleogeography of Zealandia.
Data
Limestone purity
By definition, limestones contain more than 50% CaCO3 (e.g. Andrews Citation1982) and include marlstones. The small density differences between calcite, quartz and oligoclase feldspar (relative densities 2.71, 2.65 and 2.67, respectively) result in differences of <2% when total carbonate is calculated on a volume % compared with a weight % basis. Any rocks with a measured CaCO3 content <50% have been excluded from this paper.
Morgan (Citation1919) catalogued New Zealand limestone occurrences and presented c. 1002 whole-rock carbonate analyses. However, no geographic coordinates were given (there was no national grid in Morgan's day), and ages and stratigraphic names were not explicitly listed. A chemical data compilation of 1191 limestone analyses by Kitt (Citation1962) was even more sparsely documented, with no ages or formations given and with only some grid references.
Based on written location descriptions and quarry names, we were able to confidently assign geographic coordinates and lithostratigraphic names to a total of 661 samples analysed by Morgan (Citation1919), and 952 by Kitt (Citation1962). In addition, 682 limestones analysed by other workers that have stratigraphic and age information have been included in this study. These datasets are from Cooper (Citation1966), Waterhouse, (Citation1966), Warren (Citation1969), Moore (Citation1975), Moore & Belliss (Citation1979), Moore & Hatton (Citation1985), Browne & Wezenberg (Citation1988), Smith et al. (Citation1989) and unpublished data from the New Zealand Geological Survey Sedimentology Laboratory files. In rare cases where MgCO3 analyses were additionally reported, we have, for this paper, added wt% MgCO3 to wt% CaCO3 to give a total soluble carbonate fraction. For this study, we made just one new CaCO3 analysis ourselves: P80187, an Otekaike Limestone from the Hakataramea Valley, Otago (NZMG E2323589, N5613729), which has 89.1 wt% CaCO3, as determined by cold HCl dissolution.
After removing duplicates, we were left with a digitised dataset of 2255 New Zealand limestone samples analysed for CaCO3 labelled with 1 : 250 000 scale lithostratigraphic names as used by the QMAP project, e.g. Rattenbury et al. (Citation2006), Lee et al. (Citation2011), Rattenbury & Isaac (Citation2012). Some limestone formations are diachronous (e.g. Amuri) and accuracy and precision of age are limited to what can be inferred from lithostratigraphy. Furthermore, the bioclast content and textures (grainstone, micrite, etc.) of individual samples in our dataset are unknown and, again, generalisations must be made on the overall character of the rock unit. Sample numbers, grid references, locations, rock types, stratigraphic names and carbonate analyses have all been entered into the Petlab database (http://pet.gns.cri.nz). The data are also listed in the Supplementary Table File of this paper.
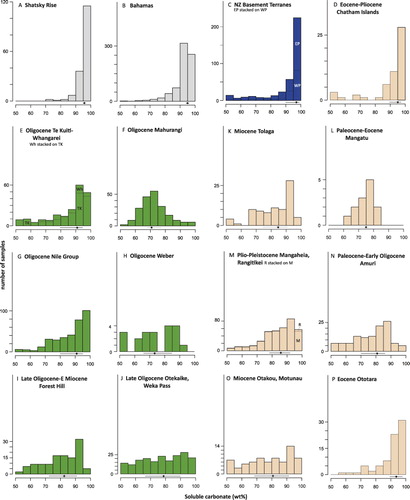
The vast majority of samples used in this paper were collected by people other than ourselves, and the analyses were done over the course of a century, with unknown sample sizes and in a number of different laboratories. So as not to over-interpret the data, we have categorised the samples into 5 wt% bins (). The relatively large amount of chemical data gives us confidence that it is representative of the formations. If there is any bias in the sampling it might be that purer limestones have been included at the expense of impure ones as the purpose of the investigations of Morgan (Citation1919) and others was to locate, identify and analyse good limestone resources.
Limestone petrography
The non-carbonate content of New Zealand Oligocene–Miocene limestones comprises varying proportions of glauconite (used here in a loose, undifferentiated sense for perigenic, authigenic and/or allogenic green phyllosilicate minerals), siliciclastic sand grains and mud matrix (; Ward & Lewis Citation1975; Nelson & Hume Citation1987; Hood et al. Citation2003a,Citationb). In order to provide more information on the nature of the insoluble limestone residues, volumetric data from South Island limestone sites were compiled.
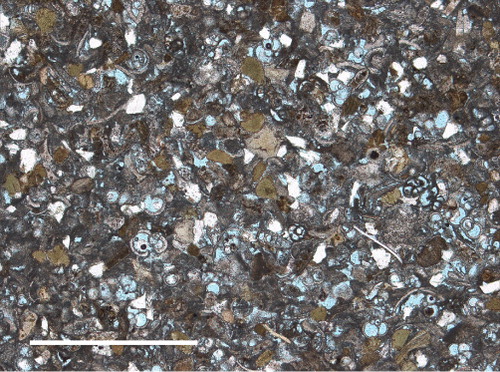
Table 1 Summary statistics of limestone CaCO3 datasets used in this paper. Major groupings listed in order of decreasing median CaCO3.
Smith et al. (Citation1989) reported visually estimated modes of 46 thin sections of the Oligocene Otekaike Limestone of Canterbury and North Otago. Hyden (Citation1979) gave point count data from 429 thin sections of Oligocene–Miocene Forest Hill Limestone of Southland. To augment these datasets, we point counted 12 samples of our own from Otago and Southland to give volumetric data from a total of 52 South Island limestone locations (). Despite the different count methods and parameters used by Hyden (Citation1979), Smith et al. (Citation1989) and ourselves, we believe the following seven parameters can be compared across datasets: clastic grains (> 60–100 µm in size) of: (1) bioclastic material, (2) glauconite (sensu lato), (3) siliciclastic material mainly quartz and feldspar; interstitial (matrix) grains of (4) mud (<60–100 µm in size), (5) micritic carbonate, (6) sparry calcite cement and (7) porosity. Some clastic grain and total rock parameters have been calculated and are also shown in and . We acknowledge that authigenic glauconite may have a minor degraded terrigenous mud progenitor, and that it can be difficult to discriminate terrigenous mud from micrite in normal thin sections.
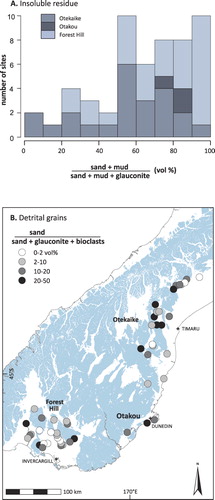
Table 2 Petrographic data for samples of Otekaike, Otakou and Forest Hill limestones.
The main terrigenous material seen by Hyden (Citation1979), Smith et al. (Citation1989) and in this study was angular grains of quartz and feldspar with lesser muscovite, chlorite, magnetite and epidote. Ward & Lewis (Citation1975) have noted angular grains of quartz, feldspar and other minerals in the Otekaike Limestone of South Canterbury.
Discussion
Limestone purity
We divided the onland New Zealand limestones into 18 populations based on geographic distribution and age (, ). Thirteen of the populations contain 40 or more samples and the larger datasets can be considered more reliably representative of their parent units. Histograms of carbonate content are presented in .
Reference samples
The British Geological Survey definition of limestone purity is: > 98.5% CaCO3 very high purity, 97.0–98.5% high purity, 93.5–97.0% medium purity, 85.0–93.5% low purity, 50.0–85.0% impure (Harrison Citation1992). For industrial (as opposed to agricultural) use, limestones generally have to be very high or high purity.
Almost all of the onland New Zealand limestone groupings show a wide range in carbonate content from near 50 to near 100% (, ). Of the 2255 New Zealand limestones analysed, only 6% are very high purity, 8% are high purity, 17% are medium purity, 24% are low purity and 45% are impure. Based on median carbonate values, three limestone populations, from the Cambrian to Early Cretaceous basement terranes, from the Chatham Islands and from the Eocene Ototara Limestone, are classified as medium purity. Five populations, from Nile, Te Kuiti, Whangarei, Mangaheia and Eocene Amuri units are low purity and the remaining ten populations are impure. Very high purity limestones only occur in nine populations and most of these occurrences are in the basement.
To compare the purity of onland New Zealand limestones with very pure limestone deposits around the world, we selected carbonate analyses from five studies of Cretaceous to Holocene calc-oozes and chalks from the Ocean Drilling Programme (ODP) literature and from Kitt's (Citation1962) Cook Islands and Niue data. These carbonates were deposited in geographically isolated (Cooks–Niue, Ontong Java, Shatsky) and/or continental carbonate bank settings (Bahamas, Maldives, Kerguelen) that, for the most part, lack epiclastic or tuffaceous input. The mainly tropical and pelagic limestones are not directly comparable with the bryozoan, echinoderm, algal and foraminifera Oligocene temperate bioclastic limestones of New Zealand (Nelson Citation1978), but do represent what might be considered to be end-member ‘pure’ limestone populations. All the reference limestone populations are highly positively skewed and unimodal with median carbonate contents > 93 wt% (, , ). However, even these datasets contain a measurable and distinct non-carbonate component, probably comprising terrestrial and extraterrestrial dust as well as siliceous bioclasts.
Basement and Chathams limestones
The Permian to Early Cretaceous limestones of New Zealand's Eastern Province accreted terrane basement (EP in ) are among the purest in the country. This can be explained in terms of their formation as reefs on subsiding intra-oceanic volcanoes, isolated from significant terrigenous input (e.g. Spörli & Gregory Citation1980; Silberling et al. Citation1988). The Ordovician limestones in the Western Province are sandwiched between siliciclastic strata and we attribute their high purity to an inferred origin in a carbonate rise setting, along with their relatively great thickness (>350 m, Cooper & Druce Citation1975). The Western Province limestones are also the only New Zealand population to contain substantial dolomite (Christie et al. Citation2001). Stylolite and vein formation, and recrystallisation during diagenesis and metamorphism may also have enhanced the purity of individual samples of some Cretaceous and older New Zealand limestones, at least on the scale of individual analysed hand samples.
Limestone deposition on the Chatham Islands was broadly coeval with known episodes of volcanism, although detailed examination shows that limestone accumulated during short intervals of volcanic quiescence (James et al. Citation2011). Limestones do grade into calcareous tuffs and the fact that our dataset of analysed limestones is relatively pure () can probably be explained by a general sampling bias to analyse purer limestones, James et al.'s (Citation2011) antipathetic relationship between volcanism and limestone deposition and/or the geographic isolation of the Chathams from land, which limited any clastic input.
Late Oligocene limestones
Limestones of Late Oligocene to Early Miocene age are widespread throughout New Zealand and formed during the interval of maximum marine inundation of Zealandia (Landis et al. Citation2008). Populations from six areas are shown in the green histograms in –). These have substantially lower median and larger interquartile ranges of carbonate content than either the basement or Chathams limestones, indicative of overall higher insoluble impurities. The western groups (Te Kuiti–Whangarei, Nile and Forest Hill) are demonstrably more pure than the eastern ones (Mahurangi, Weber, Otekaike), as shown by their higher median carbonate content and positively skewed distributions. Some, but by no means all, of the non-carbonate content in these limestones is due to the presence of glauconite (Ward & Lewis Citation1975; , ). However, shows that, at most sample sites of South Island limestones, most of the insoluble residue consists of extra-basinal sand and mud rather than intra-basinal glauconite. shows that the percentage of quartzofeldspathic sand (compared with other sand-sized bioclasts and glauconite) is both measurable and widespread. Previous petrographic studies of North Island limestones have also shown appreciable terrigenous sand and mud within Oligocene Te Kuiti Group limestones (Nelson Citation1977; Nelson & Hume Citation1987; Nelson et al. Citation1994; Hood et al. Citation2003a,Citationb). Nelson & Hume (Citation1987) reported a bimodal distribution of Te Kuiti Group limestone purity with a minimum at 70% soluble carbonate, a result weakly discernable in our separate dataset ().
Pre- and post-Oligocene limestones
Visually prominent limestones of Plio-Pleistocene age occur in the East Coast region of the North Island (Mangaheia Group, formerly ‘Te Aute’ limestones). Limestone is also a minor component in Neogene and Paleogene stratal successions in other New Zealand sedimentary basins. These are shown as orange histograms in –. The Eocene Ototara Limestone stands out as the most pure of these populations (), but all the others have appreciable amounts of insoluble material. Speculatively, tuffaceous (ash) input may have been a major control on Tolaga and Mangaheia Groups limestone purity as they were deposited east and southeast of belts of subduction-related Neogene volcanism (Carter et al. Citation2004).
Oligocene–Miocene paleogeography
The Late Oligocene–Early Miocene (late Duntroonian stage to Waitakian stage, 26–23 Ma) is generally recognised as the time of maximum marine inundation (MMI) of the Zealandia continent (King Citation2000; Landis et al. Citation2008 and references therein). The median siliciclastic sand/total clastic contents of the Otekaike and Forest Hill limestones of this age are 9% and 6%, respectively (data of ; see also ). The consistently angular shape of the grains () argues against recycling from older siliciclastic strata. Thus, clastic grains were seemingly being supplied to areas of Otekaike and Forest Hill limestone deposition, and being locked up as the limestones were deposited. The geographic distribution of siliciclastic sand content in Otekaike and Forest Hill limestones () does not show any clear pattern or gradient, e.g. towards a paleo-shoreline. However, there is some suggestion that Otekaike limestones become more pure to the east and that Forest Hill limestones become more pure to the south. The geographically intermediate and slightly younger Otakou Group limestones include the Milburn Limestone. Landis et al. (Citation2008) noted that local schist basement could not have contributed K-feldspar and hornblende to the sand fraction of the Milburn Limestone but did admit the possibility of contemporaneous erosion of a distant and southwesterly source to supply clastic detritus during limestone deposition.
shows the secular change in Cenozoic limestone purity with time in the eastern North Island and the eastern South Island as revealed by our datasets. In both regions, the Late Oligocene limestones (Weber and Otekaike) are among the least pure although there is no dramatic shift in limestone purity from the Paleocene to the Pliocene, across the maximum flooding interval. A point to be taken from is that, with the presence of demonstrable pre- and post-Oligocene land in New Zealand, the purity of the Oligocene limestones does not increase, as might have been the case if the sediment supply had decreased or ceased for any significant period.
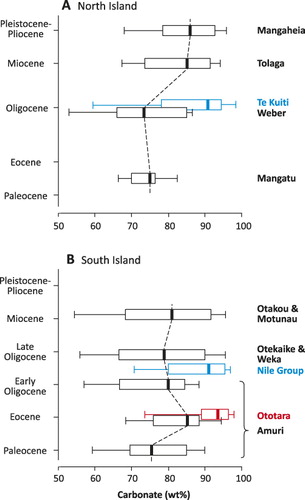
As mentioned above, the Oligocene to Early Miocene limestone populations of western New Zealand (Whangarei, Te Kuiti, Nile, Forest Hill) are slightly more pure than those in eastern New Zealand (Mahurangi, Weber, Otekaike–Weka Pass) (, , blue boxes in ). Without petrographic data to supplement the soluble carbonate data, it is difficult to know how to interpret this observation. However, it does suggest an overall different paleoenvironment for the Oligocene of western New Zealand versus that in eastern New Zealand. If sediment supply is the reason then perhaps overall less (and/or more channelised and localised) sediment was reaching areas of limestone deposition to the west than to the east. Speculatively, the western marine shelves could have been more faulted than those to the east, creating offshore sediment traps separated by areas of purer limestone deposition. The eastern basins are, in general, deeper water and may have facilitated more continuous, more even dispersal of mud-grade terrigenous sediment and siliceous microfossil material to areas of limestone deposition. Lewis & Belliss (Citation1984) have identified Late Oligocene karstic surfaces in the Otekaike Limestone that indicates at least local emergence during limestone deposition.
We tentatively interpret the appreciable siliciclastic angular sand content of widespread New Zealand Oligocene–Miocene limestones, as revealed by both chemical (, ) and petrographic (–) data, to indicate the presence of nearby contemporaneous landmasses that steadily supplied clastic sediment to the Zealandia continental shelves and slopes where limestones accumulated. How persistent, high or areally extensive the landmasses might have been is beyond the scope of this study. Systematic provenance work on a basin-by-basin basis, integrated with other geological datasets (e.g. limestone depositional setting, fossil assemblages, diagenetic observations), would provide useful further data on this, and also on the various controls of limestone purity.
Conclusions
Limestones are marine sedimentary rocks indicative of high biological productivity and limited clastic input. A digital compilation of 2255 New Zealand limestone chemical analyses has allowed us to compare the single, simple parameter of limestone purity (soluble carbonate content) of onland lithostratigraphic units across the entire country.
Our study shows that most onland New Zealand limestone populations are impure, low purity and medium purity, with individual very high purity samples present in only some formations. The purest New Zealand limestone populations have median CaCO3 contents of 93–97 wt% and come from Cambrian to Cretaceous basement terranes, Eocene–Pliocene strata of the Chatham Islands and the Eocene Ototara Limestone. Most of these limestones were deposited in geographically isolated marine settings and have carbonate contents comparable to calc-oozes found in carbonate banks remote from clastic sources.
By contrast, the majority of New Zealand Paleocene–Pleistocene limestones, including those deposited in the Late Oligocene–Early Miocene maximum marine transgression interval, are of low purity and/or impure (median CaCO3 contents of 71–91 wt%). In the case of the Late Oligocene–Early Miocene Otekaike and Forest Hill limestones, impurities are identified as variable terrigenous sand (and glauconite) content. Although other explanations are possible, we interpret the widespread occurrence of impure Oligocene–Miocene limestones to support the presence of land during maximum marine inundation of Zealandia.
The limestone purity dataset doubtless can be put to many further uses. Spatial clustering and variability in purity on a local scale may have limestone resource assessment implications. The relationship of limestone purity to karst landscape development, bioproductivity and fossil assemblages, bedforms and sedimentation rate, and to tectonic setting can all now potentially be explored in future studies.
Supplementary data
Supplementary file 1. Excel spreadsheet containing location, carbonate and stratigraphic name data used in this paper.
Excel spreadsheet containing location, carbonate and stratigraphic name data used in this paper.
Download MS Excel (1.4 MB)Acknowledgements
Discussions with Kathie Marsaglia and Daphne Lee helped formulate our ideas. The manuscript was improved by comments from Greg Browne, Phil Glassey, Kathie Marsaglia and Cam Nelson. We acknowledge the use of ‘R’ routines on Patrick Wessa's website (wessa.net) to plot histograms. Supported by the New Zealand Marsden Fund.
References
- Andrews PB 1982. Revised guide to recording field observations in sedimentary sequences. New Zealand Geological Survey Report 102.
- Browne GH, Wezenberg U 1988. Mineral resources of South Canterbury. New Zealand Geological Survey Report M164.
- Carter L, Alloway BV, Shane P, Westgate J 2004. Deep-ocean record of major late Cenozoic rhyolitic eruptions from New Zealand. New Zealand Journal of Geology and Geophysics 47: 481–500. 10.1080/00288306.2004.9515071
- Christie AB, Thompson BN, Brathwaite RL 2001. Mineral commodity report 21: limestone, marble and dolomite. New Zealand Mining 29: 6–25.
- Cooper RA 1966. Limestone resources of the Otago area. New Zealand Geological Survey Report 15.
- Cooper RA, Druce EC 1975. Lower Ordovician sequence and conodonts, Mount Patriarch, north-west Nelson, New Zealand. New Zealand Journal of Geology and Geophysics 18: 551–582. 10.1080/00288306.1975.10421557
- Ehrmann WU 1991. Implications of sediment composition on the southern Kerguelen Plateau for paleoclimate and depositional environment. Proceedings of the Ocean Drilling Program, Scientific Results 119: 185–210.
- Harrison DJ 1992. Industrial minerals laboratory manual: limestone. British Geological Survey Technical Report WG/92/29.
- Hood SD, Nelson CS, Kamp PJJ 2003a. Lithostratigraphy and depositional episodes of the Oligocene carbonate-rich Tikorangi Formation, Taranaki Basin, New Zealand. New Zealand Journal of Geology and Geophysics 46: 363–386. 10.1080/00288306.2003.9515015
- Hood SD, Nelson CS, Kamp PJJ 2003b. Petrogenesis of diachronous mixed siliciclastic-carbonate megafacies in the cool-water Oligocene Tikorangi Formation, Taranaki Basin, New Zealand. New Zealand Journal of Geology and Geophysics 46: 387–405. 10.1080/00288306.2003.9515016
- Hyden FM 1979. Mid-Tertiary temperate shelf limestones, Southland, New Zealand. Unpublished PhD thesis. Dunedin, University of Otago. 487 p.
- Ingersoll RV, Bullard TF, Ford RL, Grimm JP, Pickle JD, Sares SW 1984. The effect of grain size on detrital modes: a test of the Gazzi-Dickinson point-counting method. Journal of Sedimentary Petrology 54: 103–116.
- James NP, Jones B, Nelson CS, Campbell HJ, Titjen J 2011. Cenozoic temperate and sub-tropical carbonate sedimentation on an oceanic volcano: Chatham Islands, New Zealand. Sedimentology 58: 1007–1029. 10.1111/j.1365-3091.2010.01193.x
- Kamp PJJ, Nelson CS 1988. Nature and occurrence of modern and Neogene active margin limestones in New Zealand. New Zealand Journal of Geology and Geophysics 31: 1–20. 10.1080/00288306.1988.10417807
- Kenny J, Hayward B 2009. Karst in stone: karst landscapes in New Zealand. Geoscience Society of New Zealand Guidebook 13. Wellington, Geoscience Society of New Zealand.
- King PR 2000. Tectonic reconstructions of New Zealand 40 Ma to the present. New Zealand Journal of Geology and Geophysics 43: 611–638. 10.1080/00288306.2000.9514913
- Kitt W 1962. Survey of limestone analyses 1917–1961. Wellington, Dominion Laboratory Report DL 2060.
- Landis CA, Campbell HJ, Begg JG, Mildenhall DC, Paterson AM, Trewick SA 2008. The Waipounamu erosion surface: questioning the antiquity of the New Zealand land surface and terrestrial fauna and flora. Geological Magazine 145: 173–197. 10.1017/S0016756807004268
- Lee JM, Bland KJ, Townsend DB, Kamp PJJ 2011. Geology of the Hawkes Bay area. Institute of Geological and Nuclear Sciences 1:250,000 Geological Map 8.
- Lewis DW, Belliss SE 1984. Mid Tertiary unconformities in the Waitaki Subdivision, north Otago. Journal of the Royal Society of New Zealand 14: 251–276. 10.1080/03036758.1984.10426303
- Malone MJ 2000. Data report: geochemistry and mineralogy of periplatform carbonate sediments: sites 1006, 1008 and 1009. Proceedings of the Ocean Drilling Program, Scientific Results 166: 145–152.
- Malone MJ 2005. Data report: geochemistry of fine fraction carbonate sediments, Shatsky Rise (ODP Leg 198). Proceedings of the Ocean Drilling Program, Scientific Results 198: 1–18. http://www-odp.tamu.edu/publications/198_SR/VOLUME/CHAPTERS/121.PDF (accessed 14 July 2013).
- Malone MJ, Baker PA, Burns SJ, Swart PK 1990. Geochemistry of periplatform carbonate sediments, Leg 115, Site 716 (Maldives Archipelago, Indian Ocean). Proceedings of the Ocean Drilling Program, Scientific Results: 115: 647–659.
- Moore PR 1975. The limestone resources of Wairarapa. Lower Hutt: New Zealand Geological Survey. New Zealand Geological Survey Report 73.
- Moore PR, Belliss SE 1979. The limestone resources of southern Hawke's Bay and northern Wairarapa. New Zealand Geological Survey Report 87.
- Moore PR, Hatton BA 1985. Limestone resources of northern and central Hawke's Bay. Lower Hutt, New Zealand Geological Survey. New Zealand Geological Survey Record 2.
- Morgan PG 1919. The limestone and phosphate resources of New Zealand (considered principally in relation to agriculture). Part 1, Limestone. New Zealand Geological Survey Bulletin 22.
- Nelson CS 1977. Grain-size parameters of insoluble residues in mixed terrigenous-skeletal carbonate sediments and sedimentary rocks: some New Zealand examples. Sedimentology 24: 31–52. 10.1111/j.1365-3091.1977.tb00118.x
- Nelson CS 1978. Temperate shelf carbonate sediments in the Cenozoic of New Zealand. Sedimentology 25: 737–771. 10.1111/j.1365-3091.1978.tb00328.x
- Nelson CS, Hume TM 1987. Paleoenvironmental controls on mineral assemblages in a shelf sequence: Te Kuiti Group, South Auckland, New Zealand. New Zealand Journal of Geology and Geophysics 30: 343–362. 10.1080/00288306.1987.10427540
- Nelson CS, Kamp PJJ, Young HR 1994. Sedimentology and petrography of mass-emplaced limestone (Orahiri Limestone) on a late Oligocene shelf, western North Island, and tectonic implications for eastern margin development of Taranaki Basin. New Zealand Journal of Geology and Geophysics 37: 269–285. 10.1080/00288306.1994.9514621
- Rattenbury MS, Isaac MJ 2012. The QMAP 1:250 000 Geological Map of New Zealand project. New Zealand Journal of Geology and Geophysics 55: 393–405. 10.1080/00288306.2012.725417
- Rattenbury MS, Townsend DB, Johnston MR ( compilers) 2006. Geology of the Kaikoura area. Institute of Geological & Nuclear Sciences 1:250,000 Geological Map 13.
- Shipboard Scientific Party. 1990. Leg Synthesis: sea-level changes and fluid flow on the Great Bahama Bank slope. Proceedings of the Ocean Drilling Program, Initial Reports: 166: 13–22.
- Shipboard Scientific Party. 2001. Leg 192 summary. Proceedings of the Ocean Drilling Program, Initial Reports: 192: 1–75. http://www.odp.tamu.edu/publications/192_IR/VOLUME/CHAPTERS/IR192_01.PDF (accessed 14 July 2013).
- Silberling NJ, Nichols KM, Bradshaw JD, Blome CD 1988. Limestone and chert in tectonic blocks from the Esk Head subterrane, South Island, New Zealand. Geological Society of America Bulletin 100: 1213–1223. 10.1130/0016-7606(1988)100%3C1213:LACITB%3E2.3.CO;2
- Smith VR, Lobb AJ, Field BD 1989. Reconnaissance petrological study of the Late Oligocene to Early Miocene Otekaike Limestone, north Otago and southern Canterbury, New Zealand. New Zealand Geological Survey Report SL19.
- Spörli KB, Gregory MR 1980. Significance of Tethyan fusulinid limestones of New Zealand. In: Cresswell MM, Vella P eds. Gondwana five. Rotterdam, AA Balkema. Pp 223–229.
- Ward DM, Lewis DW 1975. Paleoenvironmental implications of storm-scoured, ichnofossiliferous, Mid-Tertiary limestones, Waihao district, South Canterbury, New Zealand. New Zealand Journal of Geology and Geophysics 18: 881–908. 10.1080/00288306.1975.10423533
- Warren G 1969. Summary of limestone resources, Canterbury and southern Marlborough. New Zealand Geological Survey Report 43.
- Waterhouse BC 1966. The limestone resources of the Auckland District (from Wellsford to Mercer, including Coromandel). Auckland, New Zealand Geological Survey Report 10.