
Abstract
Quantitative sea-level reconstructions using Holocene foraminifera are usually based on transfer function estimates of elevation derived from the tidal-elevation-related zonation of modern salt marsh foraminifera at the same site. Many New Zealand salt marshes are actively eroding as a result of recent sea-level rise exceeding sediment supply, making it difficult to find transects for modern analogue studies that are unaffected by erosion at their seaward ends. At Waikawa Harbour, South Island, New Zealand we show that reworked salt marsh foraminifera from the eroding bank have been mixed in significant quantities with in situ faunas: (1) in the sand flat seaward of the marsh; (2) in the spring tidal marsh on top of the 80-cm-high bank (together with mid tide foraminifera from the sand below the bank); and (3) transported laterally into a nearby non-eroding rush marsh at lower elevation. The fibrous organic-rich salt marsh mud of the bank has been undermined by erosion and large blocks have collapsed to a lower level on the sand flat where the in situ relict faunas are being mixed with newly colonised lower elevation salt marsh foraminifera. These studies show that eroding salt marshes may result in substantial reworking and mixing of foraminiferal tests into the modern faunas thereby compromising their use in sea-level reconstructions. This study prompted us to revisit part of a cored sequence at nearby Catlins Lake and reinterpret a previously inferred earthquake displacement (5–4.5 ka) to be the result of an eroding and collapsing salt marsh bank instead.
Introduction
Salt marsh foraminifera are being used increasingly in studies of Holocene sea-level histories (e.g. Horton Citation1999; Gehrels et al. Citation2008; Kemp et al. Citation2009; Callard et al. Citation2011; Hayward et al. Citation2012) and earthquake displacements (e.g. Guilbault et al. Citation1995; Hayward et al. Citation2004a, Citation2010a,Citationb,Citationc; Hawkes et al. Citation2010; Clark et al. Citation2011). This research usually relies on foraminiferal census data from samples taken along transects through the topographical range of the local marsh. Transfer functions are developed that relate foraminiferal composition (relative abundance of species in dead assemblage of tests) to tidal elevation and are used to estimate the former accumulation level of fossil foraminiferal faunas in nearby cores of Holocene salt marsh sediment. This approach is appropriate as long as the full range of foraminiferal composition found in the core is captured by the transect(s) of modern analogue samples.
This approach encounters problems where environmental changes have occurred at the study site during the age span of the core. Natural or human changes to the surrounding topography or vegetation cover could have impacted the local tidal range, salinity, groundwater level or pH, all of which can cause changes in foraminiferal composition and/or their tidal zonation.
Salt marshes are rapidly eroding at many places around the New Zealand coast, presumably as a result of sediment supply not keeping pace with sea-level rise (e.g. Hayward et al. Citation2010c; Grenfell et al. Citation2012). Field observations give little indication of eroded sediment being thrown up into the uneroded parts of these marshes. At least one of these earlier studies has however shown that this encroaching erosion appears to be resulting in foraminiferal tests, from the eroding salt marsh and approaching unvegetated mudflats, being transported up into and mixing with the modern salt marsh faunas (e.g. Grenfell et al. Citation2012), potentially impacting the composition of the modern analogue transect faunas and their accuracy in estimating palaeotidal elevations.
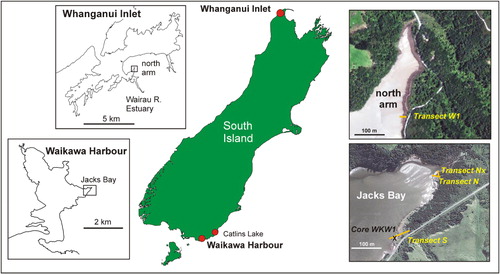
This paper assesses the extent of reworking and mixing of transported foraminiferal tests in an eroding salt marsh at Waikawa Harbour, southern New Zealand and compares the zonation with that in a non-eroding salt marsh at Whanganui Inlet, northern South Island, 800 km away (). We investigate the impact of this mixing for palaeo-sea-level studies by comparing faunally derived modern analogue technique (MAT) tidal elevation estimates (using a large dataset from non-eroding salt marshes and intertidal harbour flats) with the actual transect elevations. To assist in understanding the source of reworked foraminifera we also document the foraminiferal faunas down through the salt marsh sequence in a core taken just behind the eroding face.
Study sites
Waikawa Harbour salt marsh
The main focus of this study is the eroding salt marsh at the northeast corner of Jacks Bay (46°37.5′S, 169°10.1′E), Waikawa Harbour, Southland, New Zealand (). The bay is situated on the east side of the 4.5 km long by 2 km wide harbour. It is generally sheltered but can be subject to choppy waves generated within the harbour during times of strong winds from the west. Salinity in the Jacks Bay portion of the harbour would normally be close to 35 psu, but surface layers may become more brackish on incoming tides during rainstorm events.
Jacks Bay is a shallow intertidal embayment filled with mid–low tidal sand and backed by a 60–100 cm high bank that is eroding into the remnants of a formerly more extensive salt marsh (). A small stream flows into the northeast corner of the bay and, south of this, the bank extends continuously for 300 m to where it abuts Yorke Rd. Two transects of sediment samples were taken through the remnants of this salt marsh (): one at the north end (transect N) and the other at the south (transect S). Later a branch transect (Nx) was taken off the northern transect to sample through a more complete and un-eroding rush zone (). Transect S extends from the salt marsh over the eroding bank with the lowest two samples taken in the mid tidal sand below ().
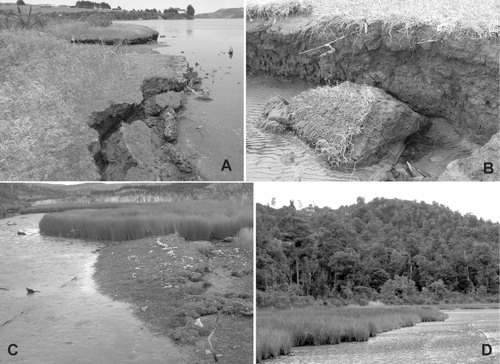
Along this 300 m stretch, the bank stratigraphy comprises c. 60 cm of organic-rich sandy mud with fibrous layers (rush bases) overlying c. 20 cm of muddy sand sitting on 20+ cm of clean sand. This sequence was sampled by core WKW1 taken in salt meadow on the line of transect S, c. 2 m landward of the eroding bank at 242 cm above mean low water springs (MLWS). Erosion occurs when the sea is above mid tide level and particularly when there is wave action (up to 30–50 cm high) during times of strong winds. Erosion by the lapping waves is faster in the loose sand at the bottom of the 80 cm high bank than in the more coherent organic-rich fibrous mud above. In many places undermined blocks or sections of the upper bank are in a state of collapse (, ). In the north near the stream (lower portion of transect N) a 4 × 2 m section of organic-rich mud, capped by salt meadow, appears to have been undermined, probably during a storm and possibly by the stream channel in flood. The section () has collapsed by c. 40–60 cm and tilted to the north; at the time of study it was stabilised by the build-up of beach sand around its sides. Smaller blocks of collapsed fibrous organic-rich mud lie on the sand up to 2 m out from the base of the bank; at these lower levels they are gradually being eaten away by the gentle wave action.
The remnant salt marsh extending landwards from the top of the bank (, ) comprises patches of salt meadow dominated by sea primrose (Samolus repens), glasswort (Sarcocornia quinqueflora) and remuremu (Selliera radicans) that passes up into a slightly higher 5–40 m wide zone of long grass with patches of jointed rush (Apodasmia similis). Appearing at around highest astronomical tide level (HAT) are patches of the shrub Plagianthus divaricatus and New Zealand flax (Phormium tenax) which become denser and are joined by less-salt-tolerant plants to form a zone of dense scrub above the influence of most king high tides. In the north there is an area of non-eroding sand that slopes down from the patchy shrub zone (transect N) to the stream and is colonised by dense jointed rushes (transect Nx; , ).
Whanganui Inlet salt marsh
To compare with the eroding salt marsh at Waikawa, we also studied the foraminiferal zonation in a non-eroding salt marsh in an area of near pristine natural habitat in the north bay of the estuary of the Wairau River (40°36.0′S, 172°34.9′E), Whanganui Inlet, northwest Nelson (). Whanganui Inlet is a 12 km long by 1.5 km wide harbour with several small rivers flowing into it from the east. One of these, the Wairau River and its estuary, enters the inlet directly opposite its opening to the Tasman Sea. The north arm of the estuary is a 1 km long, sand-filled, triangular embayment located 1 km inside the estuary mouth. A tiny stream enters this arm at its head but does not influence the salinity, which is normally quite high (30–35 psu), except at times of rainstorms when the surface layers at high tide could be brackish as a result of flood runoff down the river.
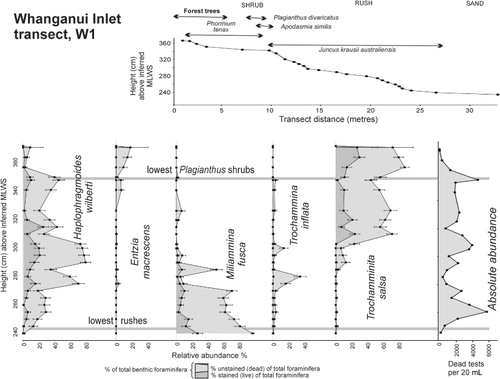
The north arm is surrounded by tall native forest (). The sand flats extend to just above mid tide level and have a coastal fringe of sea rush (Juncus krausii australiensis) passing up near spring high tide level into jointed rush and a shrub zone dominated by flax and Plagianthus (, ). Transect W1 passes through this salt marsh from forest floor to mid tide sand close to the head of the north arm.
Methods
Field sampling
Modern sediment samples were collected from transects oriented normal to the tide line and extending from above the HAT tide level down through the vegetated high tidal zone, onto the edge of the mid tidal sand flats. At each transect station two 10 mL sediment plugs (total 20 mL) were obtained at a depth of 1–2 cm beneath the surface using a short length of PVC tubing (3.6 cm inside diameter). Core WKW1 was taken by vibracoring with a 7.6 cm diameter aluminium tube. The core was split, logged and sampled soon after extraction. Small push tube samples (20 mL) were taken along one half of the core for foraminiferal studies.
Foraminiferal sample processing
Within 24 hours of collection all transect samples, and those from the upper 25 cm of the core, were soaked in a solution of rose Bengal and ethanol to stain for protoplasm to identify ‘live’ specimens. The stain was washed out after 24 hours. Both transect and core samples were washed over a 63 µm sieve to remove the mud. The retained sand fraction was dried and micro-split to an amount containing approximately 100–200 unstained benthic foraminifera for identification and census counts. For the purposes of this study (with low diversity faunas), a larger census count is statistically unnecessary to clearly identify the major changes that have occurred in the relative abundances of the few species (Patterson & Fishbein Citation1989). Stained and unstained specimens were counted separately. In some samples the total number of specimens found was low. Faunas with <50 unstained specimens were excluded from elevation estimates.
The advantages of drying samples for examination are the ease and speed of splitting, picking, and mounting specimens on slides. It also maintains consistency with the method used to extract our other analogue and core specimens previously. These advantages more than outweigh the disadvantages (e.g. potential loss of some thin-walled agglutinated elements, harder-to-identify stained specimens). The inaccuracy of rose Bengal staining for recognising living calcareous, deep-sea foraminifera at the time of sampling has been documented by Bernhard et al. (Citation2006), who found that rose Bengal stain overestimated live specimens by a factor of two. Figueira et al. (Citation2012) found no statistical difference between the number of rose-Bengal-stained and CellTracker™ green-stained agglutinated foraminifera from the salt marsh of Waikawa Harbour.
Species were identified with reference to Hayward et al. (Citation1999a), and census counts were standardised as percentages of the dead or total assemblage (Appendix; see also Supplementary file 1).
Surveying and tidal elevations
All elevations used in this study for Waikawa Harbour have been surveyed relative to MHWS level and expressed as centimetres above MLWS. This datum was determined by recording the high tide level during visits and calibrating this to the observed high tidal elevation at the same time at Bluff, the nearest permanent tide gauge. The predicted and actual high tide levels for remote Whanganui Inlet could not be directly compared with that at Waikawa Harbour. To enable elevational correlations between Whanganui and Waikawa we have used the elevations at each place of the lowest level of the Plagianthus shrub zone, and where present and not eroding the lowest level of the rush zone (Transects Nx and W1).
As the study sites have different tidal ranges, transect elevations had to be standardised before they could be used for tidal elevational estimates. This was achieved by converting the tidal elevations to proportions of their respective mean spring tidal ranges (STLI, Hayward et al. Citation2004b). The derived elevation estimates and errors in terms of the proportional tidal range were reconverted to the actual tidal range (in centimetres) of the site being investigated. At Waikawa Harbour the mean spring tidal range (between MHWS and MLWS) is 200 cm; at Whanganui Inlet it is 290 cm. The elevational height between the base of the Plagianthus and rush zones is 75 cm at Waikawa (0.37 of spring tidal range) and 110 cm at Whanganui (0.37 of spring tidal range).
Abbreviations of tidal elevations are given in .
Table 1 Abbreviations of terms used for tidal levels.
Tidal elevation estimates
The modern analogue technique (MAT) was used to estimate elevations for transect sample faunas (e.g. Hayward et al. Citation2004b) from Waikawa and Whanganui Inlet (see Supplementary file 2). The MAT estimates were derived from a set of 548 intertidal modern analogue faunal samples from New Zealand harbours and estuaries (Supplementary file 3). The mean elevation and standard error of the five compositionally most similar faunas (chord similarity coefficient) was used as the tidal elevation estimate of the sample and their elevational range used as an indicator of potential accuracy.
Results
Density of foraminiferal tests
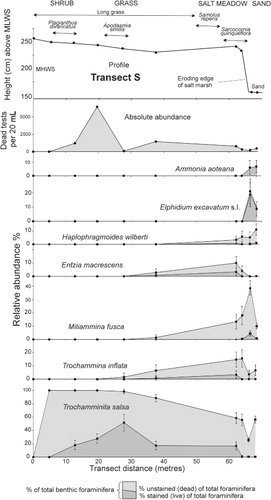
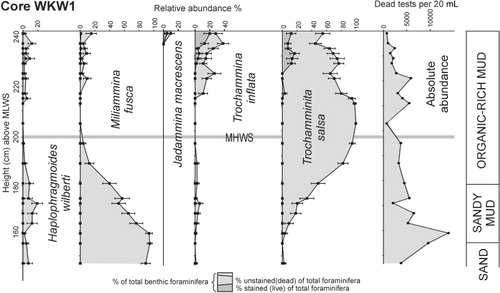
The absolute abundances of dead foraminiferal tests are similar in the salt marsh portion of all transects, mostly within the range 200–2000 per 20 mL (–). Highest densities (all tests of Trochamminita salsa) occur close to HAT (7200 per 20 mL) in transect S (). Densities decline through the lower part of the rush zone to values of 60–500 per 20 mL in the un-vegetated sand flats. Similarly densities decline to zero above the limits of predicted saltwater incursion (above HAT). In core WKW1 dead test densities are mostly 1500–6000 per 20 mL (below the upper 5 cm), reflecting the accumulation of dead tests over time within the live infaunal zone (upper 15 cm). Maximum dead test densities (14,000 per 20 mL) in the core occur at 162 cm above MLWS and possibly reflect an interval of low sediment accumulation ().
Foraminiferal faunal composition
The distributions of stained (live) and unstained (dead) tests of the dominant foraminiferal species in the Whanganui (W1) and Waikawa transects (S, N, Nx) and the Waikawa eroding salt marsh sequence (core WKW1) are shown in – together with the salt marsh vegetation zonation. All the salt marsh foraminifera are agglutinated and dominated by Trochammnita salsa, Haplophragmoides wilberti and Miliammina fusca, which are characteristic of lower salinity marshes in New Zealand (Hayward et al. Citation1999a,Citationb). In lower numbers are Trochammina inflata and Entzia macrescens, species that occur more abundantly at near-normal marine salinities (Hayward et al. Citation1999a). These relatively low-diversity marsh faunas reflect the cooler higher latitudes of the South Island with diversity increasing in the North Island (e.g. Hayward & Hollis Citation1994; Hayward et al. Citation1999b).
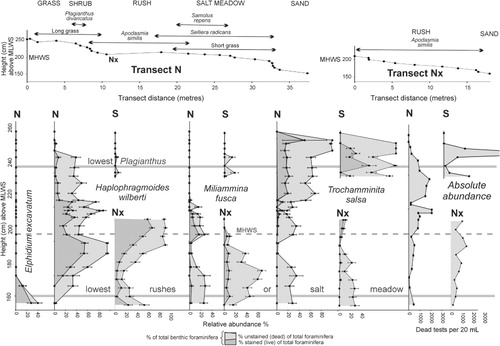
In the non-eroding Whanganui transect W1, the three dominant species are elevationally zoned with T. salsa dominant in the shrub and upper rush zones, H. wilberti in the middle rush zone and M. fusca in the lower rush and sand zones. Stained (live) specimens occur with the dead throughout the range of dominance of all three species and indicate that they are predominantly in situ with live T. salsa and M. fusca not overlapping, but live H. wilberti overlapping with both (). This same distribution pattern is repeated in Waikawa transects N and Nx, although not as precisely as unstained specimens of T. salsa comprise 20–30% of the total fauna in the lower rush and sand zones () where they are absent in W1 ().
Waikawa transect S is divided into two parts by the 80 cm high eroding bank. The upper long grass and salt meadow portion is strongly dominated by stained and unstained in situ T. salsa (–). The salt meadow near the top of the eroding bank additionally contains 2–15% of each of M. fusca, T. inflata, E. macrescens and H. wilberti (). The two sand samples near the base of the bank are co-dominated (10–50% each) by T. salsa, M. fusca and Elphidium excavatum with fewer specimens of H. wilberti, T. inflata and Ammonia aoteana (). Virtually all the specimens of the two calcareous species (A. aoteana, E. excavatum) in the sand samples were stained as were the E. excavatum specimens (10–25% of fauna) in the sand at the lower end of transect N ().
The foraminifera in the eroding historic salt marsh sediment were sampled in core WKW1 (2 m landward of the bank). It is strongly dominated by T. salsa with subdominant T. inflata, M. fusca and H. wilberti in the upper 25 cm (). T. salsa decreases and M. fusca increases downcore across the organic mud-sandy mud boundary (50–70 cm downcore) with the latter species strongly dominant (50–95%) in the sandy mud and sand accompanied by fewer specimens of T. salsa, T. inflata and H. wilberti. No calcareous foraminiferal tests are recorded from the core.
Tidal elevation estimates
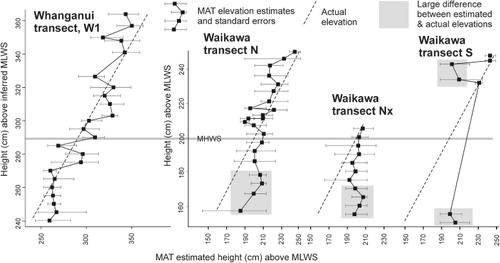
MAT elevational estimates were calculated for the faunas from the three Waikawa transects and one Whanganui transect. These estimates were then compared with the actual surveyed elevation of each faunal sample () to assess the impact of possible foraminiferal reworking from the eroding salt marsh at Waikawa. The MAT estimates are closest to the actual measured elevations in Whanganui transect W1 () with differences mostly within the range 0–20 cm (mean 12 cm), compared with mean differences of 15, 20 and 20 cm for the three Waikawa transects. The upper two-thirds of Waikawa transects N and Nx (above 180 and 175 cm) have low differences between estimates and actual elevations (mean 12 and 9 cm). Transect S and the lower third of transects N and Nx have much higher differences between MAT estimates and actual elevations (means 25, 30 and 38 cm). Three of the salt marsh faunas in transect S have highly accurate MAT estimates (1–4 cm difference from actual) and the two near the edge of the eroding bank and the two in the sand at the base of the bank have large differences (25–55 cm). The largest differences (42–55 cm) occur in the faunas in the sand at the seaward end of transects Nx and S ().
Discussion
Reworked foraminifera, Waikawa salt marsh
Waikawa Harbour south transect (S)
The distribution of unstained and stained specimens through the grass and salt meadow sections of this transect () is essentially the same for three of the agglutinated species (T. salsa, T. inflata, E. macrescens) which implies that their dead tests are in situ and have not been reworked and transported. No stained specimens of M. fusca occur in the salt marsh, although dead specimens occur in the two samples close to its eroding edge at abundances up to 20%. This species is essentially absent from the salt marsh organic-rich mud in the upper part of the eroding bank but is abundant in the lower part of the bank and in the sand (as both stained and unstained tests) around the foot of the bank (, ). We infer the sand at the foot of the bank is the source of the specimens in the marsh 70–80 cm above.
At high tide on windy days, small waves slap up against the eroding bank disturbing the intertidal sand below, which may suspend the low-density M. fusca tests in the water which are then splashed up onto the salt marsh by later waves. If this hypothesis is correct, then all foraminifera in the sand have equal potential to be reworked and thrown up onto the edge of the salt marsh. Some of the T. salsa and H. wilberti in this part of the salt marsh could therefore also be reworked. We infer that all the M. fusca and most of the H. wilberti that occur in the upper part (top 25 cm) of the WKW1 core () have been transported up into the salt meadow from the sand below the bank and this interval marks the influence of the encroaching eroding bank.
No calcareous specimens (A. aoteana, E. excavatum) were found in the salt marsh, although they are common in the intertidal sand where only stained specimens were recorded (). The lack of any dead tests in the sand implies that they are rapidly dissolving away and that the background conditions must be relatively acidic (pH <7.5; Le Cadre et al. Citation2003). Either the less-saline surface waters that wash over this sand at high tide are slightly acidic and dissolve the calcareous tests prior to and soon after their occupants die (e.g. Green et al. Citation2003; Debenay et al. Citation2004; Hayward et al. Citation2010b), or acidic groundwater flowing through the organic-rich mud (e.g. Parker & Athearn Citation1959; Goldstein & Watkins Citation1999) seeps out into the sand around the base of the bank when the tide is out. We infer that the second option is more likely as a considerable number of unstained and stained E. excavatum occur in the unvegetated sand at the lower end of transect N (), well away from the foot of an eroding bank. The absence of calcareous tests thrown up into the salt marsh above the bank in transect S might also be explained as subsequent loss through dissolution.
Stained specimens in the sand at the base of the bank indicate that the live in situ fauna includes A. aoteana, E. excavatum, M. fusca and perhaps H. wilberti. The high numbers in the sand of unstained tests of T. salsa (up to 60%), M. fusca, T. inflata and H. wilberti () are inferred to be derived from the eroding organic-rich mud of the adjacent bank where these species are the most abundant, as seen by the content of adjacent core WKW1 (). Although stained specimens suggest that M. fusca is living in the sand, some of its dead tests here were probably reworked out of the mud and sand in the lower part of the adjacent eroding bank ().
In transect S, we infer that the majority of the foraminifera in the landward part of the salt marsh (long grass and shrub zones) are essentially in situ but that reworking increases towards the seaward eroding edge of the marsh (20% or more of the specimens; H. wilberti, M. fusca). The largest amount of reworking appears to be present in the beach sand in front of the bank with the majority of foraminiferal tests (60–80%; most of the agglutinated foraminifera) apparently derived from the eroding salt marsh organic-rich mud and sand.
The MAT estimated elevations of the three most landward samples (248, 245, 232 cm) have low differences of 1–4 cm from actual elevations (), consistent with the inferred in situ faunas. In two parts of this transect there are large differences between the MAT estimated and actual elevations (shaded in ). The two salt marsh faunas from close to the eroding edge (243, 234 cm) have elevational estimates 25–42 cm lower than actual, consistent with the inferred transport in of tests from the sand at the foot of the bank. The two faunas from the sand near the base of the bank (150, 155 cm) have MAT estimates 44–55 cm higher than actual, consistent with the inferred reworking down of tests from the eroding bank above.
Waikawa Harbour north transects (N, Nx)
The two species of agglutinated foraminifera (H. wilberti, T. salsa) in the upper half (above 205 cm) of transect N (long grass and shrub zones) are accompanied by stained specimens () and are considered to be in situ. This is supported by the accuracy of the MAT elevation estimates (). The presence of common stained specimens of H. wilberti and M. fusca in the lower half of transect N (rush and salt meadow) and all of transect Nx (rush and sand) indicate that these are most likely to be in situ as well. The peak of H. wilberti between 180 and 200 cm in transect N may be inflated by specimens that were living in the salt meadow at a higher elevation before this block of salt marsh was undermined and collapsed to a lower level.
In these same lower zones (below 200 cm) unstained T. salsa tests commonly comprise 20–30% of the fauna. They are unaccompanied by stained specimens and are at a lower tidal elevation than is usual for this species (e.g. Whanganui transect, ) and therefore inferred to be reworked. These T. salsa tests may be derived in part from the nearby eroding banks of salt marsh organic-rich mud where they are the most abundant foraminifer (). They may also be part of the relict fauna that was living in the salt meadow at a higher level before this large block was undermined by erosion and collapsed down to its present location.
If T. salsa tests have been reworked into the lower parts of these transects then it follows that some of the dead tests of H. wilberti and M. fusca, which also occur in lesser abundances in the eroding bank (WKW1) have also been reworked. The abundance (30–50%) of stained and unstained tests of H. wilberti in the sand at and beyond the lower limits of the rush zone (below 160 cm) in transect Nx is unusual for this tidal elevation (e.g. Whanganui transect, ) and these specimens could be mostly reworked with some having been transported in live but not reproducing here.
The foraminifera in the upper half of transect N therefore appear to be essentially in situ whereas up to 30% of the foraminifera in the lower rush and salt meadow portion of transects N and Nx may be out of place. Some are inferred to have been displaced when the large block of the salt meadow () collapsed and some displaced by reworking from the nearby eroding salt marsh bank.
Comparisons between MAT estimated and actual tidal elevations of foraminiferal faunas in transects N and Nx () clearly indicate that the reworked tests have a significant impact. In the lower third of transects N and Nx (lowest four samples in each), inferred reworked or relict tests (mostly T. salsa) are common and the MAT elevational estimates are significantly above the actual by 26–42 cm (, shaded areas).
Impact of reworking on palaeotidal elevation estimates
Transfer functions (including MAT) derived from modern analogue faunas containing 20–60% reworked tests (as in many of the seaward samples in the Waikawa transects) would be expected to give unreliable elevational estimates, especially at sites away from the reworking or in core sequences at the same site that may not always have been subject to reworking (e.g. WKW1). At Waikawa the majority of the reworking is of high tidal salt marsh foraminifera (especially T. salsa) from the eroding bank down into lower elevation faunas. As a result, palaeo-elevational estimates of high tide fossil faunas based on these would be considerably lower than reality. In Waikawa transect S there is also evidence of low marsh tests (M. fusca) being thrown up onto the high marsh at the top of the eroding bank, which could result in higher palaeo-elevational estimates based upon these high marsh samples if they were used as modern analogues.
Reinterpretation of evidence for earthquakes at Catlins Lake
The foraminiferal record in cores and ditch exposures of Holocene sediment at tidal Catlins Lake, 40 km northeast of Waikawa (), was used to recognise three sudden vertical displacement events inferred to be co-seismic movement on the Settlement Fault that runs through the lake (Hayward et al. Citation2007). The oldest of these inferred earthquake events, 5000–4500 ka, is based on the foraminiferal and lithologic record in two cores C18 and C20 in HAT salt marsh at the southern end of the lake ().
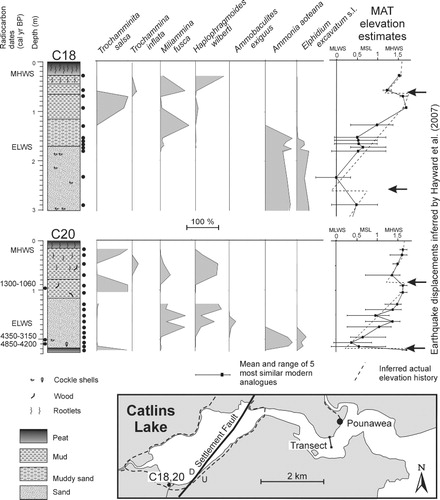
Core C20 bottomed in 10 cm of salt marsh peat (2.2–2.3 m depth) dominated by T. salsa with a MAT estimated palaeo-elevation close to HAT (). This is sharply overlain by shelly muddy sand dominated by A. aoteana and E. excavatum with a low tidal palaeo-elevation estimate (). An abrupt subsidence of c. 1 m, from the MAT foraminiferal palaeo-elevation estimates, has been inferred at the top of the peat (Hayward et al. Citation2007) and the age of this has been estimated by radiocarbon dates on shells just above the contact ().
Core C18, located 20 m from C20, encountered shelly muddy sand at 1.7–5 m depth with no peat. Slight changes in the relative abundances of the dominant species at c. 2.3 m downcore resulted in a MAT palaeo-elevation estimate for the sample that was 0.5 m lower than those above and below. This was inferred to record the same earthquake displacement as seen at the same depth in C20, but here at mid to low tidal elevations the foraminiferal fauna showed only a slight change in composition (Hayward et al. Citation2007).
The suggested interpretation was that C20 cored into a high tide salt marsh and that C18 may have cored a nearby low tide channel sequence. Core C20 was a solitary reconnaissance vibracore taken in 2005, whereas vibracore C18 was taken a year later to replicate the inferred subsidence events recorded by the foraminiferal faunas in C20. Unfortunately the lack of other suitable marshes around the lake for coring meant that the spacing between the two cores was not as great as recommended by Nelson et al. (Citation1996) for more certain identification of a co-seismic subsidence event.
In light of the eroding salt marsh bank and reworked salt marsh foraminifera described here from Waikawa, we undertook additional coring with a narrow gauge auger (30 mm diameter) between and around both Catlins Lake vibracore locations. These did not replicate the C20 peat horizon with agglutinated salt marsh foraminifera nearly 2 m downcore. The C18 muddy sand stratigraphy with Ammonia and Elphidium foraminiferal faunas was commonly encountered. In some places, the stratigraphy contained a mixture of muddy sand and organic mud with a few agglutinated marsh foraminifera with the lower tidal Ammonia and Elphidium.
We therefore conclude that a more plausible interpretation of the foraminiferal faunas and MAT elevation estimates from c. 2 m down in the Catlins Lake cores (C18 and 20) is that there was an eroding salt marsh bank at the south end of Catlins Lake at 4.5–5 ka, almost identical to that encountered today at Waikawa Harbour. Blocks of salt marsh peat and organic-rich mud probably collapsed down onto the low tidal sand at the foot of the bank and reworked agglutinated salt marsh foraminifera were mixed into low tidal faunas. This situation was preserved by rapid sediment accumulation, possibly during a storm.
Conclusions
The transect of foraminiferal samples through the un-eroding salt marsh at Whanganui Inlet produces MAT elevation estimates closer to actual (mean difference 12 cm) than the transects through the eroding salt marsh at Waikawa Harbour (mean difference 15–25 cm).
At Waikawa Harbour inferred reworked foraminifera, derived from the eroding salt marsh bank, comprise up to 30% of the faunas in the lower parts (rush zone) of transects N and Nx. Relict foraminiferal tests are inferred to comprise a significant proportion of the faunas in the collapsed block of undermined salt meadow/marsh in the lower part of transect N which has subsequently been colonised by low marsh species. MAT elevational estimates are c. 27–42 cm higher than actual for these faunas as a result of the reworked higher marsh tests.
All the foraminifera in the higher parts of Waikawa transect S appear to be in situ, but >20% of specimens in the salt meadow near the top of the eroding bank are inferred to have been thrown up in suspension from the sand 70–80 cm below. This beach sand at the foot of the bank has 60–80% inferred reworked foraminiferal tests derived from the eroding salt marsh. MAT elevational estimates are 25–42 cm too low for marsh faunas near the top of the bank, and c. 44–55 cm too high for those in the sand as a result of the reworked tests.
Dominantly stained calcareous tests of Ammonia and Elphidium are a significant part of faunas in sand at the base of transects S and N. The near absence of calcareous tests (stained, dead or reworked) elsewhere is inferred to be due to their rapid post-mortem dissolution in low pH interstitial water in, and seeping out of, the salt marsh organic-rich mud.
In the light of this study, we reinterpret a cored sequence at Catlins Lake that contained high tide salt marsh foraminiferal faunas (in peat) abruptly overlain by low tide foraminiferal faunas (in sand). Rather than the previously inferred earthquake-related subsidence at 4.5–5 ka, we now consider an eroding salt marsh with collapsed blocks of peat and reworking of released salt marsh foraminifera (like that now occurring at Waikawa Harbour) to be a more plausible explanation.
Palaeotidal elevation estimates based on modern analogue samples taken through salt marshes that are currently eroding need to be treated with caution, as reworking of foraminiferal tests is a real possibility and could significantly impact results.
Supplementary files
Supplementary file 1: Census counts, relative abundances with 95% confidence limits (Patterson and Fishbein, Citation1989) of foraminiferal species in samples from Whanganui Inlet and Waikawa Harbour salt marsh transects and Waikawa Harbour core WKW1.
Supplementary file 2: Modern analogue technique (MAT) elevational estimates and standard errors for foraminiferal faunal samples from Whanganui Inlet and Waikawa Harbour salt marsh transects based on the mean and range of the five nearest modern analogues (Supplementary file 3).
Supplementary file 3: Relative abundances of foraminiferal species in 548 intertidal modern analogue samples from New Zealand harbours and estuaries, with tidal elevations, used for MAT elevation estimates.
Supplementary file 3
Download MS Excel (353.5 KB)Supplementary file 2
Download MS Excel (37 KB)Supplementary file 1
Download MS Excel (255 KB)Acknowledgements
We thank Kathy Campbell for her supervision of Brigida Figueira's PhD thesis from which the data for most of this paper have been extracted. Catherine Reid is thanked for helpful review of this manuscript. The study was funded by New Zealand's Foundation for Research, Science and Technology.
References
- Bernhard JM, Ostermamm DR, Williams DS, Blanks JK 2006. Comparison of two methods to identify live benthic foraminifera: a test between rose Bengal and CellTracker Green with implications for stable isotope paleoreconstructions. Paleoceanography 21: PA4210. 10.1029/2006PA001290
- Callard SL, Gehrels WR, Morrison BV, Grenfell HR 2011. Suitability of salt-marsh foraminifera as proxy indicators of sea level in Tasmania. Marine Micropaleontology 79: 121–131. 10.1016/j.marmicro.2011.03.001
- Clark KJ, Hayward BW, Cochran UA, Grenfell HR, Hemphill-Haley E, Mildenhall DC et al. 2011. Investigating subduction earthquake geology along the southern Hikurangi margin using paleoenvironmental histories of intertidal inlets. New Zealand Journal of Geology and Geophysics 54: 255–271. 10.1080/00288306.2011.562903
- Debenay J-P, Guiral D, Parra M 2004. Behaviour and taphonomic loss in foraminiferal assemblages of mangrove swamps of French Guiana. Marine Geology 208: 295–314. 10.1016/j.margeo.2004.04.013
- Figueira B, Grenfell HR, Hayward BW, Alfaro AC 2012. Comparison of rose Bengal and cell tracker green staining for identification of live salt marsh foraminifera. Journal of Foraminiferal Research 42: 206–215. 10.2113/gsjfr.42.3.206
- Gehrels WR, Hayward BW, Newnham RM, Southall KE 2008. A 20th century acceleration in sea-level rise in New Zealand. Geophysical Research Letters 35: L02717. 10.1029/2007GL032632
- Goldstein ST, Watkins GT 1999. Taphonomy of salt marsh foraminifera: an example from coastal Georgia. Palaeogeography Palaeoclimatology Palaeoecology 149: 103–114. 10.1016/S0031-0182(98)00195-3
- Green MA, Aller RC, Aller JY 1993. Carbonate dissolution and temporal abundances of Foraminifera in Long Island Sound sediments. Limnology and Oceanography 38: 331–345. 10.4319/lo.1993.38.2.0331
- Grenfell HR, Hayward BW, Nomura R, Sabaa AT 2012. Proxy record of 20th century sea-level rise in the Manukau Harbour, New Zealand. Marine and Freshwater Research 63: 370–384. 10.1071/MF11208
- Guilbault J.-P, Clague JJ, Lapointe M 1995. Amount of subsidence during a late Holocene earthquake – evidence from fossil tidal marsh foraminifera at Vancouver Island, west coast of Canada. Palaeogeography, Palaeoclimatology, Palaeoecology 118: 49–71. 10.1016/0031-0182(94)00135-U
- Hawkes AD, Horton BP, Nelson AR, Hill DF 2010. The application of intertidal foraminifera to reconstruct coastal subsidence during the giant Cascadia earthquake of AD1700 in Oregon, USA. Quaternary International 221: 116–140. 10.1016/j.quaint.2009.09.019
- Hayward BW, Cochran U, Southall K, Wiggins E, Grenfell HR, Sabaa AT et al. 2004a. Micropalaeontological evidence for the Holocene earthquake history of the eastern Bay of Plenty, New Zealand. Quaternary Science Reviews 23: 1651–1667. 10.1016/j.quascirev.2004.01.010
- Hayward BW, Grenfell HR, Reid CM, Hayward KA 1999a. Recent New Zealand shallow-water benthic foraminifera: taxonomy, ecologic distribution, biogeography, and use in paleoenvironmental assessment. Institute of Geological and Nuclear Sciences Monograph no. 21. 258 p.
- Hayward BW, Grenfell HR, Sabaa AT 2012. Marine submersion of an archaic moa-hunter occupational site, Shag River estuary, North Otago. New Zealand Journal of Geology & Geophysics 55: 127–136. 10.1080/00288306.2012.671181
- Hayward BW, Grenfell HR, Sabaa AT, Kay J, Daymond-King R, Cochran U 2010a. Holocene subsidence at the transition between strike-slip and subduction on the Pacific-Australian plate boundary, Marlborough Sounds, New Zealand. Quaternary Science Reviews 29: 648–661. 10.1016/j.quascirev.2009.11.021
- Hayward BW, Grenfell HR, Sabaa AT, Kay J 2010b. Using foraminiferal faunas as proxies for low tide level in the estimation of Holocene tectonic subsidence close to the Pacific-Australian plate boundary, New Zealand. Marine Micropaleontology 76: 23–36. 10.1016/j.marmicro.2010.04.002
- Hayward BW, Grenfell HR, Sabaa AT, Southall KE, Gehrels WR 2007. Foraminiferal evidence of Holocene subsidence and fault displacements, coastal South Otago, New Zealand. Journal of Foraminiferal Research 37: 344–359. 10.2113/gsjfr.37.4.344
- Hayward BW, Grenfell HR, Scott DB 1999b. Tidal range of marsh foraminifera for determining former sea-level heights in New Zealand. New Zealand Journal of Geology and Geophysics 42: 395–413. 10.1080/00288306.1999.9514853
- Hayward BW, Hollis C 1994. Brackish foraminifera in New Zealand: a taxonomic and ecologic review. Micropaleontology 40: 185–222. 10.2307/1485816
- Hayward BW, Scott GH, Grenfell HR, Carter R, Lipps JH 2004b. Techniques for estimation of tidal elevation and confinement (∼salinity) histories of sheltered harbours and estuaries using benthic foraminifera: examples from New Zealand. The Holocene 14: 218–232. 10.1191/0959683604hl678rp
- Hayward BW, Wilson K, Morley MS, Cochran U, Grenfell HR, Sabaa AT et al. 2010c. Microfossil record of the Holocene evolution of coastal wetlands in a tectonically-active region of New Zealand. The Holocene 20: 405–421. 10.1177/0959683609353431
- Horton BP 1999. The distribution of contemporary intertidal foraminifera at Cowpen Marsh, Tees Estuary, UK: implications for studies of Holocene sea-level changes. Palaeogeography Palaeoclimatology Palaeoecology 149: 127–149. 10.1016/S0031-0182(98)00197-7
- Kemp AC, Horton BP, Culver SJ, Corbett DR, van de Plassche O, Gehrels WR et al. 2009. Timing and magnitude of recent accelerated sea level rise (North Carolina, United States). Geology 37: 1035–1038. 10.1130/G30352A.1
- Le Cadre V, Debenay J-P, Lesourd M 2003. Low pH effects on Ammonia beccarii test deformation: implications for using test deformation as a pollution indicator. Journal of Foraminiferal Research 33: 1–9. 10.2113/0330001
- Nelson AR, Shennan I, Long AJ 1996. Identifying coseismic subsidence in tidal-wetland stratigraphic sequences at the Cascadia subduction zone of western North America. Journal of Geophysical Research 101: 6115–6135.10.1029/95JB01051
- Parker FL, Athearn WD 1959. Ecology of Marsh foraminifera in Poponesset Bay, Massachusetts. Journal of Paleontology 33: 333–343.
- Patterson RT, Fishbein E 1989. Re-examination of the statistical methods used to determine the number of point counts needed for micropaleontological quantitative research. Journal of Paleontology 63: 245–248.
Appendix
Taxonomic reference list of all foraminiferal species referred to in this paper. Also listed are citations of figured foraminiferal specimens that reflect the taxonomic concept followed here. The original descriptions of these foraminiferal species can be found in the Ellis and Messina world catalogue at www.micropress.org.
Kingdom Chromista
Phylum Foraminifera
Order Textulariina
Haplophragmoides wilberti Andersen 1953. Hayward et al. Citation1999a, pl. 1, figs 25–26.
Entzia macrescens (Brady 1870). Hayward et al. Citation1999a, pl. 1, figs 27–29.
Miliammina fusca (Brady 1870). Hayward et al. Citation1999a, pl. 1, figs 5–6.
Trochammina inflata (Montagu 1808). Hayward et al. Citation1999a, pl. 2, figs 6–8.
Trochamminita salsa (Cushman and Brönnimann 1948). Hayward et al. Citation1999a, pl. 1, figs 30–32.
Order Rotaliina
Ammonia aoteana (Finlay 1940). Hayward et al. Citation1999a, pl. 16, figs 7–9.
Elphidium excavatum (Terquem 1875) s.l. Hayward et al. Citation1999a, pl. 17, figs 13–14.