
Abstract
Adularia and sanidine are polymorphs of potassium feldspar commonly present in felsic, hydrothermally altered volcanic deposits. Sanidine is a high-temperature volcanic mineral, whereas adularia forms post deposition by hydrothermal processes. Petrographically differentiating between these polymorphs in hydrothermally altered volcanic rocks may be utilised to distinguish geological units as well as provide insights into fluid–rock interactions. However, petrographic identification may be difficult or not possible in fine-grained drill cuttings. Here, polymorphic-sensitive, Raman spectroscopy and electron microprobe analyses are utilised to characterise adularia and potential sanidine in drill cuttings from the Ngatamariki Geothermal Field, Taupo Volcanic Zone, New Zealand. Differences in Raman spectra are capable of distinguishing between adularia and sanidine whether using peak positions or principal component analysis. All the Ngatamariki Geothermal Field potassium feldspars analysed by Raman spectroscopy were found to be adularia, as expected, with typical high K, low Ca compositions between Or94 and Or99 confirmed with electron microprobe analyses. This applied approach demonstrates that Raman spectroscopy is a fast and effective method for lending confidence to adularia and sanidine identification, which can be utilised in geothermal fields worldwide.
Introduction
Understanding the geological units of a geothermal reservoir is essential to the successful development and management of a geothermal resource. Rock cores recovered during drilling can provide detailed information about the subsurface stratigraphy, but the added expense of recovering core samples, rather than rock cuttings, means that most subsurface stratigraphy comes from rock cuttings rather than core. Recognition and correlation of units can be difficult from fine-grained cuttings, particularly when trying to distinguish between units with similar lithologies. Within the Taupo Volcanic Zone (TVZ), New Zealand, it can be difficult to distinguish between different siliciclastic units which make up much of the upper 3 km of the crust (Bibby et al. Citation1995; Harrison & White Citation2006). An additional complication in the TVZ is the presence of large regional-scale depressions (calderas and graben structures) that cause over-thickening of siliciclastic deposits of both primary and secondary origin (e.g., Wilson et al. Citation2008).
In some cases, the primary, rock-forming mineralogy can be used to identify units. For example, sanidine is a high-temperature polymorph of potassium feldspar in highly evolved volcanic rocks, but due to its rare occurrence in the TVZ it can be used to help identify geological units in which it is known to occur. It is present in certain members of the Whakamaru Group ignimbrites (Martin Citation1961; Brown et al. Citation1998), but is absent, or at least extremely rare, in older ignimbrites (> 350 ka). Blank (Citation1965) reports trace amounts of sanidine in the 1.00 Ma Rocky Hill ignimbrite (Houghton et al. Citation1995) and the Waipari ignimbrite, considered by Wilson (Citation1986) to be part of the 1.21 Ma Ongatiti ignimbrite (Houghton et al. Citation1995). However, studies prior and subsequent to this have not reported sanidine in any pre-Whakamaru ignimbrites (Martin Citation1961; Murphy & Seward Citation1981; Ritchie Citation1996; Hildyard et al. Citation2000; Schipper Citation2004).
Hydrothermal alteration within geothermal fields complicates the identification and correlation of units, with the destruction/replacement of primary minerals and formation of secondary minerals. Adularia is a lower temperature polymorph of potassium feldspar and may be confused with sanidine. The structure and optical properties can vary between samples and even in a single crystal, with very fine-scale twinning being typical (Deer et al. Citation1992). Adularia is a common, secondary mineral in active geothermal systems with four modes of formation: (1) replacement of primary feldspars; (2) as minute, diamond-shaped crystals in the groundmass; (3) as euhedral crystals lining fractures and cavities; and (4) filling in open spaces in the groundmass (Browne & Ellis Citation1970; Steiner Citation1970). It is found in all geothermal fields in the TVZ, including the Ngatamariki Geothermal Field (NGF). Distinguishing between adularia and sanidine optically is possible due to the distinctive twinning in adularia. However, this fine twinning is not always apparent and the two minerals can be difficult to distinguish in hydrothermally altered volcanic rocks, particularly within fine-grained drill cuttings. It is, therefore, possible that adularia may have been misidentified as sanidine, which in some situations may provide a false correlation.
Petrographic analysis of drill cuttings from the > 350 ka Tahorakuri Formation at NGF shows that some intervals contain common potassium feldspars, but the fine-grained nature of the cuttings makes identification of the feldspars difficult. Adularia can sometimes be identified where it replaces primary phenocrysts by its distinctive fine, uneven twinning. But optically, many appear similar to sanidine, suggesting that both adularia and sanidine may be present. Because the two minerals form under different conditions, it is important to be able to distinguish between them as this will contribute significantly to the overall interpretation of the rocks.
This study aims to utilise and assess Raman spectroscopy as a supplementary method to re-examine potassium feldspars present in fine-grained drill cuttings from the NGF, New Zealand. Because the adularia and sanidine are chemically similar, this method utilises the differences in their crystal structures to distinguish between them. Previously identified samples of adularia and sanidine from the TVZ are re-analysed for reference. Differences between the reference TVZ adularia and sanidine are then used to identify the type of potassium feldspars present in the NGF drill cuttings. In addition, electron microprobe (EMP) analysis is completed on a smaller sample set of crystals from NGF and compared with analyses garnered from Raman spectroscopy.
Geological setting
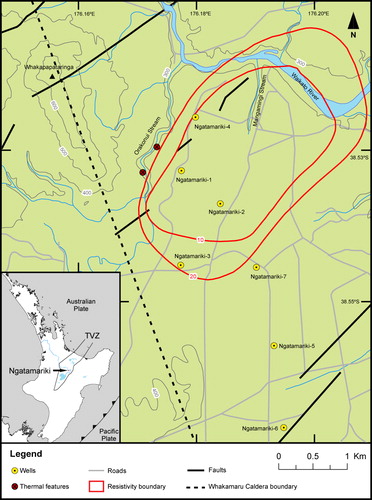
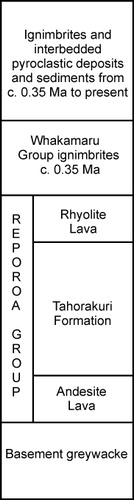
The NGF, located 17 km northeast of Taupo (), lies just outside the Whakamaru caldera as proposed by Wilson et al. (Citation1986), and hosts an 82 MWe geothermal power station. The Whakamaru Group ignimbrites and the Tahorakuri Formation are two volcanic formations intersected in geothermal drillholes across most of the central part of the TVZ (). The Whakamaru Group ignimbrites are a series of widespread ignimbrites erupted between 340 and 320 ka, marking the most active period in the history of the TVZ (Wilson et al. Citation1986; Houghton et al. Citation1995; Leonard et al. Citation2010), which outcrop over a large area in the central North Island and are buried beneath younger deposits within much of the active TVZ (Brown et al. Citation1998). Within the geothermal drillholes of the southern part of the central TVZ, the units correlated with the Whakamaru Group ignimbrites have been termed the Wairakei ignimbrites (Grindley Citation1965). However, it is uncertain where in the Whakamaru sequence the Wairakei ignimbrites fit, and this sequence has never been dated to confirm this correlation. The Tahorakuri Formation is defined as all un-named volcaniclastic and sedimentary deposits below the Whakamaru Group ignimbrites within TVZ geothermal drillholes (Gravley et al. Citation2006).
Ngatamariki−5 (referred to as NM5 hereon) is located in the southern part of the NGF, with the Tahorakuri Formation reaching a thickness of > 1 km in these wells. Potassium feldspars are common at some depth intervals in the Tahorakuri Formation cuttings from NM5. Adularia has previously been reported within the Tahorakuri Formation (Wood Citation1985a, Citation1985b, Citation1986; Rae et al. Citation2009; Ramirez & Rae 2009; Chambefort & Bignall Citation2011), and although it is clear that adularia accounts for some of the observed potassium feldspars in these wells, some of the grains appear optically more like sanidine than adularia.
To be able to confirm ignimbrite correlation it is essential to confidently identify the potassium feldspars in these wells. Here, we analyse potassium feldspars via Raman spectroscopy to confirm whether they are all adularia. This does not provide new information about the original rock, but it does provide information on the geothermal system. Sanidine is not expected within the Tahorakuri Formation because it has not previously been reported in anything other than trace abundances in rocks of pre-Whakamaru age. A positive identification of sanidine would, therefore, suggest this part of the Tahorakuri Formation might either be part of the Whakamaru Group ignimbrites, or has a primary mineralogy distinct from units of the same age that outcrop at the surface.
Methods
Raman spectroscopy
Petrographically identifiable sanidine and adularia (i.e., referred to as TVZ sanidine and TVZ adularia) in polished thin sections were analysed using Raman spectroscopy at the University of Otago. An uncovered thin section of sample SB−2028 (Brown Citation1994) from the Whakamaru Group ignimbrites was used for TVZ sanidine, and a thin section of FB11−OD8 (a sample of the hydrothermally altered Ohakuri ignimbrite from near Ohakuri Dam) was used for TVZ adularia. A total of 70 grains from 14 samples were analysed from NM5, corresponding to depths (in metres below the drilling rig floor) of 1125, 1175, 1225, 1300, 1350, 1400, 1450, 1500, 1550, 1600, 1650, 1700, 1750 and 1800. The number of grains measured per sample ranged from three to seven, with more grains measured in the interval from 1400–1700 m where the abundance of potassium feldspar was greatest.
Measurements were made using a Senterra Raman microscope by Bruker Optics. Incident light at 532 nm was used at 50 mW power, with each spectrum a composite of twenty 3-s acquisitions. A×20 objective with a 50 µm aperture was used, with the spectral region from 50 to 1500 cm−1 measured at the high resolution setting of 3–5 cm−1 as this region contained the major spectra differences between sanidine and adularia.
A minimum of six TVZ adularia and sanidine crystals was measured multiple times in different parts of each crystal. Unknown NM5 samples were measured between one and six times, but usually two or three times per crystal. Some crystals also contained a signal from the epoxy resin used to mount the cuttings. Quartz and calcite, two of the major components of the cuttings, were also measured for potential comparisons. This was mainly due to the difficulty in identifying the fine-grained, rounded grains when taking measurements. Although care was taken to measure a single crystal, the inhomogeneous nature of some of the altered grains increased the chance of minerals other than potassium feldspar being included in the measurements. Unknown samples were identified using principle component analysis (PCA) and spectral peak positions. Peak positions were identified for the average spectrum of each crystal using the peak picking feature of GRAMS/AI 8.0 software.
Electron microprobe analysis
Elemental compositions were measured using the JEOL JXA-8600 Superprobe with a wavelength dispersive detection system located at the University of Otago. Analyses were performed using a 15 kV accelerating voltage and a 20 nA beam current, with a spot size of 20 µm. The instrument was calibrated using this laboratory's Smithsonian standards for labradorite and microcline, and natural adularia from St Gotthard, Switzerland. Samples were first imaged using back-scattered electrons (BSE) and were analysed for SiO2, Al2O3, FeO, MgO, CaO, Na2O, K2O and BaO. Four adularia crystals from FB11-OD8 and four sanidine crystals from SB-2028 were analysed (to serve as future reference material), along with the samples from NM5 at 1125, 1300, 1450, 1500, 1600 and 1700 m depths. These samples were chosen to give a representative sample of depth intervals.
Results and discussion
Mineralogy
Owing to the fine-grained nature of the cuttings in NM5, it may be difficult to petrographically differentiate between adularia and potential sanidine. Reference TVZ adularia () and sanidine () demonstrate the fine-scale twinning present in adularia and absent in sanidine. A typical potassium feldspar from NM5, which should be adularia, has no distinct twinning and could be misidentified as sanidine (). Some of the grains analysed here are not monomineralic, consisting of two or more different mineral phases such as shown in where both adularia and illite are present. This is particularly apparent where transmitted light photomicrographs () provide less mineralogical detail than its corresponding BSE image (). Many of these ‘mixed’ grains are primarily altered to adularia, often with only small amounts of other minerals within or surrounding the grains, but some contain large areas of various minerals within the same grain and can be internally complex. In order to better understand the process of hydrothermal alteration, a number of these grains were analysed in more than one spot as shown in and .
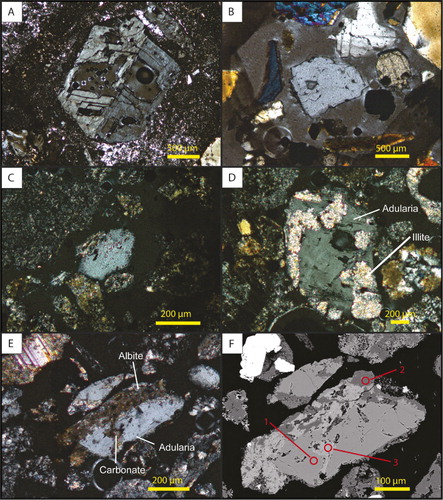
Table 1 Major element analysis for alteration products in NM5.
Albite is the most common mineral associated with adularia; however, illite and carbonates are also common. Albite often appears as patchy, dark brown areas (in cross-polarised light) with common inclusions (), and generally only contains trace amounts of calcium and potassium (). The chemical analyses for illite and the carbonates are not complete as the H2O (for illite) and CO2 (for carbonate) contents were not measured, but the measured elemental concentrations closely match those given in Deer et al. (Citation1992) and references therein. The chemistry of NM5-1600f/2 is consistent with it being calcite, a common hydrothermal mineral at the NGF and worldwide. Calcite replaces plagioclase at temperatures above c. 170ºC (Simmons & Christenson Citation1994).
Although adularia appears to be present throughout NM5 and provides little information on the nature of the original rock, it is commonly regarded as a positive indicator of permeability in the formation (Browne Citation1970). In NM5, adularia first appears in trace amounts within the Tahorakuri Formation at 1125 m depth and is present to at least 1800 m, with cuttings below this being very fine-grained making identification difficult. From 1400 m, the amount of adularia increases, and between 1500 and 1700 m depths it is at a maximum, indicating enhanced permeability at one time in this zone.
Although some may have crystallised in veins/cavities or in the groundmass, it is likely that most, possibly all, formed by replacing primary plagioclase. Pseudomorphs with subhedral crystal shapes are sometimes observed, and were probably originally plagioclase. No euhedral crystals were observed, suggesting that vein mineralisation was not an important formation process, while adularia formed in the groundmass at the Ohaaki–Broadlands Geothermal Field tends to be minute, diamond-shaped crystals (Browne & Ellis Citation1970). The process of formation may be of interest for two reasons. First, it may influence estimates of the temperature it formed at, with adularia in the groundmass reportedly forming at cooler temperatures than the adularia replacing plagioclase at the Ohaaki–Broadlands (Browne & Ellis Citation1970), whereas vein adularia indicates that boiling has occurred (White & Hedenquist Citation1990). Second, thermochronological studies utilising 40Ar/39Ar dating of adularia can provide valuable information on the evolution of a hydrothermal system. However, adularia altered from plagioclase phenocrysts often also contains illite, whereas vein adularia generally does not, and is therefore preferable to date (Mauk et al. Citation2011).
Raman spectroscopy
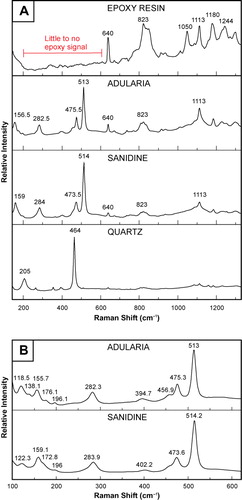
Raman spectra with the major peak positions for epoxy, TVZ adularia, TVZ sanidine and quartz are shown in . Because the spectral region below 620 cm−1 contained the major differences between TVZ adularia and sanidine, but little or no epoxy signal, this region is the main focus of this study. shows the averaged Raman spectra for the TVZ adularia and sanidine over the spectral region 100–620 cm−1. The spectra are similar to each other, with generally only small differences in peak positions. The most obvious difference is the peak at 138 cm−1 for the TVZ adularia, which is absent in the TVZ sanidine. Peaks at 176, 457 and 513 cm−1 are also more distinct in adularia than sanidine.
Peak positions for TVZ adularia and sanidine and NGF NM5 feldspar grains are shown in along with peak positions previously reported for sanidine (Mernagh Citation1991; Freeman et al. Citation2008) and orthoclase, which has previously been found to have Raman spectra identical to adularia (Mernagh Citation1991). Although the spectra have been reported as being identical, it is considered very unlikely that orthoclase is present in any of these samples. Orthoclase is typically found in plutonic rocks and has never been reported in the volcanic rocks of the TVZ, nor would it be expected. Although it can also form in high-temperature hydrothermal settings, it is inconsistent with the lower temperature alteration assemblage observed in NM5. Peak positions reported here are shifted slightly from peaks previously reported. It is unclear whether this is due to the nature of the samples or to instrumental variation, and peaks reported by Freeman et al. (Citation2008) do not exactly match those reported by Mernagh (Citation1991). Unknown NGF NM5 samples are, therefore, compared to TVZ adularia and sanidine measured here, rather than matching them to those previously reported.
Table 2 Raman peak positions for samples outside the adularia field from PCA.
The peak at 138–140 cm−1 was the primary peak used for the identification of adularia because sanidine contains no peak in this region (). This peak is small and where it was absent, or at least could not be distinguished, the peak at 162–177 cm−1 was used, with a peak closer to 176 cm−1 being considered as distinctive of adularia, and a peak closer to 172 cm−1 or under being distinctive of sanidine. Using these two peak positions it is possible to show that all but one of the unknown crystals are adularia, as expected (Table 2). Sample NM5-1450f has peak positions that are more closely matched to plagioclase feldspars, in particular andesine–labradorite (Mernagh Citation1991; Freeman et al. Citation2008), and is therefore regarded as unaltered plagioclase. Although other peaks do not appear as distinctive as the two main positions used, they are generally more similar to adularia than sanidine. For example, in the 513–514 cm−1 region, peaks closer to 514 cm−1 indicate sanidine, whereas peaks closer to 513 cm−1 indicate adularia.
PCA was performed to separate TVZ adularia and sanidine and drill-cutting NGF samples were used to further confirm the presence of only adularia in drill-cuttings. This is a commonly used statistical technique for simplifying large, complex data sets such as the Raman spectra presented here. Each spectrum plots as a single point in PC space, with similar samples plotting close together. Pre-processing was required to remove baseline and scale effects, allowing all spectra to be overlaid at approximately the same scale. The scores plot for all samples is shown in , with PC-1 accounting for 51% of the total variance between the samples, and PC-2 accounting for a further 17% of the total variance. A small number of crystals plot in the quartz field, and are confidently classified as quartz. Three sample outliers measured in a dark area within an adularia crystal plot close to epoxy; due to the strong epoxy signal, these outliers are not considered further. The remainder of the NGF potassium feldspars plots in a feldspar field that includes both TVZ adularia and sanidine.
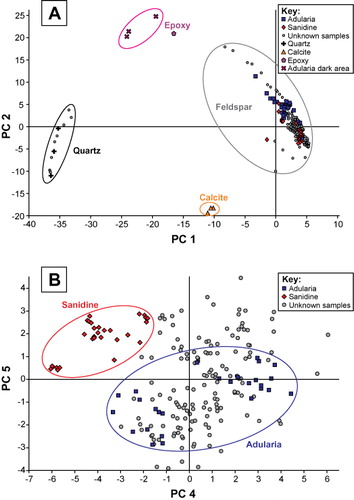
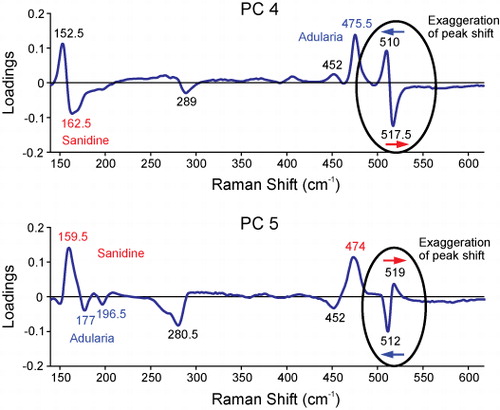
To differentiate between adularia and sanidine, PCA was recalculated using just the samples within the feldspar field (). Maximum separation was found when plotting PC-4, accounting for 9% of the total variance, against PC-5, accounting for 6% of the total variance between samples. TVZ adularia and sanidine form separate fields, with the unknown samples from NM5 plotting in and around the adularia field. The samples within this field are adularia. These PCs can be confirmed to contain information based on spectral differences in the adularia and sanidine samples being reflected in the loadings plots of PC-4 and -5 (). Peaks in the loadings plots correspond to peaks in the spectra of adularia and sanidine, or are associated with slight differences in peak positions between adularia and sanidine. Negative PC-4 peaks are associated with sanidine, whereas in PC-5, the positive peaks correlate to sanidine, thus the sanidine samples plot in the top left quadrant in . No NGF NM5 samples plot within the sanidine field. Those samples outside the adularia field, agree with analyses using peak positions.
Electron microprobe analysis
In order to further confirm the identification of the unknown crystals from NGF as adularia via Raman spectroscopy, a smaller sample of the grains was chosen to undergo EMP chemical analysis. Adularia from geothermal fields tends to form as almost pure potassium feldspar with low sodium contents and no measurable calcium (Steiner Citation1970; Hedenquist & Browne Citation1989). Sanidine contains a higher proportion of sodium and small (typically < 1 wt%), but measurable amounts of calcium (Deer et al. Citation1992; Brown Citation1994).
Representative chemical analyses for the TVZ adularia and sanidine and the samples from NM5 are shown in , with full analyses shown in and in the . TVZ adularia is extremely potassium rich, with orthoclase (Or) compositions between Or99 and Or99.4. Previously published adularia compositions from within the TVZ cover a wider range, with compositions of Or94 to Or99.5 reported by Hedenquist & Browne (Citation1989). The sanidine standards have lower potassium contents than adularia, with compositions of between Or69.4 and Or70.2. This is similar to the sanidine compositions from the Whakamaru Group ignimbrites reported by Brown (Citation1994), which range from Or66.7 to Or68.7. Calcium is present in all sanidine samples analysed here and by Brown (Citation1994), generally with anorthite (An) contents of < An1, but ranging up to An1.5. Three grains of albite, also formed during hydrothermal alteration, were measured and are also shown in for reference.
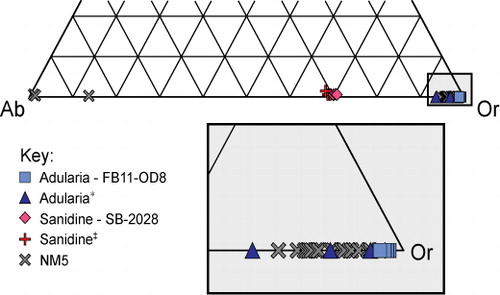
Table 3 Major element analysis for TVZ sanidine and adularia and representative NM5 samples.
All of the potassium feldspars analysed from NM5 have orthoclase contents greater than Or94, and range up to about Or99. Calcium is not present in any of these samples. These compositions confirm that they are adularia, despite many appearing optically similar to sanidine. The potassium-rich nature of the adularia crystals is a reflection of the lower temperatures of the geothermal systems compared with high-temperature sanidine. Although it is possible that sanidine in the original rock has altered to adularia, observations made elsewhere have shown a range in compositions from Or67 to Or94 as sanidine alters to adularia (Hedenquist & Browne Citation1989). The low Or end of this range is typical of sanidine, but increasing potassium contents occur in samples as they recrystallise to adularia. Because no NM5 analyses plot in this range, it must be considered extremely unlikely that sanidine was originally present in these rocks. Because unaltered plagioclase is still present in NM5, it is considered likely that some unaltered sanidine would also be preserved had it originally been present in the rocks. Those crystals easily identified as adularia (FB11-OD8, NM5-1300b; ), with variable optical properties and a generally darker colour in cross-polarised light, have slightly higher Or contents than other crystals analysed here, again possibly reflecting stages of adularia development.
Conclusions
Raman spectroscopy is able to differentiate between adularia and sanidine in hydrothermally altered volcanic rocks. It is particularly valuable for evaluating fine-grained drill cuttings. Major advantages of Raman spectroscopy are the ability to analyse a large number of grains quickly and where minimal sample preparation is necessary. It is ideal for providing more confidence related to the identification of mineral polymorphs such as adularia and sanidine that may be difficult to identify petrographically. Raman measurements should be compared with mineral reference material and standards, but the spectral peaks for adularia and sanidine are distinct enough that these minerals can be identified by major peak positions. Overall, this study confirms and demonstrates the utility of Raman spectroscopy for distinguishing adularia from sanidine in order to confirm and/or assess geological units in geothermal fields such as NGF in the TVZ, New Zealand.
Acknowledgements
This project forms part of the Master's thesis of the principal author, which is funded by the Ministry of Business, Innovation, and Employment's TechNZ scholarship. Logistic funding for this work was provided by the Source to Surface programme at the University of Canterbury, supported by Mighty River Power Limited. Travel and accommodation costs were provided by the Mason Trust Fund of the University of Canterbury. Mighty River Power Limited provided access to core sheds and relevant samples. We would like to acknowledge Andreas Auer from the Department of Geology at the University of Otago for his assistance using the electron microprobe. Thanks to David Shelley for all his help and advice in trying to decipher the alteration mineralogy of the fine-grained drill cuttings. Thanks also to Bryce Williamson for advice on Raman spectroscopy, and to Pat Browne, Tom Powell, Greg Bignall, and staff at Mighty River Power and Geological and Nuclear Sciences (GNS) for discussions and advice, particularly with regards to hydrothermal alteration. Rob Spiers, Sacha Baldwin-Cunningham, Chris Grimshaw and Kerry Swanson are also thanked for sample preparation and technical assistance. Finally, we would like to thank Franco Piranjo, Nick Mortimer, and an anonymous reviewer for their comments and suggestions that have helped improve this manuscript.
References
- Bibby HM, Caldwell TG, Davey FJ, Webb TH 1995. Geophysical evidence on the structure of the Taupo Volcanic Zone and its hydrothermal circulation. Journal of Volcanology and Geothermal Research 68: 29–58. 10.1016/0377-0273(95)00007-H
- Blank HR 1965. Ash-flow deposits of the central King Country, New Zealand. New Zealand Journal of Geology and Geophysics 8: 588–607. 10.1080/00288306.1965.10423193
- Brown SJA 1994. Geology and geochemistry of the Whakamaru Group ignimbrites, and associated rhyolite domes, Taupo Volcanic Zone, New Zealand. Unpublished PhD thesis. Christchurch, University of Canterbury.
- Brown SJA, Wilson CJN, Cole JW, Wooden J 1998. The Whakamaru Group ignimbrites, Taupo Volcanic Zone, New Zealand: evidence for reverse tapping of a zoned silicic magmatic system. Journal of Volcanology and Geothermal Research 84: 1–37. 10.1016/S0377-0273(98)00020-1
- Browne PRL 1970. Hydrothermal alteration as an aid in investigating geothermal fields. Geothermics Special Issue 2: 564–570. 10.1016/0375-6505(70)90057-X
- Browne PRL, Ellis AJ 1970. The Ohaki-Broadlands hydrothermal area, New Zealand; mineralogy and related geochemistry. American Journal of Science 269: 97–131. 10.2475/ajs.269.2.97
- Chambefort I, Bignall G 2011. Petrographic review of stratigraphic units of the Ngatamariki Geothermal Field. GNS Science Consultancy Report 2011/298. Lower Hutt, GNS Science. 102 p.
- Deer WA, Howie RA, Zussman J 1992. An introduction to the rock-forming minerals, 2nd edition. Essex, Longman Scientific and Technical.
- Freeman JJ, Wang A, Kuebler KE, Jolliff BL, Haskin LA 2008. Characterization of natural feldspars by Raman spectroscopy for future planetary exploration. Canadian Mineralogist 46: 1477–1500. 10.3749/canmin.46.6.1477
- Gravley DM, Wilson CJN, Rosenberg MD, Leonard GS 2006. The nature and age of Ohakuri Formation and Ohakuri Group rocks in surface exposures and geothermal drillhole sequences in the central Taupo Volcanic Zone, New Zealand. New Zealand Journal of Geology and Geophysics 49: 305–308. 10.1080/00288306.2006.9515169
- Grindley GW 1965. The geology, structure, and exploitation of the Wairakei geothermal field, Taupo, New Zealand. New Zealand Geological Survey Bulletin 75: 1–131.
- Harrison A, White RS 2006. Lithospheric structure of an active backarc basin: the Taupo Volcanic Zone, New Zealand. Geophysical Journal International 167: 968–990. 10.1111/j.1365-246X.2006.03166.x
- Hedenquist JW, Browne PRL 1989. The evolution of the Waiotapu geothermal system, New Zealand, based on the chemical and isotopic composition of its fluids, minerals and rocks. Geochimica et Cosmochimica Acta 53: 2235–2257. 10.1016/0016-7037(89)90347-5
- Hildyard SC, Cole JW, Weaver SD 2000. Tikorangi Ignimbrite: Aa 0.89 Ma mixed andesite-rhyolite ignimbrite, Matahana Basin, Taupo Volcanic Zone, New Zealand. New Zealand Journal of Geology and Geophysics 43: 95–107. 10.1080/00288306.2000.9514872
- Houghton BF, Wilson CJN, McWilliams M, Lanphere MA, Weaver SD, Briggs RM et al. 1995. Chronology and dynamics of a large silicic magmatic system: central Taupo Volcanic Zone, New Zealand. Geology 23: 13–16. 10.1130/0091-7613(1995)023<0013:CADOAL>2.3.CO;2
- Leonard GS, Begg JG, Wilson CJN 2010. Geology of the Rotorua area. Institute of Geological & Nuclear Sciences 1:250,000 geological map 5. Lower Hutt, GNS Science.
- Martin RC 1961. Stratigraphy and structural outline of the Taupo Volcanic Zone. New Zealand Journal of Geology and Geophysics 4: 449–478. 10.1080/00288306.1961.10420134
- Mauk JL, Hall CM, Chesley JT, Barra F 2011. Punctuated evolution of a large epithermal province: The Hauraki goldfield, New Zealand. Economic Geology 106: 921–943. 10.2113/econgeo.106.6.921
- Mernagh TP 1991. Use of the laser Raman microprobe for discrimination amongst feldspar minerals. Journal of Raman Spectroscopy 22: 453–457. 10.1002/jrs.1250220806
- Murphy RP, Seward D 1981. Stratigraphy, lithology, paleomagnetism, and fission track ages of some ignimbrite formations in the Matahana Basin, New Zealand. New Zealand Journal of Geology and Geophysics 24: 325–331.
- Rae AJ, Ramirez LE, Bardsley C 2009. Geology of exploration well NM6, Ngatamariki geothermal field. GNS Science Consultancy Report 2009/130. Lower Hutt, GNS Science. 68 p.
- Ramirez LE, Rae AJ 2009. Geology of injection well NM5, NM5A, Ngatamariki geothermal field. GNS Science Consultancy Report 2009/41. Lower Hutt, GNS Science. 29 p.
- Ritchie ABH 1996. Volcanic geology and geochemistry of Waiotapu Ignimbrite, Taupo Volcanic Zone, New Zealand. Unpublished MSc thesis. Christchurch, University of Canterbury.
- Schipper CI 2004. Chemical and mineralogical characterization of pyroclastic deposits from the ca. 1 Ma Kidnappers and Rocky Hill eruptions, Taupo Volcanic Zone, New Zealand. Unpublished MSc thesis. Dunedin, University of Otago.
- Simmons SF, Christenson BW 1994. Origins of calcite in a boiling geothermal system. American Journal of Science 294: 361–400. 10.2475/ajs.294.3.361
- Stagpoole VM, Bennie SL, Bibby HM, Graham DJ, Newport PH 1985. Electrical resistivity map of New Zealand. Sheet U17, Wairakei [cartographic material]: nominal Schlumberger array spacing 500 m. Wellington, Department of Scientific and Industrial Research.
- Steiner A 1970. Genesis of hydrothermal K-feldspar (adularia) in an active geothermal environment at Wairakei, New Zealand. Mineralogist Magazine 37: 916–922. 10.1180/minmag.1970.037.292.07
- White NC, Hedenquist JW 1990. Epithermal environments and styles of mineralization: variations and their causes, and guidelines for exploration. Journal of Geochemical Exploration 36: 445–474. 10.1016/0375-6742(90)90063-G
- Wilson CJN 1986. Reconnaissance stratigraphy and volcanology of ignimbrites from Mangakino volcano. In: Smith IEM ed. Late Cenozoic volcanism in New Zealand. Royal Society of New Zealand Bulletin 23. Pp. 179–193.
- Wilson CJN, Houghton BF, Lloyd EF 1986. Volcanic history and evolution of the Maroa-Taupo area, central North Island. In: Smith IEM ed. Late Cenozoic volcanism in New Zealand. Royal Society of New Zealand Bulletin 23. Pp. 194–223.
- Wilson CJN, Charlier BLA, Fagan CJ, Spinks KD, Gravley DM, Simmons SF et al. 2008. U–Pb dating of zircon in hydrothermally altered rocks as a correlation tool: application to the Mangakino geothermal field, New Zealand. Journal of Volcanology and Geothermal Research 176: 191–198.
- Wood CP 1985a. Stratigraphy and petrology of NM1 Ngatamariki Geothermal Field. Unpublished report of the New Zealand Geological Survey. Lower Hutt, Department of Scientific and Industrial Research.
- Wood CP 1985b. Stratigraphy and petrology of NM2 Ngatamariki Geothermal Field, Unpublished report of the New Zealand Geological Survey. Lower Hutt, Department of Scientific and Industrial Research.
- Wood CP 1986. Stratigraphy and petrology of NM3 Ngatamariki Geothermal Field. Unpublished report of the New Zealand Geological Survey. Lower Hutt, Department of Scientific and Industrial Research.