
ABSTRACT
The North Westland deformation front runs offshore for 320 km between Cape Farewell and Hokitika at a distance of 3–30 km from the coast. From marine seismic reflection profiles integrated with published sediment core and coastal uplift data, we infer late Quaternary activity on six major reverse faults. The principal structures are the Cape Foulwind, Kahurangi and Kongahu faults and the newly named Farewell, Elizabeth and Razorback faults. They include Late Cretaceous and Paleogene rift faults that were reactivated as reverse faults during the late Cenozoic. Best estimates of late Quaternary (<120 ka) slip rates for different faults range from 0.05–0.75 mm a–1. Nine potential earthquake sources are identified, including four segments of the Cape Foulwind Fault. They are of length c. 20–120 km, are potentially capable of producing moderate- to large-magnitude earthquakes of Mw 6.7–7.8 and represent a seismic risk to coastal communities. Best estimates of recurrence intervals for individual fault sources range from about 7600 years to 30,400 years, with large uncertainties in slip rates of up to –0.4, +1.0 mm a–1 reflected by the wide range of recurrence intervals.
Introduction
The North Westland region of South Island, New Zealand, west of the Alpine Fault, is a deformed foreland basin shortened by widely distributed, N–S- to NNE–SSW-striking thrust and reverse faults (A) (Nathan et al. Citation1986; Bishop & Buchanan Citation1995; Ghisetti & Sibson Citation2006; Stafford et al. Citation2008; Ghisetti et al. Citation2014). These include thrust faults that developed entirely during late Cenozoic time (<15 Ma) and moderately dipping (50–65°) basement faults inherited from systems of Late Cretaceous–Paleogene extensional faults that have been reactivated compressionally. Basement faulting affecting the sedimentary cover sequence is recognised for at least 300 km alongstrike from near Hokitika to north of Cape Farewell, and up to 150 km northwest of the Alpine Fault. The faults control uplift of ranges associated with topographic elevation of up to 1900 m. The deformation front is represented principally by the Cape Foulwind and Kahurangi faults, lying up to 30 km offshore beneath the inner continental shelf. These structures have received considerable attention by the petroleum exploration industry (Figure S1) and appear on regional geological compilations (Rattenbury et al. Citation1998; Nathan et al. Citation2002; Ghisetti et al. Citation2014). However, their potential late Quaternary activity and seismic hazard has been the subject of debate (; e.g. Norris Citation1978; Stafford et al. Citation2008).
Figure 1. A, Late Quaternary faults of central New Zealand (modified from Litchfield et al. Citation2013; Ghisetti et al. Citation2014). The white arrow shows the relative plate motion vector between the Pacific and Australian plates (Beavan & Haines Citation2001; Wallace et al. Citation2007). CF, Cape Farewell; CFF, Cape Foulwind Fault; ChCh, Christchurch; H, Hokitika; KF, Kahurangi Fault; N, Nelson; W, Westport; Wn, Wellington. B, Historical seismicity for the period 1990–2014 (New Zealand earthquake catalogue, GeoNet). Focal mechanisms for large-magnitude pre-1990 earthquakes from Anderson et al. (Citation1993) and Doser et al. (Citation1999). KR, Kahurangi Range; PR, Paparoa Range; SA, Southern Alps. Onshore faults are earthquake sources recognised in the current National Seismic Hazard Model (Stirling et al. Citation2012). 1, Lower Buller; 2, Inangahua–Maimai; 3, Lyell; 4, White Creek. Bold black arrows indicate azimuth of maximum compressive stress σ1 across northern South Island (Sibson et al. Citation2012; Townend et al. Citation2012).
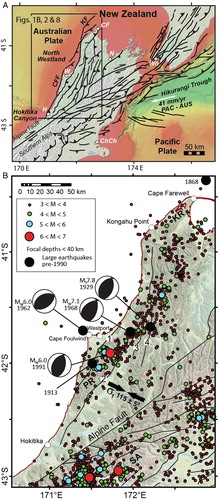
Table 1. Previous interpretations of late Quaternary tectonic activity and earthquake potential associated with the Cape Foulwind, Kahurangi and/or Kongahu faults.
Active tectonic shortening across North Westland is evidenced by Global Positioning System (GPS) data (Beavan & Haines Citation2001), historical crustal earthquakes (Anderson et al. Citation1993) (B) and uplift and folding of late Quaternary marine and fluvial terraces (Suggate Citation1992; Nathan et al. Citation2002; Rose Citation2011). The average azimuth of principal compressive stress (σ1), derived from geodetic, seismicity and geological data, is 115 ± 5° (B) (Sibson et al. Citation2012; Townend et al. Citation2012). The region has been characterised by active historical seismicity, including a significant number of moderate- and large-magnitude reverse and thrust earthquakes (Reyners et al. Citation1997). These include the 1929 Ms 7.8 Buller earthquake (Berryman Citation1980), 1968 Mw 7.1 Inangahua earthquake, 1962 Mw 6 Westport earthquake, and the 1991 Mw 5.8 and Mw 6 Hawk's Crag earthquakes (Anderson et al. Citation1993, Citation1994). The cumulative seismic moment released by historical seismicity in this area is larger than expected compared to GPS-based kinematic models (Beavan & Haines Citation2001). This potentially relates to the time dependence of earthquakes, with a cluster of seismicity occurring in recent decades. Stafford et al. (Citation2008) considered that active blind faulting across the region has likely been under-recognised in kinematic models.
The Cape Foulwind and Kahurangi faults are known to deform Plio-Pleistocene marine units (B), but were not considered presently active by Van der Linden & Norris (Citation1974), Norris (Citation1978), Rattenbury et al. (Citation1998), Beavan & Haines (Citation2001), Nathan et al. (Citation2002), Stirling et al. (Citation2012) and Litchfield et al. (Citation2013, Citation2014). However, other workers have interpreted the faults to be active seismic and tsunami hazard sources with slip rates typically of <1.0 mm a–1, earthquake magnitudes of Mw 7.6–7.9 and recurrence intervals of 103–104 years () (Nathan et al. Citation1996; Stafford et al. Citation2008; Power Citation2013; Barnes & Ghisetti Citation2013). This paper builds on the work of Ghisetti et al. (Citation2014) and the preliminary work of Barnes & Ghisetti (Citation2013), using marine seismic profiles tied to exploration boreholes and interpreted in terms of sea-level cyclicity to map and evaluate the activity of the North Westland deformation front. We present seismic data and a restored geological section that illustrate late Cenozoic tectonic inversion of the Cape Foulwind and Kahurangi faults and active folding of the cover sequence associated with blind faulting in basement rocks, pointing to activity of the North Westland deformation front in the late Quaternary. We integrate our observations of late Quaternary faulting and associated folding with coastal uplift rates (Suggate Citation1992; Rose Citation2011), revise our preliminary interpretations of slip rates and earthquake source potential (Barnes & Ghisetti Citation2013) and discuss their implications.
Geophysical and well data
A substantial amount of petroleum industry marine seismic reflection data, mainly of 1970s and 1980s vintage, was available for this study (http://www.nzpam.govt.nz; Figure S1). These data are widely distributed, and are tied to offshore exploration boreholes (see compilations of Breeze & Brown 1999; Ghisetti et al. Citation2014). The wells pertinent to this study are Cook-1, Toropuihi-1, Kongahu-1 and Haku-1 (A). The seismic reflection sections typically image the basement surface 1–2 km beneath the seafloor, and include data available as depth sections converted using stacking velocities (e.g. NZ CK-81 lines in Cultus Pacific Citation1981). Other notable seismic datasets include sections acquired by Esso Exploration and Production NZ (1969–1970; EZC, EZF lines), Diamond Shamrock Exploration Oil (Citation1982a, Citation1982b; DS2, DS3 lines), Seahawk Oil International (Citation1981; SH81 lines), NZ Petroleum Corporation (Anderson Citation1985; NZ Petroleum Exploration Citation1970–1972, Citation1974; NZPET71/72 lines) and Petrocorp (GECO NZ 1984; PO59 lines). Reprocessing of selected lines include work reported by Anderson (Citation1985) (DS3, PO59, 200- lines) and Widespread Energy (Geosphere Citation2009; EZC, EZF, SH81 and DS3 lines).
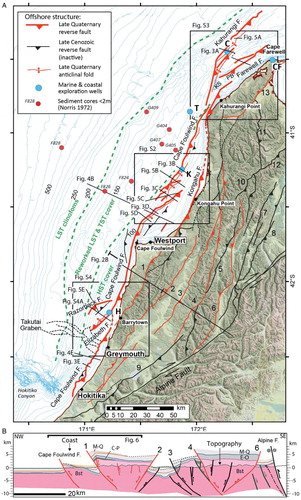
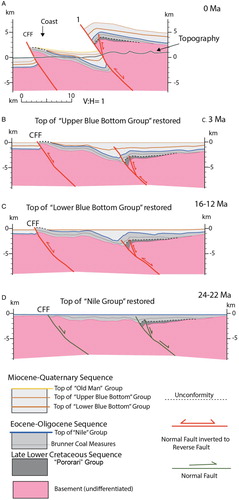
Figure 2. A, Pliocene–Quaternary faults of North Westland, lying west of the Alpine Fault (modified from Ghisetti et al. Citation2014). Reverse faults in red are compressionally reactivated normal faults. No evidence of reactivation exists for the reverse faults in black. Offshore faults in bold red belong to the North Westland deformation front. Fault names are: 1, Kongahu–Lower Buller–Canoe; 2, Inangahua–Maimai; 3, Lyell; 4, White Creek; 5, Maunga; 6, Matiri–Matakitaki; 7, Tainui; 8, Tutaki; 9, Hohonu; 10, Karamea; 11, Anatoki; 12, Pikikiruna; 13, Wakamarama. Bathymetric contours (m bsl) are from the NIWA bathymetric database (www.bathymetry.co.nz), with the contour interval at 50 m on the slope beyond 200 m water depth, and 10 m inside 200 m water depth. Green dashed lines define sedimentary systems of the last sea-level cycle (HST, highstand systems tract; TST, transgressive systems tract; LST, lowstand systems tract). B, Geological cross-section (modified from section T11 in Ghisetti et al. Citation2014); fault colours as in part A. Bst, undifferentiated metamorphic and igneous basement; C–P, Cretaceous–Paleocene units; E–O, Eocene–Oligocene units; M–Q, Miocene–Quaternary units.
In addition to industry multichannel seismic data, a mixture of sparse shallow-penetration, high-resolution seismic reflection profiles were also available (Figure S1). These include analogue single-channel airgun seismic data, boomer and 3.5 kHz sub-bottom profiles acquired by the New Zealand Oceanographic Institute (Department of Industrial Research, DSIR) and sparse seismic sections and 3.5 kHz profiles acquired by NIWA. Mineral exploration companies also collected shallow penetration (<200 m) seismic data near shore along much of the length of the West Coast, including a sparker survey by Alpine Geophysical Associates (Citation1968). The latter seismic data do not appear to have been lodged with NZP&M; however, line drawing interpretations of the sections produced by Alpine Geophysical Associates geologists are available as image files online via NZP&M in Minerals Report MR2017 (Norris Citation1978). For this study we have reinterpreted these line drawings based on observations in 3.5 kHz profiles, as well as sparker seismic sections (Van der Linden & Norris Citation1974) and seismic data reported by Stevenson (Citation2008).
Stratigraphy
The regional stratigraphy has been presented by Rattenbury et al. (Citation1998) and Nathan et al. (Citation2002), and is not discussed here in detail. Field outcrop data, boreholes and regional cross-sections (e.g. B) (Ghisetti et al. Citation2014) indicate that the key stratigraphic units of the region are present in the coastal area. Marine seismic data reveal scattered Late Cretaceous and Paleogene rift basins, such as the Takutai Graben (e.g. Bishop Citation1992) (A), and a faulted and folded cover sequence of Paleogene–Quaternary sediments (, 3). The late Early Cretaceous and Late Cretaceous sequences include coarse-grained fluvial clastics of the Pororari and Paparoa groups, overlain unconformably by terrestrial to shallow-marine Eocene sediments (Brunner Coal Measures, Kaiata mudstones) and Oligocene limestones (Cobden Formation). A regressive sequence of shelf and slope mud- and sand-rich marine sediments (Blue Bottom Group) was deposited throughout the Miocene–Pliocene (although interrupted by a regional middle Miocene unconformity and hiatus), and is overlain by Quaternary deposits. The Neogene sequence reflects uplift and sediment supply from the Southern Alps (Sircombe & Kamp Citation1998), and is characterised by clinoform progradation and channelised sequences in seismic sections.
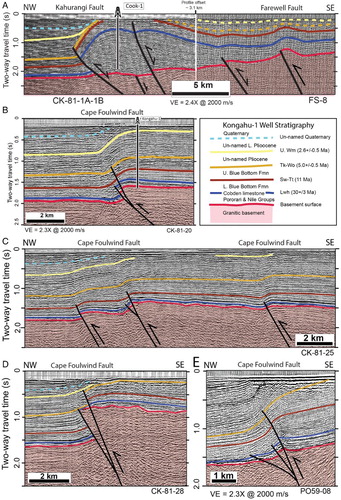
For the purpose of this study, we tied five key seismic reflections to Kongahu-1 well (B) which penetrated a near-complete Late Cretaceous–Quaternary section and traced the reflections across the deformation front between Hokitika and Cape Farewell, cross-checking the consistency of correlations at Toropuihi-1, Cook-1 and Haku-1 wells. The reflection package tied to Cobden Limestone at Kongahu-1 can be traced southwards to the seismic sections offshore of Greymouth and at Haku-1 well via profiles EZC-2, EZC-16, EZF-16 to -18, EZF-20, EZF-37 (Esso Exploration and Production NZ 1969–1970), SH81-05 (Seahawk Oil International Citation1981) and DS3-82-07 (Diamond Shamrock Exploration Oil Citation1982a, Citation1982b; Anderson Citation1985). This corresponds to the interpretation of Geosphere (Citation2009), but is not consistent with the recent study of Suggate (Citation2013) who inferred the position of Cobden Limestone offshore by correlation of seismic reflections across the coast 10 km south of Greymouth. Our identification of early Pliocene (5.0 ± 0.5 Ma) and middle Pliocene (2.6 ± 0.5 Ma) reflections tied to Kongahu-1 () provide useful markers for comparing long-term vertical displacement on the northern section of the Cape Foulwind Fault with deformation of Quaternary markers.
Figure 3. Interpretations of parts of processed seismic sections (TWT) available from http://www.nzpam.govt.nz. A, Composite seismic reflection section CK-81-1A-1B–FS8 across the Kahurangi and Farewell faults. Late Cenozoic reverse reactivation of the Kahurangi Fault is clearly documented by the harpoon-folding of syn-rift Late Cretaceous and Paleogene units in the fault hanging wall, associated with closure of normal separation of the top basement. Stratigraphy tied to Cook-1, Toropuihi-1 and Kongahu-1 (, S1) wells; dashed where inferred. B, C and D, lines CK81-20, CK81-25 and CK81-28, respectively, processed by Cultus Pacific (Citation1981); E, line PO59-08 from GECO NZ (1984). Borehole data at Kongahu-1 (Wiltshire Citation1984) have been tied to an available depth-converted section of this profile (Cultus Pacific Citation1981).
The vertical resolution of the available industry seismic data is not sufficiently high to identify the most recent activity across the deformation front. For this purpose, we interpreted the late Quaternary sedimentary sequences and identified sea-level change surfaces in the vicinity of the major faults, using the available high-resolution sub-bottom seismic profiles and the line tracings of reflection data made by Alpine Geophysical Associates (Citation1968).
In regions of high offshore sedimentation such as the West Coast, major glacio-eustatic changes in sea level of up to 120 m have a profound effect on the location of sediment depocentres as well as on the development of erosion surfaces resulting from the migration across the continental shelf or coastal plain of near-shoreline wave abrasion () (Van der Linden Citation1969; Stevenson Citation2008). Along the length of coast between Hokitika and Kahurangi Point, a lens-shaped sandy sedimentary body of Holocene age has accumulated since the last marine transgression (i.e. the present highstand systems tract, HST) (, 5) and is responsible for the smooth bathymetric contours between the coast and present water depth of c. 110 m (A). The maximum thickness of the unit typically occurs in water depths of about 50 m beneath the inner shelf.
Figure 4. Interpretation of the geometry of late Quaternary sedimentary sequences above the Cape Foulwind Fault (CFF). A, Major glacio-eustatic sea-level cycles since 140 ka (e.g. Pillans et al. Citation1998) correlated to marine oxygen isotope stages (MIS) (Imbrie et al. Citation1984). TRS2/1 and TRS6/5 are the last two shelf-wide marine transgressive surfaces. B, Line drawing interpretation of boomer seismic data, modified from Van der Linden and Norris (Citation1974) (section location on A). LST: prograding clinoforms of the lowstand systems tract (MIS2, MIS6); TST: transgressive systems tract; HST: highstand systems tract. Sediment cores (Norris Citation1972) are shown as red bars with labels; samples G409, F824, G407 and G405 are projected approximately alongstrike onto the section (see locations on A). C, Enlargement of buried geomorphic scarp associated with the fault-related monocline above the Cape Foulwind Fault, showing the footwall and hanging-wall surface projections used to estimate scarp vertical relief on profiles. Along this section the scarp is close to the approximate location of the last glacial maximum (LGM) shoreline; its height may therefore have been influenced by erosion. D, seismic data reported by Stevenson (Citation2008; modified from his figure 21) from offshore of Greymouth. TRS: transgressive surfaces. The location of the section is approximately equivalent to the box in part E. E, Our interpretation of late Quaternary sedimentary sequences in a line drawing of sparker seismic profile MR2017-44B by Alpine Geophysical Associates (Citation1968). The location of the blind Cape Foulwind Fault is from multichannel seismic data.
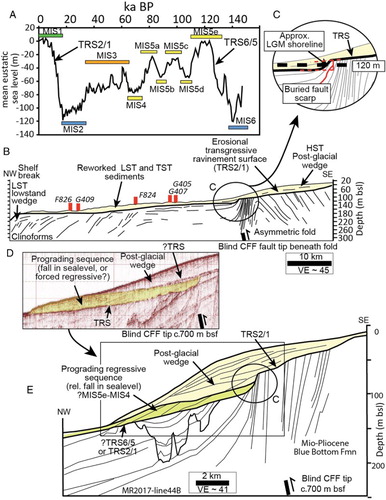
Beyond the HST sediment wedge, a low-sloping terrace extends out to present water depths of about 190 m, and is covered by clastic sediments reworked into ridges and depressions with about 10 m of relief (A, B). These are covered by a thin veneer of sandy sediment. Cores in the Karamea Bight north of Westport (A, G409, G407, G405, G404, F824 and F826), documented and dated by Norris (Citation1972), contain shallow-water shells and gravel beds with well-rounded pebbles indicative of littoral and inner shelf facies. Shell samples 1 m below the seabed have been radiocarbon dated at 19,700 ± 30 yr BP (F824) and 17,200 ± 240 yr BP (F826) from cores in 145 m and 166 m water depth. Collectively, these data indicate that the reworked sediments beneath the terrace are relict, and represent part of the postglacial transgressive systems tract (TST) deposited as eustatic sea-level rose and possibly part of the last glacial lowstand systems tract (LST, MIS2; A). Clinoforms are clearly visible beneath the outer terrace and the present shelf break at 190–200 m water depth (A, B), and largely represent the lowstand maximum sediment wedge (MIS2, and possibly older equivalents such as MIS6).
The postglacial, diachronous (c. 20–7 ka) transgressive surface (TRS2/1) which formed as a result of wave abrasion during eustatic sea-level rise is recognised as a clear erosion surface beneath the inner shelf HST (e.g. B, A–C), but its position beneath the outer shelf terrace is not clear. It potentially lies at the base of the reworked sediment cover (coloured yellow in B) if that is all TST, or in the upper part of this sequence if LST shelf sediments overlie the older clinoforms.
Figure 5. 3.5 kHz profiles recorded across the North Westland deformation front. A, Kahurangi Fault and associated anticline. B, C and D, Cape Foulwind Fault and associated monocline north of Westport. E, Razorback Fault and associated monocline off Barrytown. All data were acquired on RV Tangaroa voyage Tan1311 (see for profile locations). HST, highstand systems tract; TST, transgressive systems tract; TRS2/1, post-last glacial (<20 ka) transgressive surface.
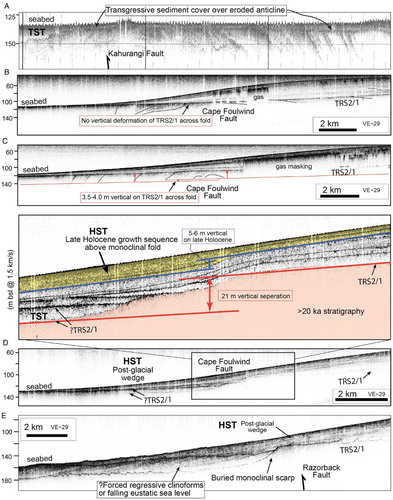
South of Cape Foulwind, the outer part of the HST is underlain by a prominent prograding unit about 20 m thick that overlies an erosion surface (D–E, E). The prograding unit, referred to by Stevenson (Citation2008) as the Mega Prograding Unit N, could potentially result from falling eustatic sea level, perhaps during 100–30 ka (A). If so, the erosion surface at its base likely represents the penultimate transgressive surface TRS6/5 implying that the TRS2/1 surface is shallower, perhaps at the top of the prograding sequence. Alternatively, the prograding unit could potentially represent a forced regressive sequence deposited during stable or rising eustatic sea level since the last glacial maximum (LGM). In this scenario, TRS2/1 represents the erosion surface at the base of the prograding unit. As in the northern part of the region, the TRS2/1 surface is therefore clearly imaged beneath the inner shelf but its position beneath the outer shelf remains ambiguous without well-constrained dating.
North Westland deformation front: structure and Quaternary slip rates
Six major late Cenozoic faults have been mapped in detail between Hokitika and Cape Farewell as part of this study (A, S2–S4). These include the Cape Foulwind, Kahurangi and Kongahu faults (Rattenbury et al. Citation1998; Nathan et al. Citation2002) and three structures newly named here as the Razorback, Elizabeth and Farewell faults. Collectively they extend for 320 km approximately parallel to the strike of the coast, and lie within 3–30 km from shore. The fault tips are commonly blind, typically lying a few hundred metres to >1 km beneath the seafloor (). Above the fault tips, strata are deformed into anticlinal or monoclinal folds. Our initial fault and fold mapping was undertaken using all available multichannel seismic profiles, with details at shallow levels later revised and fine-tuned where appropriate using the relatively shallow penetration sparker, boomer and 3.5 kHz source data (Figures S1–S4).
Cape Foulwind Fault
The Cape Foulwind Fault is a segmented reverse structure extending along the inner shelf for 240 km between Hokitika and Kahurangi Point (). The fault has a complex trace, an average strike of 030°, dips 50–60°E and has a blind upper tip, typically lying within the Miocene–Pliocene sequence 300–700 m beneath the seafloor (). The Miocene–late Quaternary units are folded above the buried fault tip, suggesting updip propagation of shortening during a prolonged period of fault displacement at depth (Ghisetti et al. Citation2014). At Cape Foulwind and immediately south of it the fault breaches through basement rocks that are uplifted close to the surface in the fault hanging wall (B). Late Cretaceous syn-rift units are preserved in the fault hanging wall, and progressive restoration of fault separation and folding by trishear mechanisms (Erslev Citation1991) with decompaction following each restoration stage demonstrates that the fault is an inherited normal fault reactivated compressionally (). This evolution is clear along the southern section of the fault between Hokitika and Kongahu Point (e.g. E), but inversion cannot be easily demonstrated for the northern section north of Kongahu Point (e.g. B–C). Nevertheless, the overall geometric segmentation of the fault is likely inherited from the original Late Cretaceous–Paleogene rift structure (Ghisetti et al. Citation2014).
Figure 6. A, Coastal part of the geological section in B, across the Cape Foulwind (CFF) and Lower Buller (1) faults. No vertical exaggeration. B, C and D, three restoration stages for the section, involving progressive removal of fault separation and folding by trishear mechanisms (Erslev Citation1991), followed by decompaction. Restoration performed with Move software (Midland Valley). Note that compressional inversion of SE-dipping normal faults started in the Miocene and continues to present day.
The southern section of the fault (between Hokitika and Cape Foulwind) lies close to the coast about 3–6 km from shore, in 20–40 m water depth (A, S4). Off Barrytown there is a change in strike, where the fault bends across an inferred basement step-over about 5 km in width. Between Barrytown and Cape Foulwind, where Late Cretaceous–Paleogene units are exposed in the coastal hanging wall, the total vertical displacement on the fault exceeds 3 km (A, A). There, the fault strongly controls the strike of the coastline (Nathan et al. Citation2002). Immediately north of Cape Foulwind the fault swings to a northeasterly orientation (052°) and terminates at a major 10 km wide, left step-over located 20 km off Kongahu Point (Figures S2, ). Across the step-over the faults overlap by 20 km of strike length, with all fault surfaces dipping to the southeast. Within the step-over region there is a broad anticlinal fold and at least two discrete fault traces. At its northern end the fault strikes 025°, lies in about 110 m water depth and extends for 70 km from the step-over off Kongahu Point to Kahurangi Point. Kongahu-1 well was drilled into the hanging-wall sequence about 1.5 km east of the blind fault tip (B). Off Kahurangi Point, the fault converges with the northern end of the Kongahu Fault and the southern end of the Kahurangi Fault (A, S3). Structural interconnection between these faults cannot be ruled out.
Although the fault tip is blind, fault-related folding affects the entire sedimentary cover sequence in the hanging wall up to the seafloor, as resolvable in multichannel seismic profiles (e.g. ). To evaluate the late Quaternary activity of the fault we identified deformation of the sequences and erosion surfaces imaged in the available high-resolution sub-bottom profiles. These data demonstrate that the transgressive erosion surface(s) recognised are not planar over the fault tip, but have relief of up to c. 40 m across the forelimb of the fault-related anticline/monocline (e.g. C–E, D). In addition, fanning stratal dips in the underlying Plio-Quaternary stratigraphy are indicative of progressive fold growth. This west-facing erosional scarp-like feature is now buried beneath or within the postglacial HST sediment (B–E). If the erosion surface did indeed possess an original planar geometry, then all of its present relief may have been caused by folding related to fault displacement at depth.
Multiple profiles along the strike of the fault between Hokitika and Kongahu Point (C) show a deformed prominent transgressive surface, with a fold-related relief of 10–35 m measured using the projection method illustrated in C. Our previous measurements (Barnes & Ghisetti Citation2013) were made on the assumption that this was the diachronous transgressive surface TRS2/1 (20–7 ka). However, we now recognise greater uncertainty in the identification and age of this erosion surface located on the footwall (western side) of the fault. In fact, the precise location of TRS2/1, TRS6/5 and possible intervening surfaces beneath the middle to outer shelf remains ambiguous (). Nevertheless, we find a positive spatial correlation between the section of the fault with the highest late Quaternary scarp height and the long-term displacement of late Cenozoic markers (compare A–C). One 3.5 kHz profile of the central section of the fault about 20 km north of Westport illustrates growth folding of up to 5–6 m on an undated reflection marker inferred to be in the Holocene sequence (D). In contrast to the southern and central sections of the fault, the northern section between Kongahu and Kahurangi points exhibits negligible deformation of what is almost certainly the TRS2/1 surface (B–C).
Figure 7. Vertical separation and vertical separation rates along the Cape Foulwind Fault. A, Footwall (fw) and hanging wall (hw) positions of top Basement (Bst); Lower Blue Bottom Formation (middle Miocene) (LBB); and Upper Blue Bottom Formation (Late Miocene) (UBB) as measured on the seven transects shown in part B. B, Location map of transects used for measurements of fault separation. C, Footwall and hanging-wall positions of late Quaternary erosion surfaces imaged in shallow-penetration sub-bottom profiles. Note that postglacial deformation (13–20 ka) on the northern segment of the fault is only confirmed on one sub-bottom profile (C). D, Maximum vertical separation rates on the Cape Foulwind Fault derived from the data in (C) under the assumption of three different age scenarios. See text for explanation. The smoothed grey line labelled 5pt M.A is a five-point moving average of the measurements for the 13–20 ka surface age scenario. In comparison, the horizontal green bar (labelled 1) is the separation rate determined on a late Pliocene (Mangapanian, Wm) surface interpreted in seismic data and tied to Kongahu-1 well. Comparative uplift rate data from coastal terrace sequences on the hanging wall of the Cape Foulwind Fault are defined as: 2, solid red boxes, 240–400 ka terraces of Suggate (Citation1992); 3, solid red boxes, 400–600 ka terraces of Suggate (Citation1992); 4, purple boxes, 120 ka terraces of Suggate (Citation1992); 5, yellow filled boxes, 6 ka beach terrace (Nine Mile Formation surface), (Rose, Citation2011); 6, open red box, 33–130 ka terraces (Craigs to Candlelight surfaces) of Rose (Citation2011); 7, filled green box, c. 66–123 ka terraces, Suggate (Citation1992) surfaces correlated southwards to the Greymouth–Point Elizabeth sequence by Nathan et al. (Citation2002) but plotted here using the younger dating model of Rose (Citation2011).
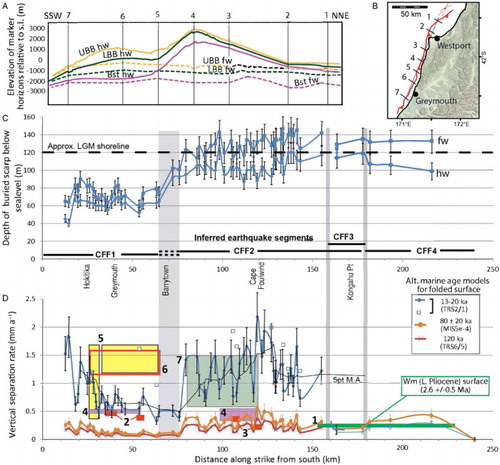
In order to estimate a maximum late Quaternary vertical separation rate along the southern and central sections of the fault we converted the buried scarp relief using three alternative age scenarios, accounting for all uncertainties in the age of the erosion surface (D). In scenario (1) all measurements refer to the TRS2/1 surface and the age of the surface at the location of each profile is derived using the method outlined by Lamarche et al. (Citation2006). This indicates the maximum vertical rate varies alongstrike from about 0.5 to 1.5 mm a–1. Scenario (2) accounts for the possibility that the surface measured is the penultimate shelf-wide postglacial transgressive surface TRS6/5, which had developed by 120 ka (A). This age produces vertical rates of typically 0.1–0.3 mm a–1. Finally, in scenario (3) the erosion surface over the fault tip could be interpreted to have developed during smaller-amplitude eustatic transgressions between 100 and 60 ka. Corresponding vertical rates range from about 0.1 to 0.5 mm a–1. For each scenario the rates are maximum values because it is highly likely that some of the buried scarp relief is paleo-geomorphic relief, representing longer term fault displacement and erosional resistance of uplifted strata on the hanging wall of the fault (SE side). Furthermore, C shows that the highest scarp height on the section of the fault between Barrytown and Kongahu Point occurs where the base of the buried scarp is close to the position of the LGM shoreline, at about 120 m below present sea level. This raises the possibility that along this section of the fault wave abrasion at the LGM shoreline enhanced the relief on the scarp (Norris Citation1978), and that the TST accumulated preferentially against the scarp during the early stages of the marine transgression.
The range of vertical rates along the southern and central sections of the fault estimated from the marine profiles is generally in good agreement with estimates of vertical uplift rate from late Pleistocene marine terraces located along the coast on the hanging wall of the fault between Westport and Hokitika. Suggate (Citation1992) determined uplift rates of about 0.2–0.5 mm a–1 for terraces he interpreted to be of age 120 ka, 240–400 ka and 400–600 ka (D). However, Rose (Citation2011) added extensive new dating of the terraces, significantly revising Suggate's age model, and derived coastal uplift rates of 1.2–1.6 mm a–1 for terraces 33–130 ka old in the Greymouth and Hokitika region. The younger age model of Rose (Citation2011) together with terrace correlations of Nathan et al. (Citation2002) indicate uplift rates in the order of 0.6–1.5 mm a–1 for terraces possibly 66–123 ka old near Westport (D). Rose noted that his late Pleistocene estimates from the Greymouth area are in agreement with Holocene rates of 1.2–1.7 mm a–1 derived from a c. 6 ka terrace preserved 7–10 m above storm base locally between Barrytown and Hokitika (Suggate Citation1992).
From the range of estimated marine and terrestrial uplift rates, we conservatively infer vertical rates of 0.5 (with uncertainties of –0.4, +1.0) mm a–1 for the Hokitika to Barrytown segment (CFF1 in ) and 0.75 (–0.55, +0.75) mm a–1 for the Barrytown to Kongahu Point segment (CFF2 in ). The northern segment of the fault between Kongahu and Kahurangi points (CFF4 in ) appears to have lower slip rates, of the order of 0.25 (–0.20, +0.15) mm a–1 (D). The raised Holocene terraces associated with the southern section of the fault, together with the probable Holocene fold growth on the central section offshore of Westport (C), imply at least one earthquake on the fault during the Holocene (possibly <6000 yr BP).
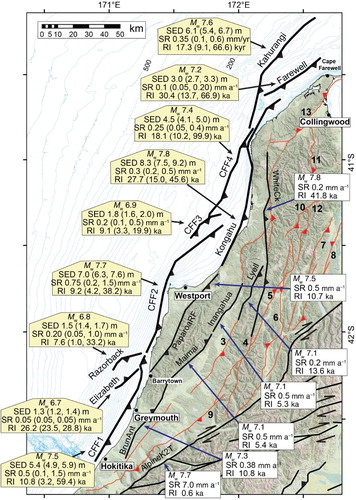
Figure 8. Interpretation of earthquake fault sources along the North Westland deformation front. Bold black lines are individual earthquake fault sources interpreted from the structures shown in , S2–S4, and from displacement data and slip-rate estimates (see for vertical separation data for the Cape Foulwind Fault segments CFF1–CFF3, and Table S2 for slip-rate estimates and other earthquake source parameters). Mw, moment magnitude; RI, recurrence interval; SED, coseismic single-event displacement; SR, slip rate. Bracketed values are minimum and maximum estimates. All calculations use the same New Zealand empirical relationships of Stirling et al. (Citation2012). Black fault lines onshore are earthquake fault sources, with associated parameters from the current National Seismic Hazard Model of Stirling et al. (Citation2012). Only the best estimates for Mw, SR and RI are indicated here for North Westland faults; however, uncertainties are shown in Table S2. Faults shown in red are late Cenozoic structures (Ghisetti et al. Citation2014), with no demonstrable activity in the last 125 ka from available data. Onshore faults labelled 1 to 10 are identified in .
Kahurangi Fault
The Kahurangi Fault lies in 90–150 m water depths, and appears to be unsegmented for about 87 km from Kahurangi Point to about 35 km NNW of Cape Farewell (A, S3). The southern 35 km section of the fault strikes 015°, whereas the northern 50 km section strikes 043°. The fault dips c. 50°E and, as evidenced by seismic reflection and borehole data, is a compressionally reactivated normal fault that bounded a half-graben rift basin of Late Cretaceous and Paleogene age (A) (Rattenbury et al. Citation1998; Ghisetti & Sibson Citation2006; Ghisetti et al. Citation2014; Reilly et al. Citation2015). The Late Cretaceous–Paleogene syn- and post-rift sequence has been largely inverted, with a total contractional structural elevation of >2 km (including fault displacement and folding). A prominent hanging-wall anticline that was penetrated at Cook-1 well is eroded near the seafloor, bringing middle Miocene Blue Bottom Formation to or very near to the seafloor. The erosion likely results from wave abrasion at or close to the lowstand maximum shoreline. The anticline has been breached by a second major imbricate splay fault that is about 20 km in length and approaches the seafloor up to 5 km east of the main trace (A, S3). Hanging-wall uplift on the southern section of the fault is associated with Kahurangi Shoals which rise to <20 m water depth, up to 60 m above the adjacent seafloor to the west.
The prominent sandy postglacial sediment wedge that characterises the inner shelf south of Kahurangi Point is not well developed between Kahurangi Point and Cape Farewell. The Kahurangi shoals are largely covered by gravels and there is significant sand transport in the littoral system that actively supplies sediment to Farewell spit (Van der Linden Citation1969). North of Kahurangi shoals the northern section of the fault underlies the middle to outer shelf terrace that is continuous with that in the southern regions and >40 km wide. The bathymetry of the terrace surface indicates complex relief associated with sediment reworking and the development of bedforms and erosional scours (A, S3). Sub-bottom profiles show that the eroded Miocene stratigraphy in the core of the Kahurangi anticline is covered by a few metres of transgressive sediments (TST) that were likely deposited on the TRS2/1 surface during the early stages of the last marine transgression (A). There appears to be a very subtle rise (a few metres) in the TRS2/1 surface over the fold structure that may result from postglacial activity on the fault and/or erosional resistance by relatively more competent beds in the core of the anticline. Based on these observations, and on the general structural and morphological similarity to the Cape Foulwind Fault, we consider that late Quaternary activity is highly likely and infer a conservatively low slip rate in the order of 0.2 ± 0.1 mm a–1.
Kongahu Fault
The reverse Kongahu Fault lies within a few kilometres of the coast and primarily offshore beneath the inner shelf north of Westport (A, S2) (Saul Citation1994; Nathan et al. Citation1996; Rattenbury et al. Citation1998; Ghisetti et al. Citation2014). The fault lies east of the Cape Foulwind Fault and directly alongstrike of the Lower Buller Fault, which extends along the Paparoa Range front south of Westport (). The Kongahu Fault is sparsely imaged in seismic data north of Kongahu Point and around the cape at Kahurangi Point (particularly notable in seismic lines CK81-05, -07, -20A and -39, EZF-28, Esso Exploration and Production NZ 1969–1970; Cultus Pacific Citation1981; and FS-28, NZ Aquitaine Petroleum Citation1968, not shown here). We interpret the fault to extend for about 120 km from near Granity (22 km south of Kongahu Point) to about 25 km north of Kahurangi Point. The fault dips 50–60°E and strikes variably between 025° and 165°, controlling the shape of the steep coastline escarpment along the length of Karamea Bight. The uplifted hanging-wall stratigraphy that is well exposed on land includes the whole sedimentary sequence of Cretaceous–Pliocene age; there is a patchy cover of Quaternary terrace sediments in the south but granitic basement is exposed in the north (Rattenbury et al. Citation1998). Monoclinal-folded Pliocene strata in the footwall are tilted to subvertical dips close to the fault (Rattenbury et al. Citation1998), while sparse fault exposures on land indicate breaching of the fold by fault propagation (Saul Citation1994).
Regional cross-sections shown in Ghisetti et al. (Citation2014) demonstrate that the fault is a compressionally reactivated normal fault that bounded the western margin of a Late Cretaceous–Paleogene graben. The total basin inversion exceeds 2.3 km of vertical deformation. Saul (Citation1994) estimated from dip-domain modelling of the southern section that the shortening rate over the last 3 Ma has been about 0.7 mm a–1. We have no late Quaternary constraints on the slip rate from offshore data. However, Saul estimated a local late Quaternary terrace uplift rate of about 0.3–0.4 mm a–1, which is likely to be equal to or less than the fault slip rate.
Farewell Fault
The reverse Farewell Fault (new name, from Cape Farewell) lies beneath the inner shelf in about 80 m water depth, 5–20 km east of the Kahurangi Fault and about 10 km west of Cape Farewell (A). The fault is imaged only sparsely by the vintage seismic data available (Figure S3), and our interpretation of its structure differs somewhat from the un-named faults mapped by Rattenbury et al. (Citation1998). The Farewell Fault dips to the east, strikes 055° and is mapped here for a length of about 45 km. The fault is subparallel to the Kahurangi Fault and the west-dipping Wakamarama Fault, which bounds the eastern margin of the inverted Late Cretaceous Pakawau rift basin (Nathan et al. Citation1986; Rattenbury et al. Citation1998; Reilly et al. Citation2015) and the seismically active Kahurangi Ranges (B).
The tip of the Farewell Fault appears to lie more than 1 km beneath the seafloor, and a fault-propagation fold has developed above it (e.g. A). The folding affects the entire cover sequence, essentially to the seafloor, including a reflection tentatively interpreted as middle Pliocene (c. 2.6 Ma). The southern section of the fault is associated with a bathymetric escarpment along the northern edge of Paturau Bank, which lies on the hanging wall and is covered by gravel and sandy substrate (Van der Linden Citation1969). There is no significant HST sediment wedge developed across the fault trace, and the late Quaternary slip rate is not constrained. Based on the uplift of Paturau Bank and the prominent escarpment along its north western margin we infer the fault was active during the late Quaternary, although the long-term rate of folding suggests its slip rate is potentially very low (c. 0.1 mm a–1).
Elizabeth Fault
The Elizabeth Fault (new name, from Point Elizabeth) lies beneath the inner shelf 10 km west of Barrytown, west (i.e. outboard) of the Cape Foulwind Fault, in about 30–90 m water depth (A, S4B). The fault is reverse, about 19 km long, is interpreted to strike 050° and is one of the few offshore faults that dips NW. The Elizabeth Fault lies 5–25 km north of the NW–SE-striking Takutai half-graben (A) (Bishop Citation1992), and its northeastern end is close to the prominent bend of the Cape Foulwind Fault NW of Barrytown. Compared to the larger-displacement (2–3 km) Cape Foulwind, Kahurangi and Kongahu faults, the Elizabeth Fault has a comparatively minor total reverse offset of the Oligocene sequence of about 80–90 m (Figure S4A).
The fault appears to have been active in the late Quaternary as evidenced by a fault-related fold that affects the Quaternary units. In sparker seismic reflection interpretations by Alpine Geophysical Associates (Citation1968), the fault-related anticline is observed in late Quaternary sediments immediately beneath an erosion surface that we consider may be the TRS2/1 or TRS6/5 transgressive surface. The erosion surface across the fold appears to be planar and unfaulted. There is therefore no evidence for any fault displacement during the post-last glacial (<20 ka) interval. We infer a very low slip rate in the order of 0.05 mm a–1.
Razorback Fault
The Razorback Fault (new name, from Razorback Point) lies beneath the shelf NW of Barrytown, in about 40–120 m water depth (A, S4B). The fault is reverse, about 22 km long and is interpreted to strike 050°, approximately parallel to the Elizabeth Fault. The Razorback Fault dips SE, therefore bounding the block uplifted in between the two faults (Figure S4A). The Razorback Fault has a reverse displacement of 80–90 m on the Oligocene sequence.
Sub-bottom profiles reveal a significant buried scarp-like feature associated with the fault-propagation fold above the Razorback Fault, resembling profiles from the Cape Foulwind Fault (e.g. E). The erosion surface at the base of the buried prograding unit has relief of 20–35 m on several lines, potentially indicating significant late Quaternary separation on the fault. Similar to the Cape Foulwind Fault scarp northwest of Westport, the buried Razorback Fault scarp lies at about 120–140 m bsl, indicating that the LGM shoreline has potentially enhanced this feature by shore-face wave abrasion at about 20 ka. We suspect that much of the buried scarp relief on the erosion surface is indeed paleogeomorphic structural relief, possibly magnified by glacial maximum shoreline erosion. Nevertheless, sparker seismic strike-lines reveal a broad seafloor ramp with as much as 10 m of relief, suggesting that some postglacial folding is likely. We infer an estimated slip rate in the order of 0.2 mm a–1.
Earthquake potential
The offshore faults described in this paper all have direct evidence of late Quaternary activity, or can be reasonably interpreted to have had such (e.g. Farewell Fault). Their reverse sense of displacement is consistent with activity in the present stress field, with horizontal axis of maximum compression (σ1) oriented 115 ± 5°, as also supported by the focal mechanisms of large historical earthquakes (B) (Anderson et al. Citation1993; Townend et al. Citation2012). It is reasonable to infer that these faults have grown progressively during moderate- to large-magnitude, ground-rupturing earthquakes (Stirling et al. Citation2012), that are likely to reoccur in the future.
We have estimated earthquake moment magnitudes (Mw), coseismic displacements and recurrence intervals using the methods and empirical relationships outlined in Stirling et al. (Citation2012). The earthquake source parameters interpreted in this study are presented in Table S1 and summarised in , where they are compared with other North Westland earthquake sources recognised in the current National Seismic Hazard Model (Stirling et al. Citation2012).
A major uncertainty is the potential length of rupture associated with large earthquakes. The Razorback, Elizabeth, Kongahu, Kahurangi and Farewell faults do not show significant segmentation or geometrical discontinuities and are therefore considered to have the potential of being ruptured along their whole lengths. However, we do not have enough data for analysing alongstrike variation in displacement. Most of the earthquake fault sources of the North Westland deformation front lie entirely offshore. An exception is the Kongahu Fault, which can be geometrically connected to the south with the Lower Buller Fault at the west margin of the Paparoa Range (; Nathan et al. Citation1996, Citation2002; Stirling et al. Citation2012; Litchfield et al. Citation2013; Ghisetti et al. Citation2014). Although an earthquake rupture on the Kongahu Fault could potentially affect the whole offshore–onshore system, here we consider the Kongahu Fault as a separate source of large-magnitude earthquakes with a rupture length of about 120 km.
The Cape Foulwind Fault extends for a total length of 240 km, with evidence of geometrical segmentation into four possible rupture segments (CFF1-4). Segment boundaries are recognised at the prominent fault bend off Barrytown, where a 5 km wide basement step-over appears likely (CFF1-2), and at prominent step-overs along the surface trace west of Kongahu Point (CFF2-4).
Collectively, we define nine earthquake sources (, Table S1) capable of generating moderate- to large-magnitude earthquakes (Mw 6.7–7.8) with c. 1–8 m coseismic displacements. The large uncertainties in slip rates are reflected by the large range (from a few thousand years to several tens of thousands of years) for potential recurrence intervals for each structure. We discuss our interpretation of the earthquake sources in the following section.
Discussion
Active faults along the North Westland deformation front appear to have been the source of historical earthquakes. Nathan et al. (Citation1996) speculated that the 1913 and 1962 Mw 6.0 Westport earthquakes may have been associated with the Cape Foulwind Fault (B), while the offshore 1868 Mw 7.2–7.6 Cape Farewell Earthquake centred between the Wakamarama and Kahurangi faults (compare B, ) has been attributed tentatively to the Wakamarama Fault (Anderson et al. Citation1994). Moderate- to large-magnitude historical earthquakes in the region have fault plane solutions consistent with north-trending reverse faults (B), with seismic slip vectors close to the azimuth of maximum compressive stress (Anderson et al. Citation1993; Doser et al. Citation1999; Leitner et al. Citation2001; Sibson et al. Citation2012). They include earthquakes resulting from activity of more than one fault set, some of which remain buried at depth, and without apparent coseismic surface rupture (e.g. 1968 Mw 7.1 Inangahua earthquake and 1962 Mw 6.0 Westport earthquakes; Anderson et al. Citation1994). Ghisetti & Sibson (Citation2006) and Ghisetti et al. (Citation2014) suggested that shortening is only partly accommodated by reactivation of inherited normal faults, and new thrust faults are presently propagating at depth (e.g. one of the two 1991 Hawk's Crag earthquakes beneath the Paparoa Range; Anderson et al. Citation1993), ramping upsection into steeper faults that control folding of the sedimentary cover.
We are concerned with identifying faults capable of generating moderate- to large-magnitude earthquakes in the region, irrespective of whether coseismic surface deformation is associated with fault rupture or distributed fault-propagation folding. In general, in any active tectonic environment several structural and environmental factors influence the expression of surface deformation. In addition, the potential preservation of earthquake signatures in the landscape depends on faulting mechanism, fault propagation to slip relationships, slip rate, magnitude of coseismic uplift or subsidence and erosional or sedimentation processes. These factors can influence the recognition, or lack thereof, of an active fault in the landscape by geologists using conventional field-based mapping observations or other surface data. In the current National Seismic Hazard Model (Stirling et al. Citation2012), faults capable of generating moderate-magnitude earthquakes (Mw 6–7), but not recognised in the landscape, are presently captured only by the background seismicity model (as ‘floating’ sources). Active reverse-slip blind faults control growth of folds that eventually become morphologically prominent over prolonged time intervals. For example, the 22 February 2011 Mw 6.2 Christchurch Earthquake was associated with a blind reverse fault <16 km long, producing only coseismic surface folding of about 1 m amplitude over a broad area (Beavan et al. Citation2011, Citation2012). In other cases of pure strike-slip, there may be little surface deformation of any sort in moderate magnitude events (e.g. 2013 Mw 6.6 Cook Strait earthquakes; Hamling et al. Citation2014). Seismic reflection datasets, such as those from North Westland, facilitate recognition of blind faults hidden in the near offshore that cannot be recognised by a field geologist. In addition, forward modelling of trishear fault propagation folding (e.g. Ghisetti et al. Citation2014) may provide further insights into the surface fold amplitudes potentially resulting from various coseismic slip and fault geometry scenarios.
Significant alongstrike variation in geometry, segmentation and total basement throw of major faults in North Westland reflect varying amounts of progressive compressional inversion of inherited normal faults (Ghisetti et al. Citation2014). This interpretation is supported by our analysis of the Cape Foulwind Fault (, ). For this reason, we have assigned crustal dips of 55 ± 10° to all of the fault earthquake sources we mapped (; Table S1). Fault propagation into the late Cenozoic sedimentary sequence occurred at low propagation/slip ratios as reflected by fault tips buried at depth >500 m beneath the seafloor, with transfer of shortening into fault-propagation folds that are restorable using trishear mechanisms (e.g. ). Folding and related uplift are therefore an important signature of late Quaternary deformation associated with these basement faults, emphasising the need for further studies to refine surface age models in both the marine and terrestrial parts of the North Westland foreland basins (e.g. Suggate Citation1992; Saul Citation1994; Rose Citation2011).
The offshore North Westland deformation front spans 320 km of coastline, includes numerous active fault segments and poses a seismic (Nathan et al. Citation1996; Stafford et al. Citation2008; Barnes & Ghisetti Citation2013) and tsunami hazard (Power Citation2013; Table S1). The principal structures, the Cape Foulwind and Kahurangi faults, extend for significant length compared to many other active reverse crustal faults in New Zealand (Stirling et al. Citation2012; Litchfield et al. Citation2013, Citation2014) and several segments appear capable of generating large-magnitude earthquakes with significant (c. 5–8 m) coseismic displacements (; Table S1). In our interpretation, the smallest earthquake sources include the Elizabeth Fault (19 km length), Razorback Fault (22 km) and segment CFF3 of the Cape Foulwind Fault (26 km). Although smaller, these fault sources are still capable of generating moderate-magnitude earthquakes (Mw 6.7, 6.8 and 6.9, respectively) and coseismic displacements of <2 m. The earthquake magnitudes estimated for activity of the North Westland earthquake sources (Table S1) are consistent with the historical seismicity in the region. Furthermore, the widespread occurrence of fault-propagation folds above blind fault tips, combined with fault growth involving low propagation/slip ratios, low slip rates and high sedimentation rates, suggest that coseismic surface deformation is likely to be generally dominated by folding rather than surface rupture scarp development.
The fault slip rates presented here (Table S1; ) revise our earlier estimates (Barnes & Ghisetti Citation2013) to better account for all available terrace uplift data from the hanging walls of the Cape Foulwind and Kongahu faults (Suggate Citation1992; Saul Citation1994; Rose Citation2011), and to incorporate uncertainties in the age of the folded late Quaternary marine transgressive surface. For simplicity, and in consideration of the large range of vertical rate data (e.g. ) and uncertainties in fold–fault geometric relationships, fault-slip rates on the Cape Foulwind Fault are assumed to be equal to vertical separation rates.
Along the marine deformation front the rates are highest on the southern segments of the Cape Foulwind Fault and diminish towards the northeast, with some slip potentially transferred from segment CFF2 onto the Kongahu Fault. The Quaternary rates there appear to approximately mimic the shape of the coastline, which is fundamentally controlled by the late Cenozoic finite displacements on these faults (Ghisetti et al. Citation2014). Our estimates of late Quaternary slip rates are in general agreement with previous estimates by Nathan et al. (Citation1996) and Power (Citation2013), and are consistent with the rates estimated for several of the onshore active faults that have generated large-magnitude historical earthquakes northwest of the Alpine Fault (B, ; Stirling et al. Citation2012; Litchfield et al. Citation2013, Citation2014). Furthermore, the earthquake recurrence intervals derived from the range of coseismic displacements and slip rates (Table S1) are generally consistent with observations of Holocene coastal uplift and folding of the marine transgressive surface on the southern and central segments of the Cape Foulwind Fault. Notably, coastal uplift of up to 7–10 m since c. 6 ka (Suggate Citation1992; Rose Citation2011), and crestal fold uplift of up to 5–6 m for the Holocene marine sediments offshore (e.g. D), could potentially represent only 1–2 earthquakes. While the largest faults are expected to produce large-magnitude earthquakes comparable to those from the northern Alpine Fault (), their recurrence intervals (7500–30,000 years) are substantially longer than expected for the Alpine Fault (c. 600 years), suggesting that their contribution to regional seismic hazard is significantly less.
Conclusions
The deformation front of the North Westland foreland basins lies 3–30 km offshore and extends for c. 320 km from Hokitika to Cape Farewell. The marine deformation front is dominated by the compressionally reactivated reverse Cape Foulwind (240 km length) and Kahurangi (87 km) faults, together with the Kongahu Fault (119 km) and the three other newly named Farewell (44 km), Razorback (22 km) and Elizabeth (19 km) faults. The present configuration and geometric segmentation of the faults largely reflects inheritance from the Late Cretaceous and Paleogene rift system. The folding of a late Quaternary transgressive surface that is <120 ka (and possibly <20 ka), together with coastal uplift rates, enables estimates of fault-slip rates of the order of 0.05–0.75 mm a–1 (best estimates) with potential maximum rates on the southern and central sections of the Cape Foulwind Fault reaching 1.5 mm a–1.
Nine potential earthquake sources, including four segments of the Cape Foulwind Fault, have been characterised. Rupture lengths of about 20–120 km may result from moderate- to large-magnitude earthquakes (Mw 6.7–7.8) with c. 1–8 m coseismic displacements, and recurrence intervals typically ranging from about 7600 to 30,000 years. While the earthquake source interpretations are not unique, the recurrence intervals and displacements are consistent with observations of uplift and folding and all data consistently indicate that these fault sources represent a seismic risk to West Coast communities, including Hokitika, Greymouth and Westport.
We hope that the recognition of active faulting, quantification of deformation rates and characterisation of earthquake source potential for the North Westland deformation front will lead to future improvements not only in seismic (e.g. Stirling et al. Citation2012) and tsunami hazard (Power Citation2013) assessment, but in kinematic models (e.g. Wallace et al. Citation2007, Citation2012) that use the input of GPS and geological slip rates.
Supplementary data
Table S1. Earthquake source parameters, offshore Westland, defined using the method of Stirling et al. (Citation2012).
Figure S1. A, Map showing the available marine seismic reflection and borehole data. Open-file oil industry seismic reflection profiles and exploration well data from NZ Petroleum & Minerals (http://www.nzpam.govt.nz). Wells include CF: Cape Farewell-1; C: Cook-1; T: Toropuihi-1; K: Kongahu-1; H: Haku-1. Bathymetry contours from NIWA database, shown at 50 m intervals between 0–250 m and 250 m intervals in water depths >250 m. Additional academic (Victoria University of Wellington) and research (NIWA) multichannel seismic data acquired from RV Maurice Ewing and RV Tangaroa surveys, respectively. Offshore shallow-penetration (<150 m) high-resolution seismic reflection and sub-bottom profiler data include 3.5 kHz profiles acquired by NIWA on RV Tangaroa survey Tan1311, as well as various archived (pre-2013) single channel seismic, boomer and 3.5 kHz data. Yellow shaded area along the coast is the region in which sparker seismic profiles were acquired at a line spacing of about 3 km (Alpine Geophysical Associates Citation1968), but only line drawing interpretations of the sparker profiles made by CRA Exploration Ltd geologists were available for this study. B, Enlargement illustrating line coverage of >50 sparker profiles. Bathymetry contours in blue at 10 m intervals.
Figure S2. Map showing details of Cape Foulwind Fault segmentation west of Kongahu Point. Reverse faults in red associated with anticlines are compressionally reactivated normal faults with late Quaternary activity. Offshore structures in black are considered inactive late Cenozoic faults. Onshore faults are from Rattenbury et al. (Citation1998). Bathymetric contours (m bsl) are from the NIWA bathymetric database (www.bathymetry.co.nz). Fine grey lines show coverage of seismic reflection data (see Figure S1); solid lines are multichannel sections; dashed lines include boomer (Van der Linden and Norris, Citation1974), sparker line interpretations (Alpine Geophysical Associates, Citation1968) and 3.5 kHz sub-bottom profiles.
Figure S3. Interpretation of major late Quaternary faults and associated anticlinal folds offshore of Kahurangi Point and Whanganui Inlet. Onshore faults are from Rattenbury et al. (Citation1998). Bathymetric contours (m bsl) are from NIWA bathymetric database (www.bathymetry.co.nz). Grey lines show coverage of seismic reflection data (see Figure S1); solid lines are multichannel sections; dashed lines include NIWA single channel airgun and 3.5 kHz profiles.
Figure S4. A, Seismic reflection section EZF-37 (Esso Exploration & Production NZ, 1969–1970) across the pop-up block between the Razorback and Elizabeth faults. Stratigraphic markers are tied between Kongahu-1 and Haku-1 wells (, S1). B, Map showing relationship between Razorback, Elizabeth and Cape Foulwind faults west of Barrytown. Bathymetric contours (m bsl) from NIWA bathymetric database (www.bathymetry.co.nz). Grey lines show coverage of seismic reflection data (see Figure S1); solid lines are multichannel sections; sparker line interpretations (Alpine Geophysical Associates, Citation1968), and 3.5 kHz sub-bottom profiles.
Figure S4.
Download JPEG Image (4.1 MB)
Figure S3. Interpretation of major late Quaternary faults and associated anticlinal folds offshore of Kahurangi Point and Whanganui Inlet.
Download JPEG Image (2.5 MB)
Figure S2. Map showing details of Cape Foulwind Fault segmentation west of Kongahu Point.
Download JPEG Image (1.7 MB)
Figure S1.
Download JPEG Image (4.3 MB)
Table S1. Earthquake source parameters, offshore Westland, defined using the method of Stirling et al. (2012).
Download MS Word (14.7 KB)Acknowledgements
We thank John Mitchell and Helen Neil for facilitating the acquisition of 3.5 kHz sub-bottom profiles on RV Tangaroa voyage Tan1311, Scott Nodder for valuable discussions about the sedimentary sequences, and Mark Stirling and an anonymous reviewer for constructive reviews of the manuscript. Use of the Midland Valley Move v. 2012–2014 software was made possible by academic licence to the University of Canterbury and is gratefully acknowledged.
Associate Editor: Dr Pilar Villamor.
Disclosure statement
No potential conflict of interest was reported by the authors.
Additional information
Funding
References
- Alpine Geophysical Associates. 1968. Final report on the sparker survey of the marine mining concession in New Zealand. Unpublished Mineral Report MR2017. Wellington: Ministry of Economic Development.
- Anderson H, Beanland S, Blick G, Darby D, Downes G, Haines J, Jackson J, Robinson R, Webb T. 1994. The 1968 May 23 Inangahua, New Zealand earthquake: an integrated geological, geodetic and seismological source model. New Zeal J Geol Geophys. 37:59–86. doi: 10.1080/00288306.1994.9514601
- Anderson H, Webb T, Jackson J. 1993. Focal mechanisms of large earthquakes in the South Island of New Zealand: implications for the accommodation of Pacific–Australia plate motion. Geophys J Int. 115:1032–1054. doi: 10.1111/j.1365-246X.1993.tb01508.x
- Anderson R. 1985. Final report on seismic data reprocessing, PPL 38059 (Offshore Westland). Unpublished Petroleum Report PR1191. Wellington: Ministry of Economic Development.
- Australia Gulf Oil, 1973. Basic geophysical data from MV Gulfrex cruises 94–98, October 1972–January 1973. Unpublished Petroleum Report PR614. Wellington: Ministry of Economic Development.
- Barnes PM, Ghisetti F. 2013. Offshore faulting and earthquake sources, West Coast, South Island: Stage 2. MBIE Envirolink West Coast Regional Council Advice: 1237-WCRC114. NIWA Client Report WLG2013-32. Auckland: NIWA.
- Beavan J, Fielding E, Motagh M, Samsonov S, Donnelly N 2011. Fault location and slip distribution of the 22 February 2011 Mw 6.2 Christchurch, New Zealand, earthquake from geodetic data. Seismol Res Lett. 82:789–799. doi: 10.1785/gssrl.82.6.789
- Beavan J, Haines J. 2001. Contemporary horizontal velocity and strain rate fields of the Pacific–Australian plate boundary zone through New Zealand. J Geophy Res. 106(B1):741–770. doi: 10.1029/2000JB900302
- Beavan J, Motagh M, Fielding EJ, Donnelly N, Collett D. 2012. Fault slip models of the 2010–2011 Canterbury, New Zealand, earthquakes from geodetic data and observations of postseismic ground deformation. New Zeal J Geol Geophys. 55: 207–221. doi:10.1080/00288306.2012.697472.
- Berryman KR. 1980. Late Quaternary movement on white Creek fault, South Island, New Zealand. New Zeal J Geol Geophys. 23:93–101. doi: 10.1080/00288306.1980.10424194
- Bishop DJ. 1992. Middle Cretaceous-Tertiary tectonics and seismic interpretation of North Westland and Northwest Nelson, New Zealand [PhD thesis]. Wellington: Victoria University of Wellington.
- Bishop DJ, Buchanan PG. 1995. Development of structurally inverted basins: a case study from the West Coast, South Island, New Zealand. In: Buchanan JG, Buchanan PG, editors. Basin inversion. Geological Society of London Special Publication. 88:549–585. doi: 10.1144/GSL.SP.1995.088.01.28
- Breeze N, Browne G. 1999. Review of offshore petroleum data, West Coast, South Island. Unpublished Petroleum Report PR2526. Wellington: Ministry of Economic Development.
- Cultus Pacific. 1981. Operations report, Marine Seismic Survey, Karamea, NZ CK-81 PPL 38058. Unpublished Petroleum Report PR884. Wellington: Ministry of Economic Development.
- Diamond Shamrock Exploration Oil. 1982a. Final navigation Report PPL 38120/PPL 38109/PPL 38059. Unpublished Petroleum Report PR997. Wellington: Ministry of Economic Development.
- Diamond Shamrock Exploration Oil. 1982b. Seismic reflection data, PPL 38059. Unpublished Petroleum Report PR1124. Wellington: Ministry of Economic Development.
- Doser DI, Webb T, Maunder DE. 1999. Source parameters of large historical (1918–1962) earthquakes, South Island, New Zealand. Geophys J Int. 139:769–794. doi: 10.1046/j.1365-246x.1999.00986.x
- Erslev EA. 1991. Trishear fault-propagation folding. Geology. 19:617–620. doi: 10.1130/0091-7613(1991)019<0617:TFPF>2.3.CO;2
- Esso Exploration, Production NZ. 1969–1970. Final report of 1968 and 1969 Marine Seismic surveys, PPL711, Offshore Karamea. Unpublished Petroleum Report PR401. Wellington: Ministry of Economic Development.
- GECO NZ. 1984. Seismic survey conducted in PPL 38059. Unpublished Petroleum Report PR1194. Wellington: Ministry of Economic Development.
- Geosphere. 2009. Widespread energy, prospectivity report for offshore west coast South Island. Unpublished Petroleum Report PR3998. Wellington: Ministry of Economic Development.
- Ghisetti F, Barnes P, Sibson R. 2014. Deformation of the top basement unconformity west of the Alpine Fault (South Island, New Zealand): seismotectonic implications. New Zeal J Geol Geophys. 57:271–294. doi:10.1080/00288306.2013.876433.
- Ghisetti FC, Sibson RH. 2006. Accommodation of compressional inversion in north-western South Island (New Zealand): old faults versus new? J Struct Geol. 28:1994–2010. doi:10.1016/j.jsg.2006.06.010.
- Hamling IJ, D'Anastasio E, Wallace LM, Ellis S, Motagh M, Samsonov S, Palmer N, Hreinsdóttir S. 2014. Crustal deformation and stress transfer during a propagating earthquake sequence: The 2013 Cook Strait sequence, central New Zealand. J Geophys Res. 119: 6080–6092. doi:10.1002/2014JB011084.
- Imbrie J, Hays J, Martinson D, McIntyre A, Mix A, Morley J, Pisias N, Prell W, Shackleton NJ. 1984. The orbital theory of Pleistocene climate: support from a revised chronology of the dO18 record. In: Berger JIA, Hays J, Kukla G, Saltzman B, editors. Milankovitch and climate: understanding the response of astronomical forcing. Boston, MA: Reidel Publishing Company; p. 269–305.
- Lamarche G, Barnes PM, Bull JM. 2006. Faulting and extension rate over the last 20,000 years in the offshore Whakatane Graben, New Zealand continental shelf. Tectonics. 25:1–24. doi:10.1029/2005TC001886.
- Leitner B, Eberhart-Phillips D, Anderson H, Nabelek JL. 2001. A focused look at the Alpine fault, New Zealand: seismicity, focal mechanisms, and stress observations. J Geophys Res. 106:2193–2220. doi: 10.1029/2000JB900303
- Litchfield NJ, Van Dissen R, Sutherland R, Barnes PM, Cox S, Norris R, Beavan J, Langridge R, Villamor P, Berryman K, et al. 2013. A model of active faulting in New Zealand: fault zone parameter descriptions. GNS Science Report 2012/19. Lower Hutt: GNS Science.
- Litchfield NJ, Van Dissen R, Sutherland R, Barnes PM, Cox S, Norris R, Beavan J, Langridge R, Villamor P, Berryman K, et al. 2014. A model of active faulting in New Zealand. New Zeal J Geol Geophys. 57:32–56. doi:10.1080/00288306.2013.854256.
- Nathan S, Anderson HJ, Cook RA, Herzer RH, Hoskins RH, Raine JI, Smale D. 1986. Cretaceous and Cenozoic sedimentary basins of the West Coast region, South Island, New Zealand. New Zealand Geological Survey Basin Studies 1. Wellington: Department of Scientific and Industrial Research.
- Nathan S, Rattenbury MS, Suggate RP, compilers. 2002. Geology of the Greymouth area. Institute of Geological and Nuclear Sciences 1:250 000 geological map 12. Lower Hutt: Institute of Geological and Nuclear Sciences.
- Nathan S, Townsend TD, Hull AG, Cousins J. 1996. Earthquake hazard assessment for the proposed jetty site at Granity, South Island, New Zealand. Geological and Nuclear Sciences Contract Report 41540B.11. Lower Hutt: Institute of Geological and Nuclear Sciences.
- Norris, RM. 1972. Shell and gravel layers, western continental shelf, New Zealand. New Zeal J Geol Geophys. 15: 572–589.
- Norris, RM. 1978. Late cenozoic geology of the West coast shelf between Karamea and the Waiho River, South Island, New Zealand. New Zealand Oceanographic Institute Memoir 81. Wellington: Department of Scientific and Industrial Research.
- NZ Aquitaine Petroleum. 1968. Cape Farewell marine seismic survey. Unpublished Petroleum Report PR506. Wellington: Ministry of Economic Development.
- NZ Petroleum Exploration. 1970–1972. Seismic surveys of the West Coast, South Island, New Zealand. Unpublished Petroleum Report PR523. Wellington: Ministry of Economic Development.
- NZ Petroleum Exploration. 1974. Marine seismic survey PPL683 and PPL1004. Unpublished Petroleum Report PR629. Wellington: Ministry of Economic Development.
- Pillans B, Chappell J, Naish TR. 1998. A review of the Milankovich climatic beat: template for Plio-Pleistocene sea-level changes and sequence stratigraphy. Sediment Geol. 122: 5–21. doi: 10.1016/S0037-0738(98)00095-5
- Power WL, compiler. 2013. Review of tsunami hazard in New Zealand (2013 update). GNS Science Consultancy Report 2013/131. Lower Hutt: GNS Science.
- Rattenbury MS, Cooper RA, Johnston MR, compilers. 1998. Geology of the Nelson area. Institute of Geological and Nuclear Sciences 1:250 000 Geological Map 9. Lower Hutt: Institute of Geological and Nuclear Sciences.
- Reilly C, Nicol A, Walsh JJ, Seebeck H. 2015. Evolution of faulting and plate boundary deformation in the southern Taranaki Basin, New Zealand. Tectonophysics. 651–652:1–18. doi:10.1016/j.tecto.2015.02.009.
- Reyners M, Robinson R, McGinty P. 1997. Plate coupling in the northern South Island and southernmost North Island, New Zealand, as illuminated by earthquake focal mechanisms. Journal of Geophysical Research 102:15197–15210. doi: 10.1029/97JB00973
- Rose RV. 2011. Quaternary geology and stratigraphy of north Westland, South Island, New Zealand [Unpublished PhD thesis]. Christchurch: University of Canterbury.
- Saul G. 1994. The basin development and deformation associated with the Kongahu (Lower Buller) fault zone over the last 12 Ma, Mokihinui River, West Coast, South Island, New Zealand. J the Roy Soc New Zeal. 24:277–288. doi: 10.1080/03014223.1994.9517472
- Seahawk Oil International. 1981. Marine seismic survey PPL 381129. Unpublished Petroleum Report PR855. Wellington: Ministry of Economic Development.
- Sircombe KN, Kamp PJJ. 1998. The South Westland Basin: seismic stratigraphy, basin geometry and evolution of a foreland basin within the Southern Alps collision zone, New Zealand. Tectonophysics. 300:359–387. doi: 10.1016/S0040-1951(98)00254-6
- Sibson RH, Ghisetti FC, Crookbain RA. 2012. Andersonian wrench faulting in a regional stress field during the 2010–2011 Canterbury, New Zealand, earthquake sequence. In: Healy D, Butler RWH, Shipton ZK, Sibson RH, editors. Faulting, fracturing and igneous intrusion in the earth's crust. Geological Society of London Special Publication 367. London: Geological Society of London; p. 7–18.
- Stafford PJ, Pettinga JR, Berrill JB. 2008. Seismic source identification and characterisation for probabilistic seismic hazard analyses conducted in the Buller–NW Nelson Region, South Island, New Zealand. J Seismol. 12:477–498. doi: 10.1007/s10950-008-9099-x
- Stevenson I. 2008. Review of the offshore geophysical model for the seafield project Northern and Southern Target Areas, Seafield Resources Ltd. Unpublished Mineral Report MR4332. Wellington: Ministry of Economic Development.
- Stirling M, McVerry G, Gerstenberger M, Litchfield N, Van Dissen R, Berryman K, Barnes P, Wallace L, Villamor P, Langridge R, et al. 2012. National seismic Hazard model for New Zealand: 2010 update. Bull Seismol Soc Am. 102:1514–1542. doi:10.1785/0120110170.
- Suggate RP. 1992. Differential uplift of middle and late Quaternary shorelines, northwest South Island, New Zealand. Quatern Int. 15-16:47–59. doi: 10.1016/1040-6182(92)90035-Z
- Suggate RP. 2013. Late cretaceous and paleogene stratigraphy and structure linking offshore with onshore north Westland, New Zealand. New Zeal J Geol Geophys. 56:263–275. doi:10.1080/00288306.2013.844720.
- Townend J, Sherburn S, Arnold R, Boese C, Woods L. 2012. Three-dimensional variations in present-day tectonic stress along the Australia–Pacific plate boundary in New Zealand. Earth Planet Sci Lett. 353-354:47–59. doi:10.1016/j.epsl.2012.08.003.
- Van der Linden W. 1969. Offshore sediments, northwest Nelson, South Island, New Zealand. New Zeal J Geol Geophys. 12:87–103. doi: 10.1080/00288306.1969.10420228
- Van der Linden W, Norris MR. 1974. Structure and Quaternary history of Karamea Bight, South Island, New Zealand. New Zeal J Geol Geophys 17:375–388. doi: 10.1080/00288306.1974.10430398
- Wallace L, Barnes P, Beavan J, Van Dissen R, Litchfield N, Mountjoy J, Langridge R, Lamarche G, Pondard N. 2012. The kinematics of a transition from subduction to strike-slip: an example from the central New Zealand plate boundary. J Geophys Res. 117:1–24.
- Wallace LM, Beavan J, McCaffrey R, Berryman K. 2007. Balancing the plate motion budget in the South Island, New Zealand using GPS, geological and seismological data. Geophys J Int. 168:332–352. doi:10.1111/j.1365-246X.2006.03183.x.
- Wiltshire MJ. 1984. Well completion Report Kongahu-1. PPL 38058 Offshore, West Coast, South Island, NZ. Unpublished Petroleum Report PR1035. Wellington: Ministry of Economic Development.